EUR/USD:
The single currency withdrew from highs of 1.1493 Tuesday, as the European Commission, the EU's executive arm, told populist lawmakers in Italy it must make revisions to its draft budget proposal. Despite this, little change to the overall technical structure of this market was observed.
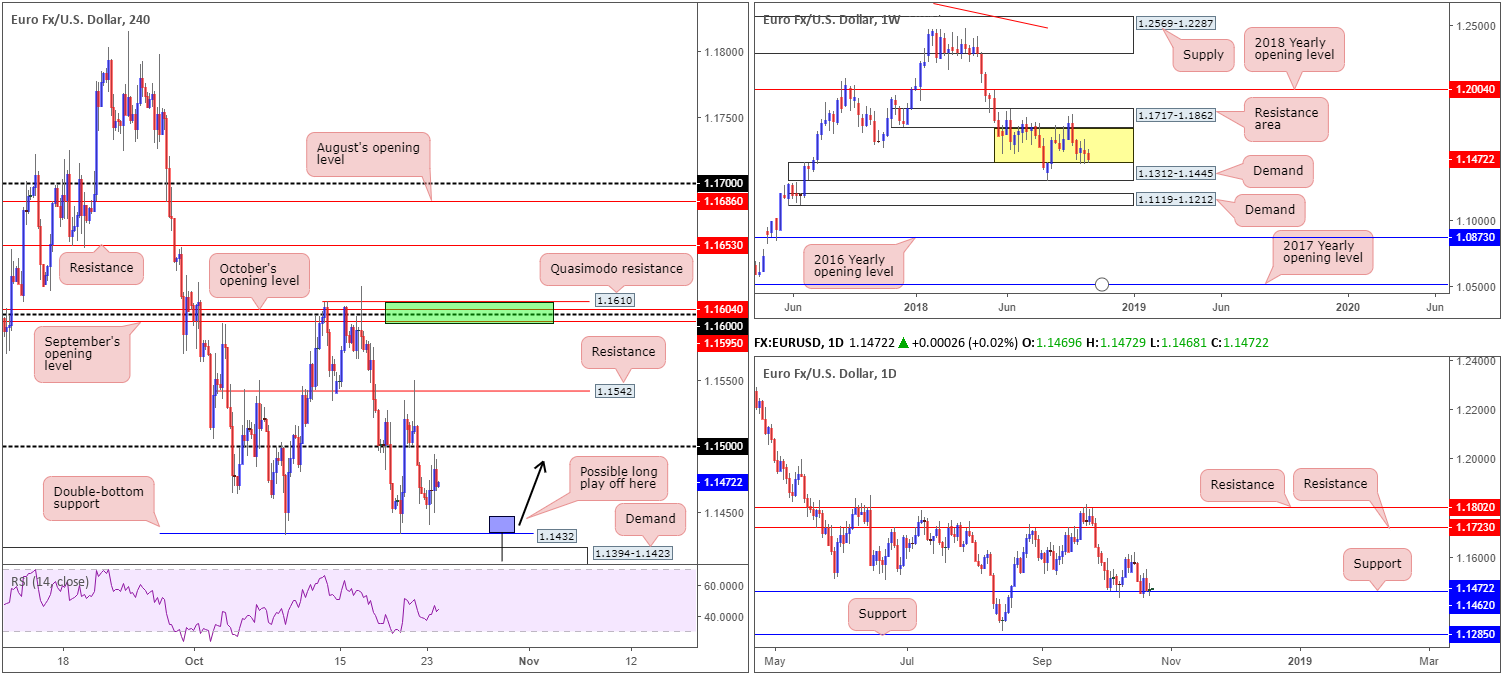
Longer term, buyers and sellers continue to battle for position around the top edge of a weekly demand at 1.1312-1.1445 and display room to extend as far north as a weekly resistance area coming in at 1.1717-1.1862 (capped upside since early June 2018). Technically speaking, this is considered a range bound market on this timeframe (yellow zone).
In connection with weekly flow, daily support at 1.1462 (boasts notable history dating as far back as early 2015) remains in the fight. Although appearing fragile at the moment, a rotation higher from here is still conceivable, targeting the 1.1621 October 16 high followed by resistance at 1.1723 (sited within the lower range of the noted weekly resistance area). Another point worth mentioning on the daily scale is yesterday’s indecision candle, which has a slight bullish twang to it.
Areas of consideration:
As highlighted in Tuesday’s briefing, a H4 double-bottom support at 1.1432 is the next downside target visible on the H4 timeframe, trailed closely by demand priced in at 1.1394-1.1423.
A fakeout through the double-bottom support into the demand base by way of a H4 bullish pin-bar formation is attractive (see chart for a visual representation). Not only will this bring in buyers from demand, it’ll take stop-loss orders from those fading the double bottom and, therefore, provide liquidity to the market for longs (remember a stop-loss order from a buyer automatically becomes a sell once triggered).
In the event the above comes to fruition, entry/stop parameters positioned according to the pin-bar structure is an option, targeting 1.15 as an initial take-profit zone.
Today’s data points: Slew of manufacturing PMIs due at the beginning of European trade; FOMC members Bostic and Mester speak.
GBP/USD:
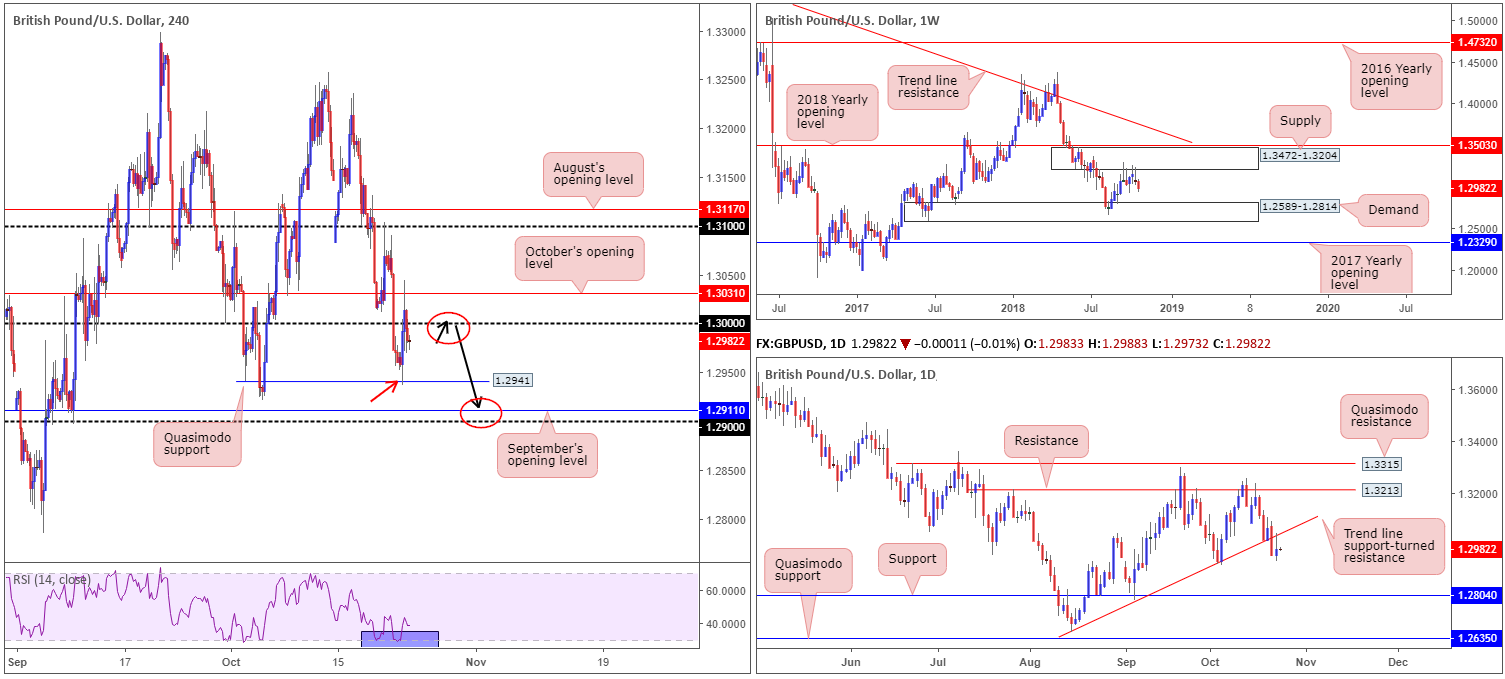
In recent news, the EU reportedly offered the UK a nation-wide customs union deal via a separate treaty from the main withdrawal agreement. Although providing fresh impetus to the pound, sending the GBP/USD market to highs of 1.3044, the pair was unable to hold on to gains as H4 price faded October’s opening level at 1.3031 and shortly after reclaimed 1.30 to the downside.
With a portion of the buying power removed from the nearby H4 Quasimodo support at 1.2941 (red arrow), further losses could be in store today towards September’s opening level at 1.2911, shadowed closely by the 1.29 handle.
The H4 timeframe’s bearish vibe is also echoed higher up on the curve. Weekly movement is seen pressing for lower ground after shaking hands with supply at 1.3472-1.3204 the week prior. The next downside objective on this scale falls in around demand at 1.2589-1.2814. In addition to this, the market also witnessed a firm break/retest of daily trend line support (extended from the low 1.2661). In the shape of a bearish pin-bar formation, potential to drive as far south as support at 1.2804 (housed within the upper limit of weekly demand at 1.2589-1.2814) is a possibility.
Areas of consideration:
Having seen all three timeframes strike a bearish tone, today’s highlight remains focused toward shorts.
A retest of 1.30 (black arrows) holding by way of a bearish candlestick formation from either H4 or H1 (stop/entry parameters can be applied according to the selected candlestick structure) is, given the overall technical picture, considered a high-probability selling opportunity. A key point to keep in mind is if the market breaks through 1.29 on the H4 timeframe, higher-timeframe support targets enter the fray: the top edge of weekly demand at 1.2814 and daily support drawn from 1.2804. That’s nearly 200 pips from 1.30!
Today’s data points: FOMC members Bostic and Mester speak.
AUD/USD:
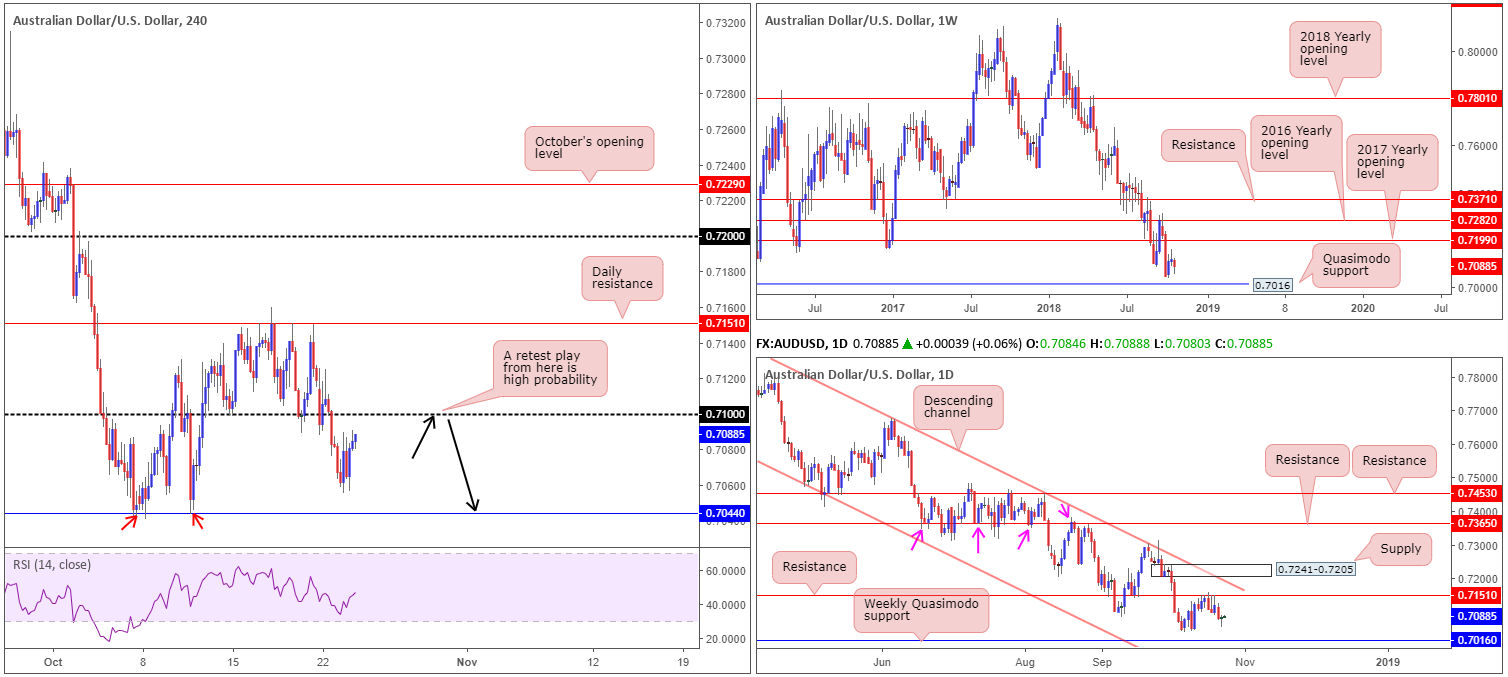
The Australian dollar regained its balance Tuesday, bottoming just north of a H4 double-bottom support etched from 0.7044. After cycling within a tight range of 30 pips, likely weighed down on USD strength, the pair is attempting to make headway towards its 0.71 handle on the H4 scale in early Asia.
The short-term outlook bodes well for those looking to sell this pair. A retest of 0.71 shaped by a H4 bearish candlestick pattern is likely enough to draw in sellers and attempt a run towards the aforementioned H4 double-bottom support (black arrows). This is also supported by higher-timeframe structure, as both weekly and daily timeframes show potential to strike as far south as 0.7016: a weekly Quasimodo support.
Areas of consideration:
Having seen price eyeing 0.71 as possible resistance this morning, traders are urged to place an alert on this number today. A retest by means of a noteworthy H4 bearish candlestick configuration (stop/entry levels typically defined from this structure), as highlighted above, would likely be sufficient enough to consider selling this market, targeting 0.7044, followed by the weekly Quasimodo support at 0.7016 as the ultimate downside objective.
Today’s data points: FOMC members Bostic and Mester speak.
USD/JPY:
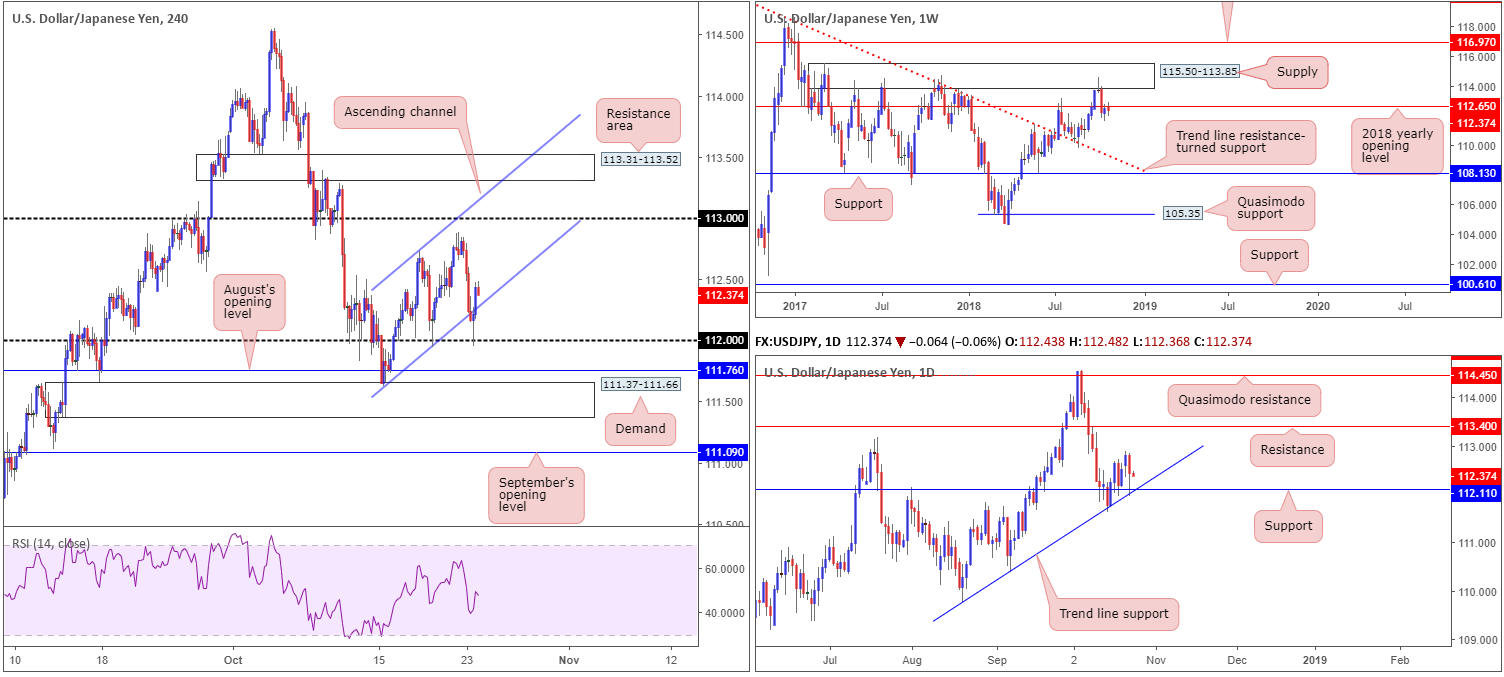
Leaving the underside of 113 unchallenged, the USD/JPY couple explored lower ground Tuesday, consequently engulfing H4 channel support (extended from the low 111.62) and touching gloves with 112. As you can see, the unit retraced a portion of its daily fall from the psychological boundary, reclaiming entry back into within the ascending channel formation amid improved market sentiment.
While weekly price recently brought in the 2018 yearly opening level at 112.65, a potential resistance, daily movement checked in with support at 112.11 yesterday that happens to intersect with a trend line support (taken from the low 109.77). With this being the case, higher-timeframe direction is somewhat rudderless at present.
Areas of consideration:
Having seen H4 action punch its way back into its ascending channel pattern, further buying towards 113 could be on the cards today. This, as we already know, is supported by daily structure, though opposed on the weekly timeframe.
As a way of confirming potential upside, traders are urged to consider waiting and seeing if H4 price retests its channel support and forms a bullish candlestick configuration. Not only does this help traders define buyer intent, it also provides stop/entry parameters as per the selected candlestick’s rules of engagement.
Today’s data points: FOMC members Bostic and Mester speak.
USD/CAD:
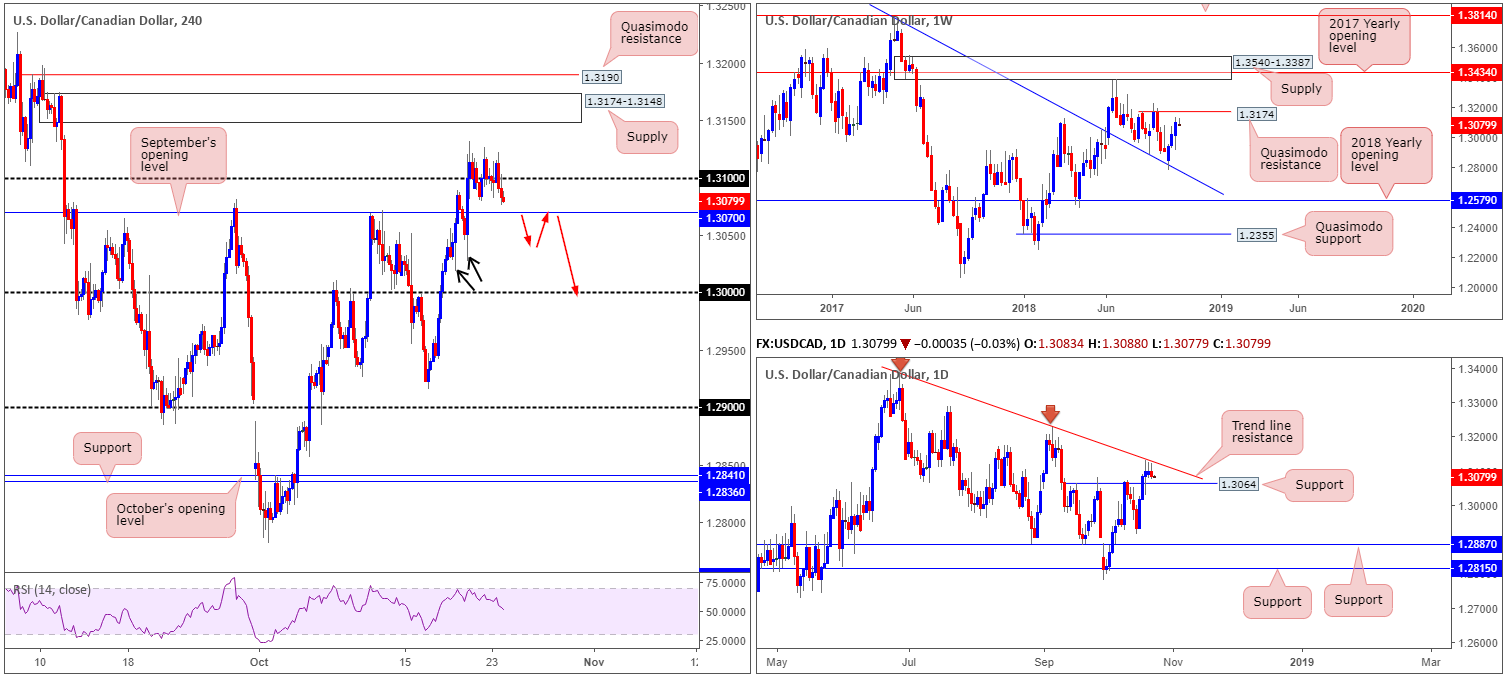
Despite crude oil falling sharply Tuesday, down nearly 5.00%, H4 movement on the USD/CAD remained relatively sedated around its 1.31 handle. In recent hours, however, the unit is seen exploring ground beneath 1.31, eyeing a possible test of September’s opening level priced in at 1.3070. A violation of this hurdle has the key figure 1.30 to target. Between 1.3070/1.30, the team notes limited demand – the two H4 tails marked with black arrows at 1.3027 and 1.3018 indicate possible demand consumption.
The story on the weekly timeframe still shows room for the market to advance as far north as the Quasimodo resistance at 1.3174. Daily flow, on the other hand, appears to be levelling off in the shape of three back-to-back candlestick wicks around trend line resistance (etched from the high 1.3386). Downside from here is capped by nearby support plotted at 1.3064 (essentially underpins September’s opening level at 1.3070 on the H4 timeframe).
Areas of consideration:
A test of 1.3070/1.3064 is likely of interest to buyers today, though caution is advised given possible selling present from 1.31/daily trend line resistance.
Should the market observe a H4 close beneath 1.3070/1.3064, a retest play (preferably by way of a H4 bearish candlestick configuration – stop/entry parameters as per the selected candlestick’s rules of engagement) to the underside of this barrier, targeting 1.30, is an is an option (red arrows).
Above 1.31, however, the focus remains on the H4 supply zone at 1.3174-1.3148 and its neighbouring H4 Quasimodo resistance at 1.3190 for possible shorting opportunities. Not only do we have a weekly Quasimodo resistance mentioned above at 1.3174 intersecting with the top edge of the H4 supply, there’s also a daily trend line resistance in view as well (see above). Irrespective of whether one selects the H4 supply to sell or the H4 Quasimodo, stop-loss order placement above the apex of the H4 Quasimodo (1.3198) is a feasible option. In terms of take-profit targets, the 1.31 handle is (without seeing the approach) the logical first step.
Today’s data points: FOMC members Bostic and Mester speak; BoC rate decision and press conference; Crude oil inventories.
USD/CHF:
USD/CHF movement, once again, proved lackluster Tuesday. With this being the case, our outlook remains unchanged going forward.
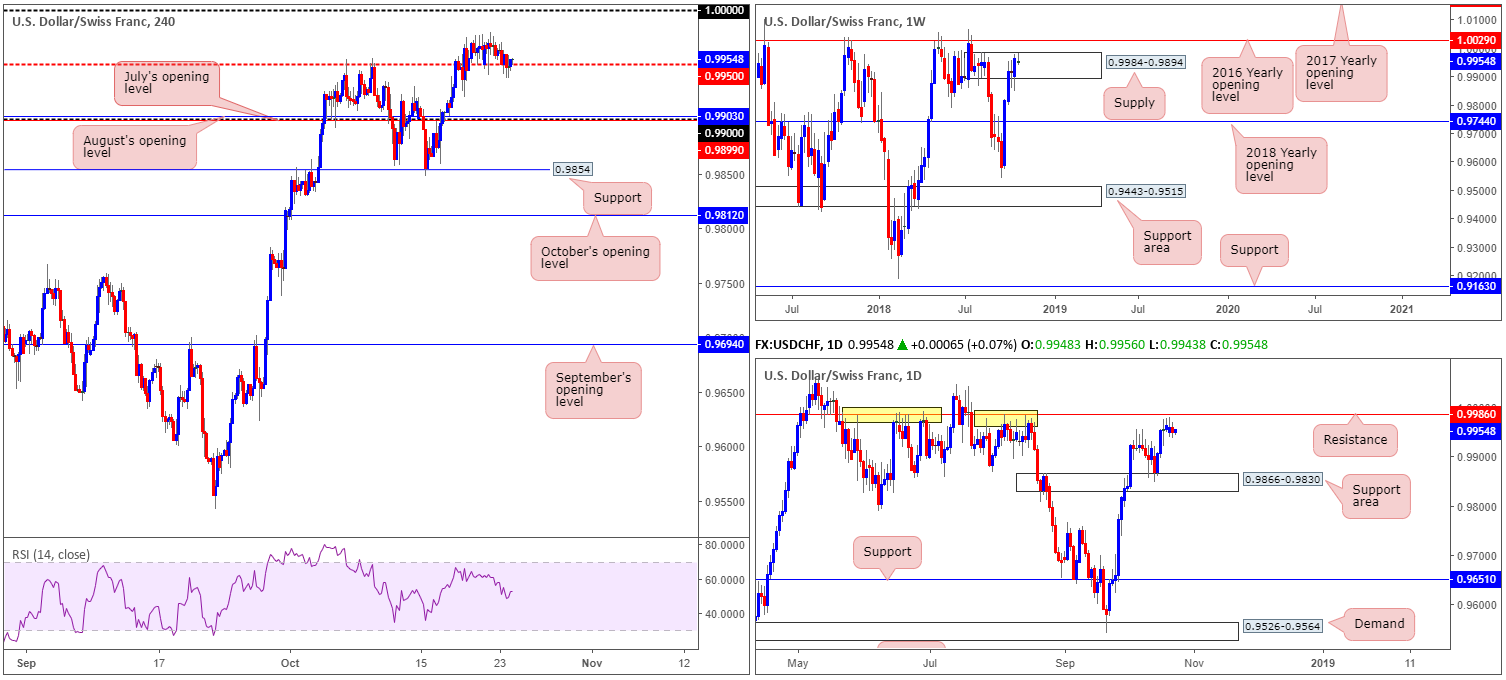
The key observation on the weekly timeframe is the recent push into supply at 0.9984-0.9894 in the shape of a bullish engulfing formation. Judging by the recent candle close and lack of selling interest over the past weeks, traders may want to pencil in the 2016 yearly opening level at 1.0029 in the event we push for higher ground this week. Daily action, nevertheless, is seen hovering beneath resistance plotted two pips beyond the current weekly supply at 0.9986. Overlooking this level would be a mistake! Check out its recent history holding price action lower (yellow points) – it’s impressive! Across the charts, the H4 candles continue to find a floor of support off its 0.9950 point, with parity (1.0000) firmly in sight as the next upside target on this timeframe.
Areas of consideration:
Based on the above reading, shorts from daily resistance at 0.9986 remains an option, with conservative stop-loss orders positioned above the 2016 yearly opening level at 1.0029 on the weekly timeframe. This helps clear any fakeout play around 1.0000, which, as most are already aware, is common viewing around psychological numbers.
In terms of downside targets from here, 0.9950 appears a logical first step, followed by the 0.99 handle. From 0.9986 to 0.99 (assuming stops are placed above 1.0029) is reasonable a 1:2 risk/reward ratio.
Today’s data points: FOMC members Bostic and Mester speak.
Dow Jones Industrial Average:
US equities began Tuesday in negative territory, amid depressed market sentiment across the board. After touching lows of 24730: the 161.8% H4 Fib ext. point at 24821, however, the index staged a strong recovery in the second half of the day, trimming a large portion of recent losses. In terms of H4 structure, active selling may reside around August’s opening level seen nearby at 25376. A decisive break of this line, nevertheless, could witness a move towards resistance at 26034.
Supporting the recent recovery is weekly trend line resistance-turned support (taken from the high 25807). Assuming the buyers continue to defend this hurdle, the next upside objective can be seen at a resistance area drawn from 25764-26157. Further adding to yesterday’s support, daily demand at 24897-25096, although suffering a break to the downside, remained in the fight and produced a reasonably nice-looking daily bullish pin-bar formation. Additional upside from this region has a daily resistance zone plotted at 25807-25603 in view.
Areas of consideration:
Intraday traders will likely be honing in on shorts today, following Tuesday’s lower low. This, according to the OVERALL picture, is a chancy move off August’s opening level at 25376, as higher-timeframe flows indicate a move towards the underside of daily and weekly resistance areas at 25603 and 25764, respectively.
According to our technical studies, the yellow H4 zone at 25815/25603, therefore, is considered the higher-probability base to consider selling from. A H4 bearish candlestick pattern printed from will likely draw in a truckload of sellers, first targeting August’s opening level at 25376, followed then by the top edge of daily demand at 25096 and then H4 support at 24957.
Traders have the option of defining stop/entry parameters by following the selected candlestick rules, or simply selling 25603 and positioning stops above 25815.
Today’s data points: FOMC members Bostic and Mester speak.
XAU/USD (Gold):
For those who read Monday and Tuesday’s briefing you may recall the piece underscored a H4 Quasimodo support located at 1220.3 as a possible buy zone. Well done to any of our readers who took advantage of this move. The metal aggressively advanced north and hit both take-profit targets yesterday: the 1230.8 October 19 high, shadowed closely by H4 Quasimodo resistance at 1234.1, and even came within striking distance of H4 supply at 1245.0-1240.3.
The reason for selecting the aforementioned H4 Quasimodo support came down to the following points:
- Reinforced by nearby H4 demand at 1215.6-1220.1.
- Daily support area at 1221.2-1207.5 bolsters H4 structure.
- After marginally engulfing a key weekly resistance at 1214.4 (now acting support), space to press higher was seen towards weekly swing resistance at 1236.6 (pink arrow – essentially represents daily resistance at 1236.9as well [the next upside target on the daily scale]).
Areas of consideration:
Going forward, there’s a strong chance the price of gold may retreat lower today/this week. Not only did we come close to connecting with H4 supply at 1245.0-1240.3, we also brought in the weekly swing resistance mentioned above at 1236.6/daily resistance at 1236.9.
So, with that in mind, a sell from the current H4 supply could be an option today, targeting 1221.2: the top edge of the daily support area.
Traders have several options here in regards to entry. Here’s two:
- Entering short at (market) 1240.3 and locating stops above 1245.0.
- Or for conservative traders, waiting for additional candlestick confirmation and entering based on this structure.

The use of the site is agreement that the site is for informational and educational purposes only and does not constitute advice in any form in the furtherance of any trade or trading decisions.
The accuracy, completeness and timeliness of the information contained on this site cannot be guaranteed. IC Markets does not warranty, guarantee or make any representations, or assume any liability with regard to financial results based on the use of the information in the site.
News, views, opinions, recommendations and other information obtained from sources outside of www.icmarkets.com.au, used in this site are believed to be reliable, but we cannot guarantee their accuracy or completeness. All such information is subject to change at any time without notice. IC Markets assumes no responsibility for the content of any linked site. The fact that such links may exist does not indicate approval or endorsement of any material contained on any linked site.
IC Markets is not liable for any harm caused by the transmission, through accessing the services or information on this site, of a computer virus, or other computer code or programming device that might be used to access, delete, damage, disable, disrupt or otherwise impede in any manner, the operation of the site or of any user’s software, hardware, data or property.


