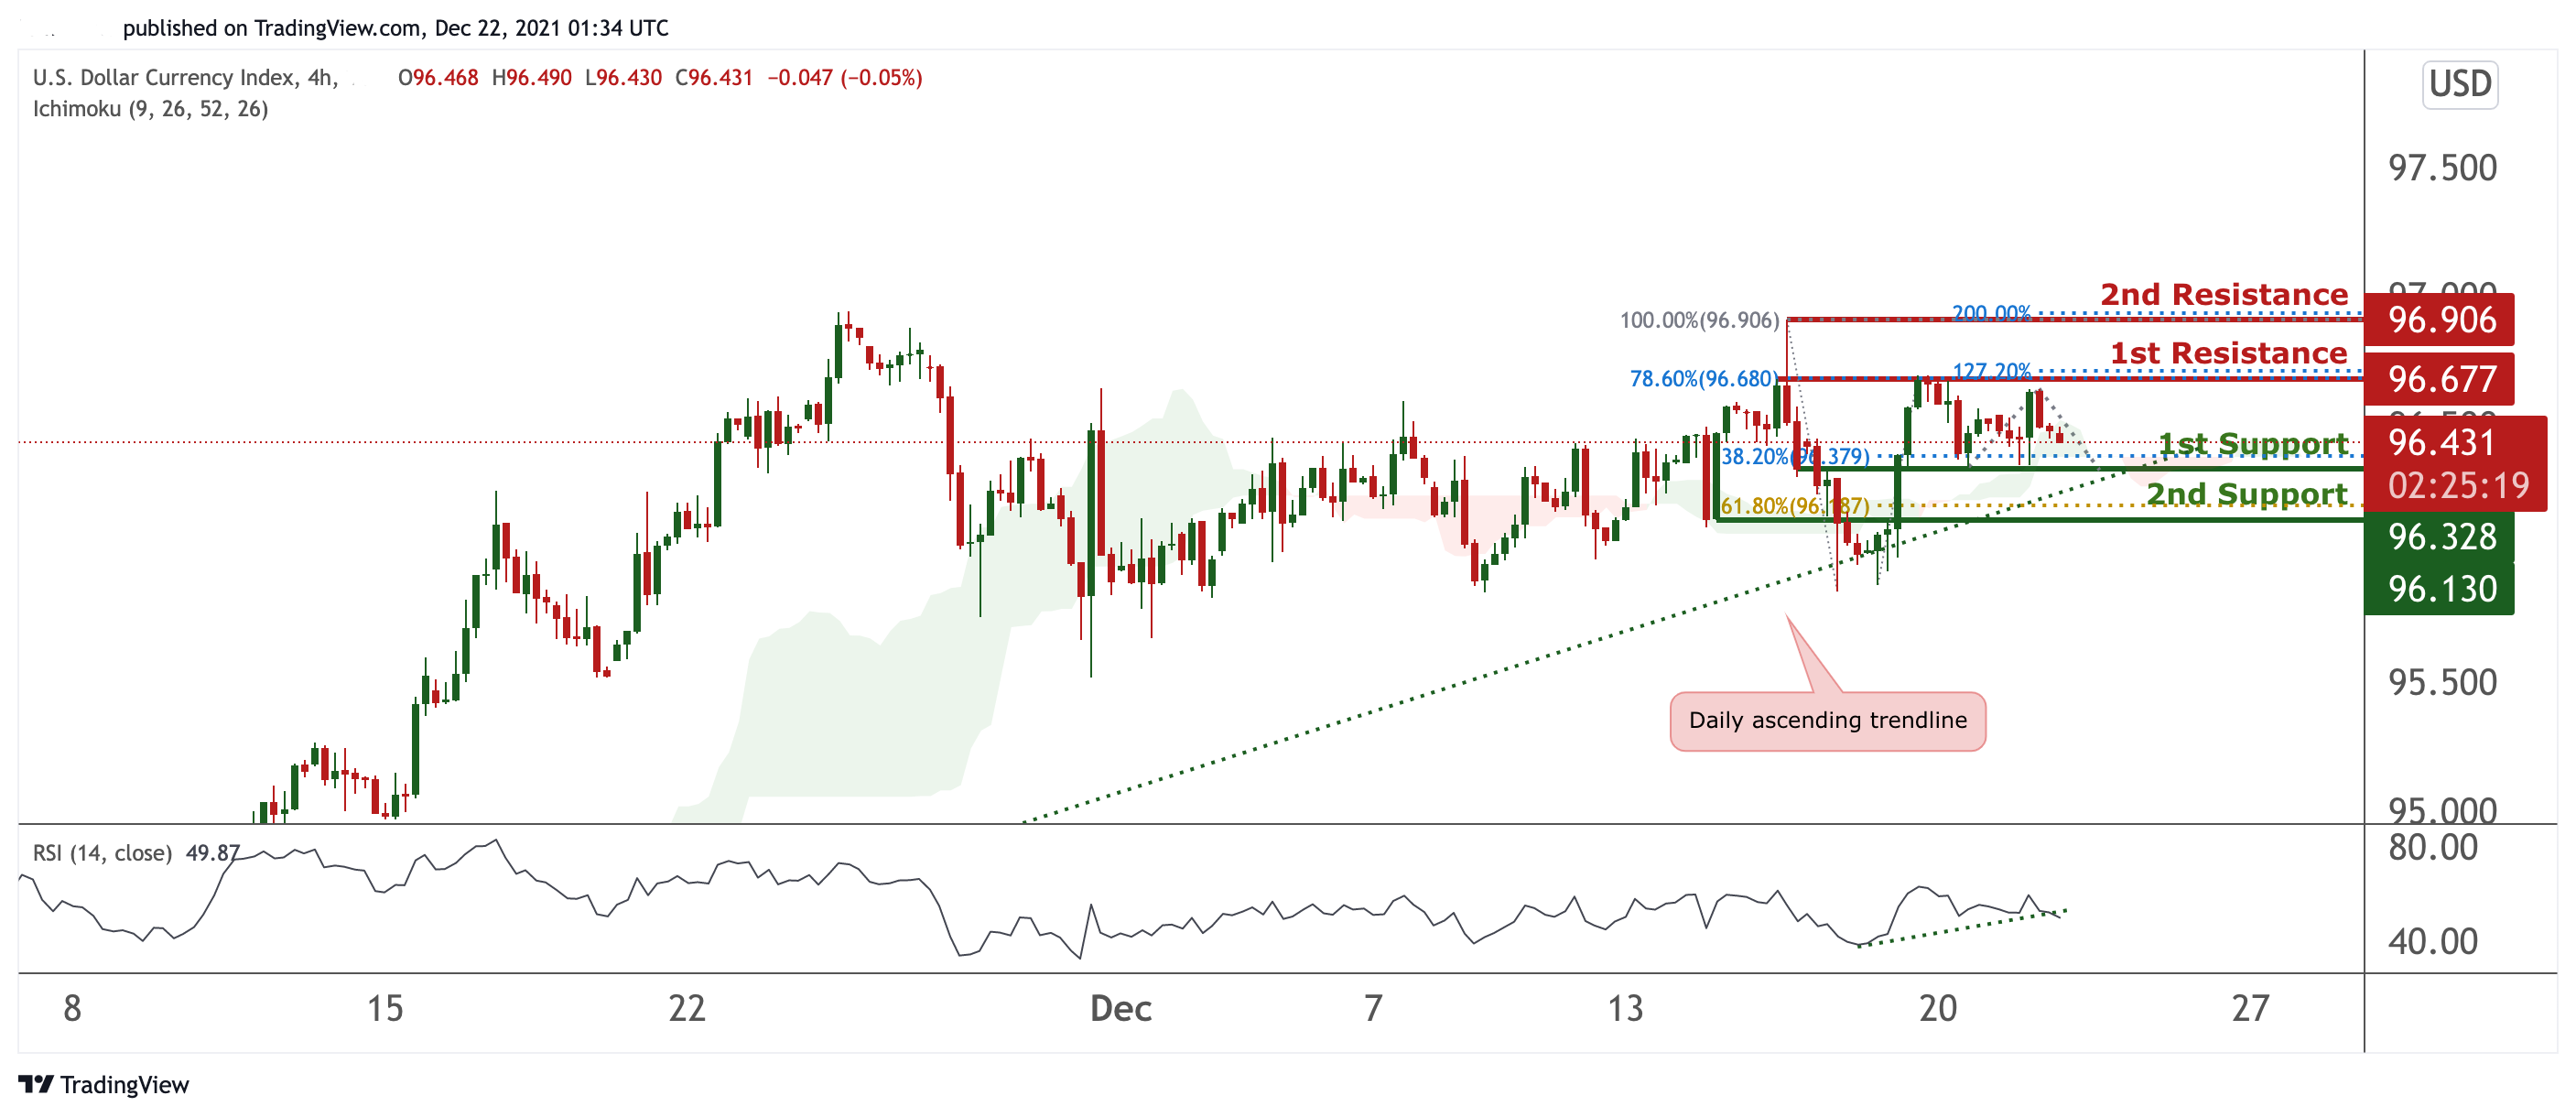
DXY:
On the H4 timeframe, prices are on a bullish momentum and abiding to our bullish trendline. We see the potential for a bounce from our 1st support at 96.328 in line with 38.2% Fibonacci retracement towards our 1st resistance at 96.677 in line with 78.6% and 127.2% Fibonacci extension. RSI and Ichimoku clouds are showing bullish momentum. Alternatively, breaking our 1st support will find prices dipping further towards our 2nd support at 96.130 in line with 61.8% Fibonacci retracement.
Areas of consideration:
- H4 time frame, 1st resistance at 96.677
- H4 time frame, 1st support at 96.328
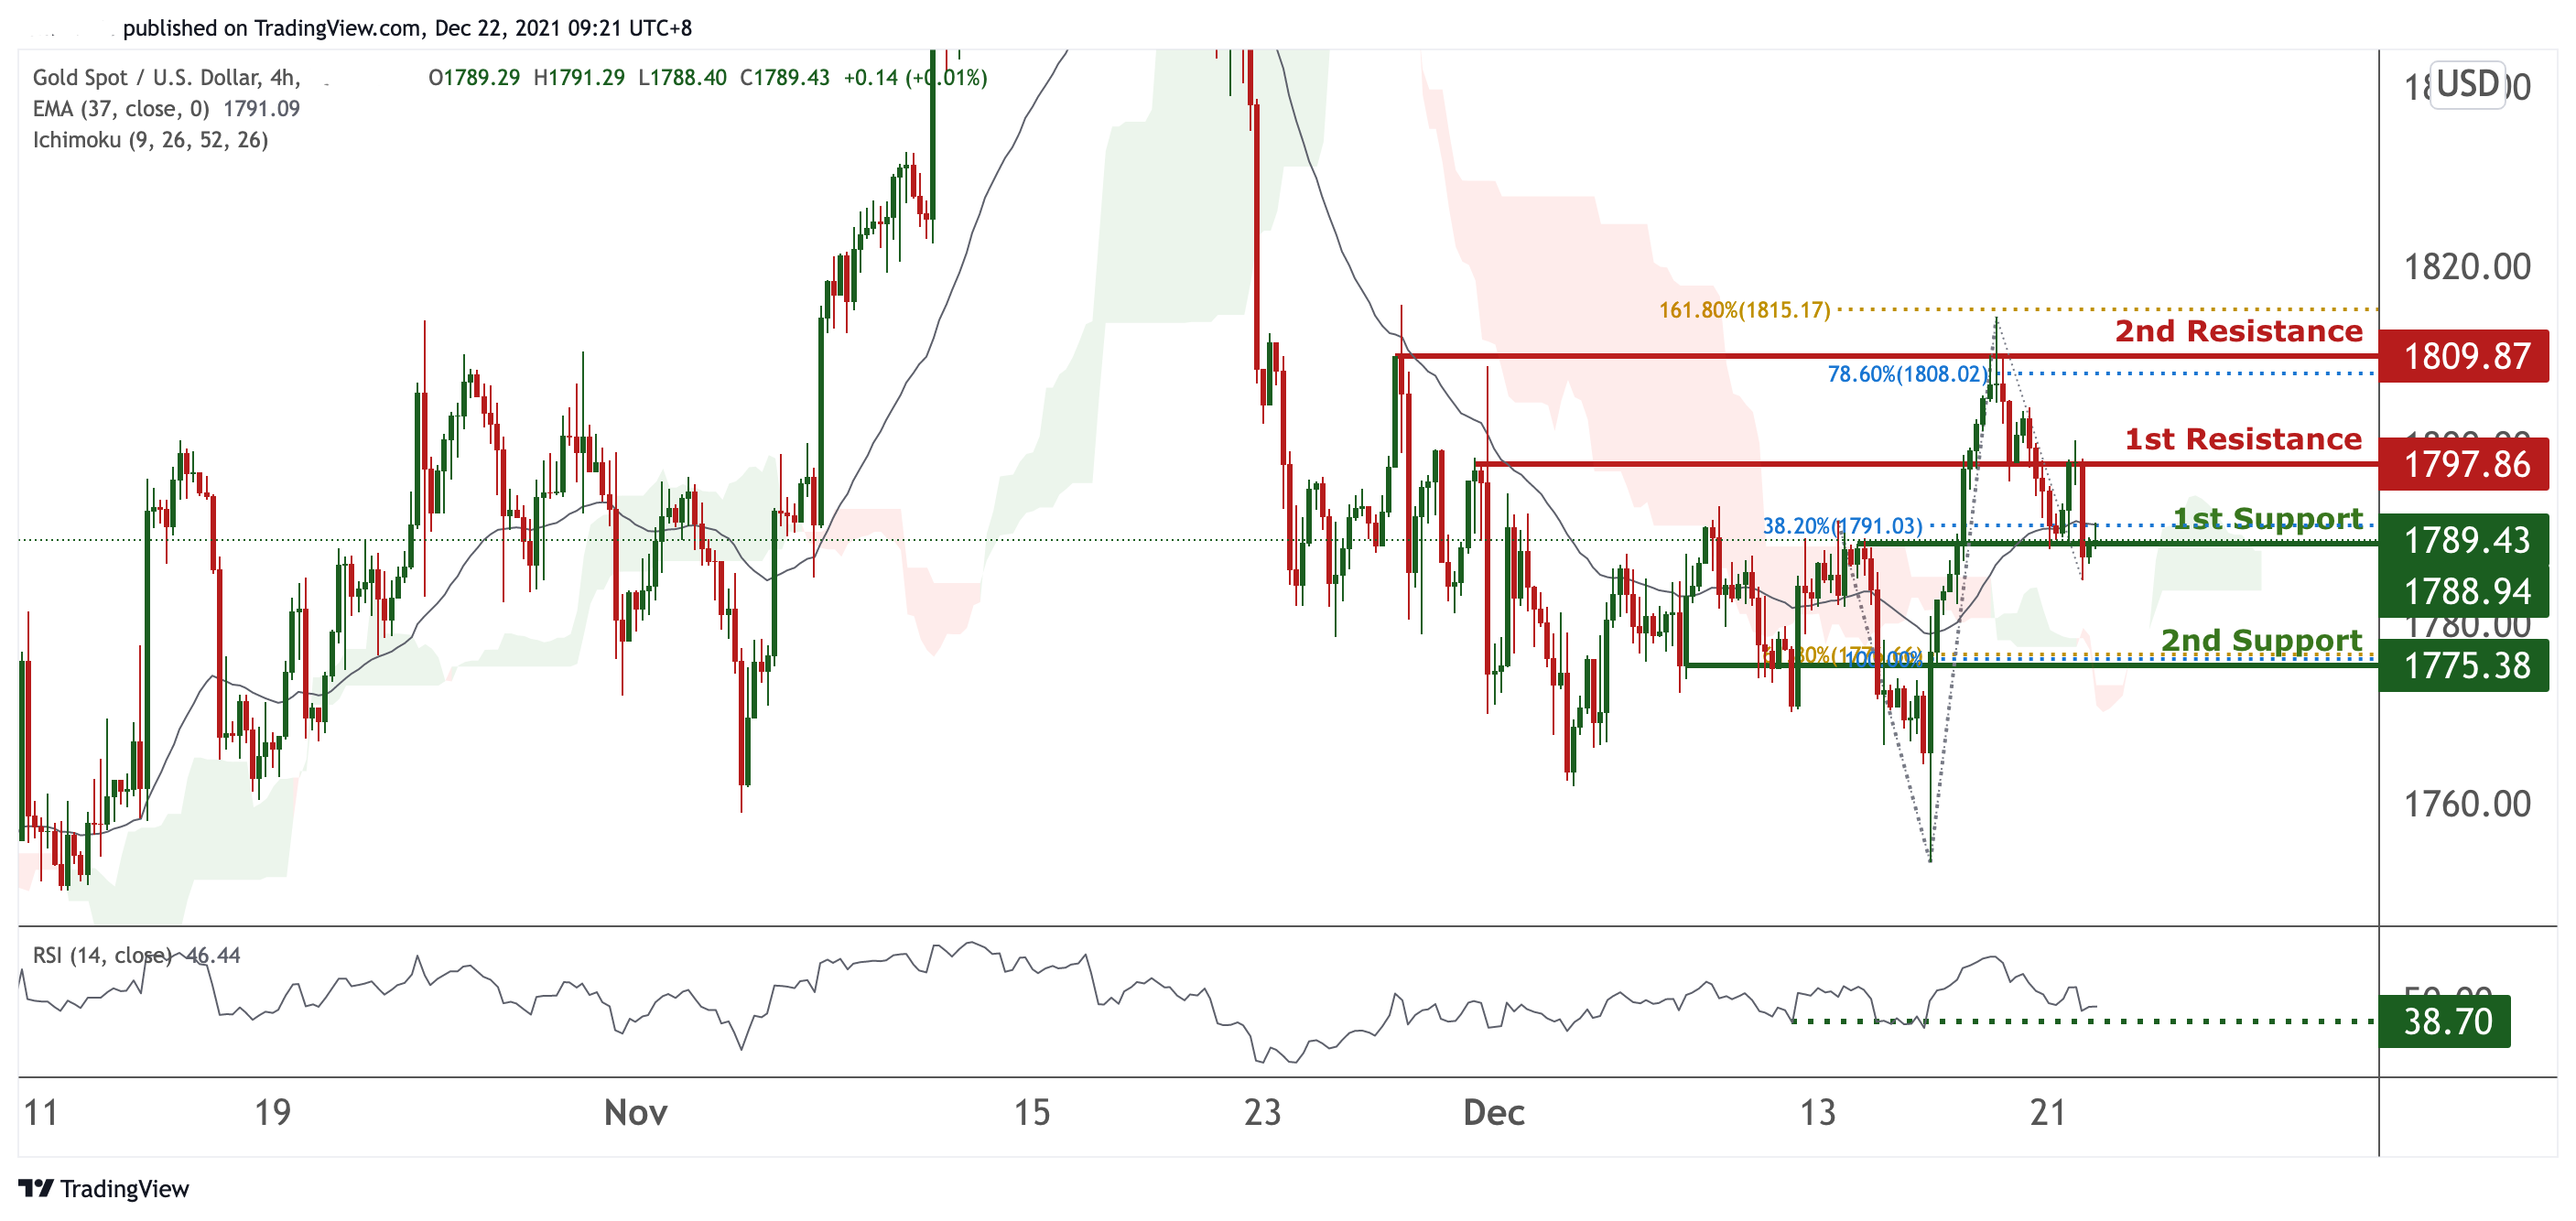
XAU/USD (GOLD):
On the H4 chart, prices are on a bullish momentum. We see potential for prices to climb from our 1st support at 1788.94 in line with 38.2% Fibonacci retracement towards our 1st resistance at 1797.86 which is a graphical overlap. Our MA 37 and Inchimoku clouds are forecasting bullish momentum. In addition, RSI are at a level where bounces previously occurred. Alternatively, breaking our 1st resistance will find prices climbing further towards our 2nd resistance at 1809.87 in line with 161.8% Fibonacci projection and 78.6% Fibonacci retracement.
Areas of consideration:
- 4h 1st support at 1788.94
- 4h 1st resistance at 1797.86
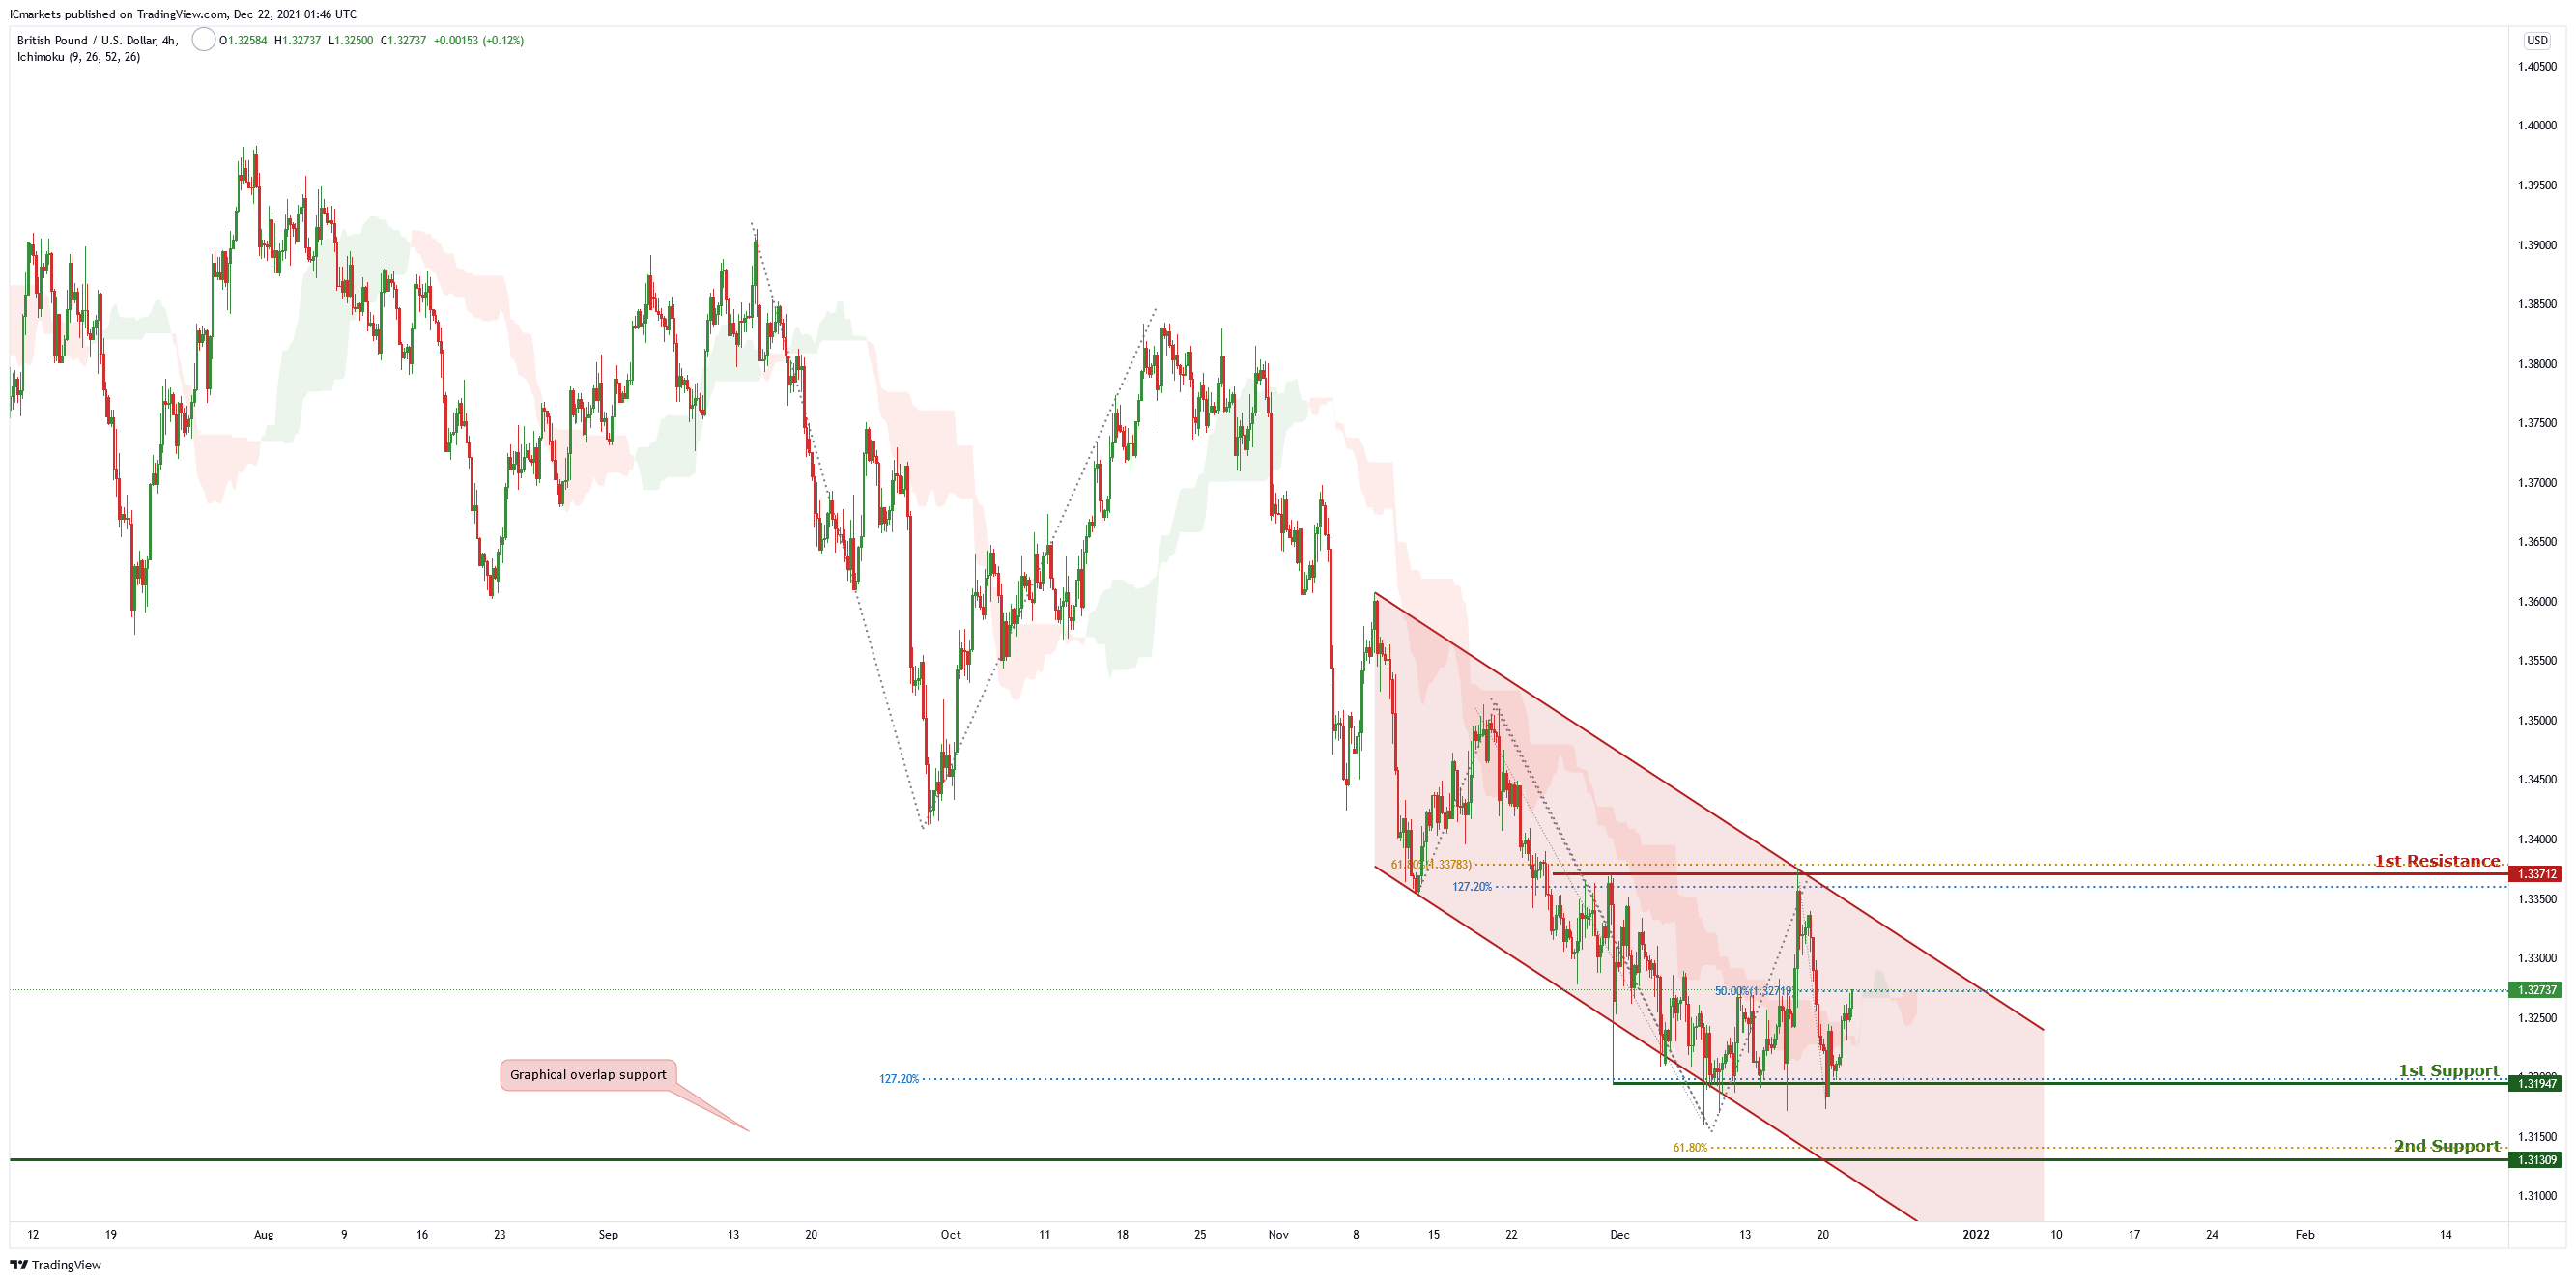
GBP/USD
On the H4 chart, price is at intermediate resistance level which is also 50% Fibonacci retracement . Price can potentially bounce to the 1st resistance level of 1.33712 which is also 61.8% Fibonacci retracement and 127.2% Fibonacci projection. Our temporary bullish bias is supported by the ichimoku cloud indicator as price is trading above it.
Areas of consideration :
- H4 1st support at 1.31947
- H4 1st resistance at 1.33712
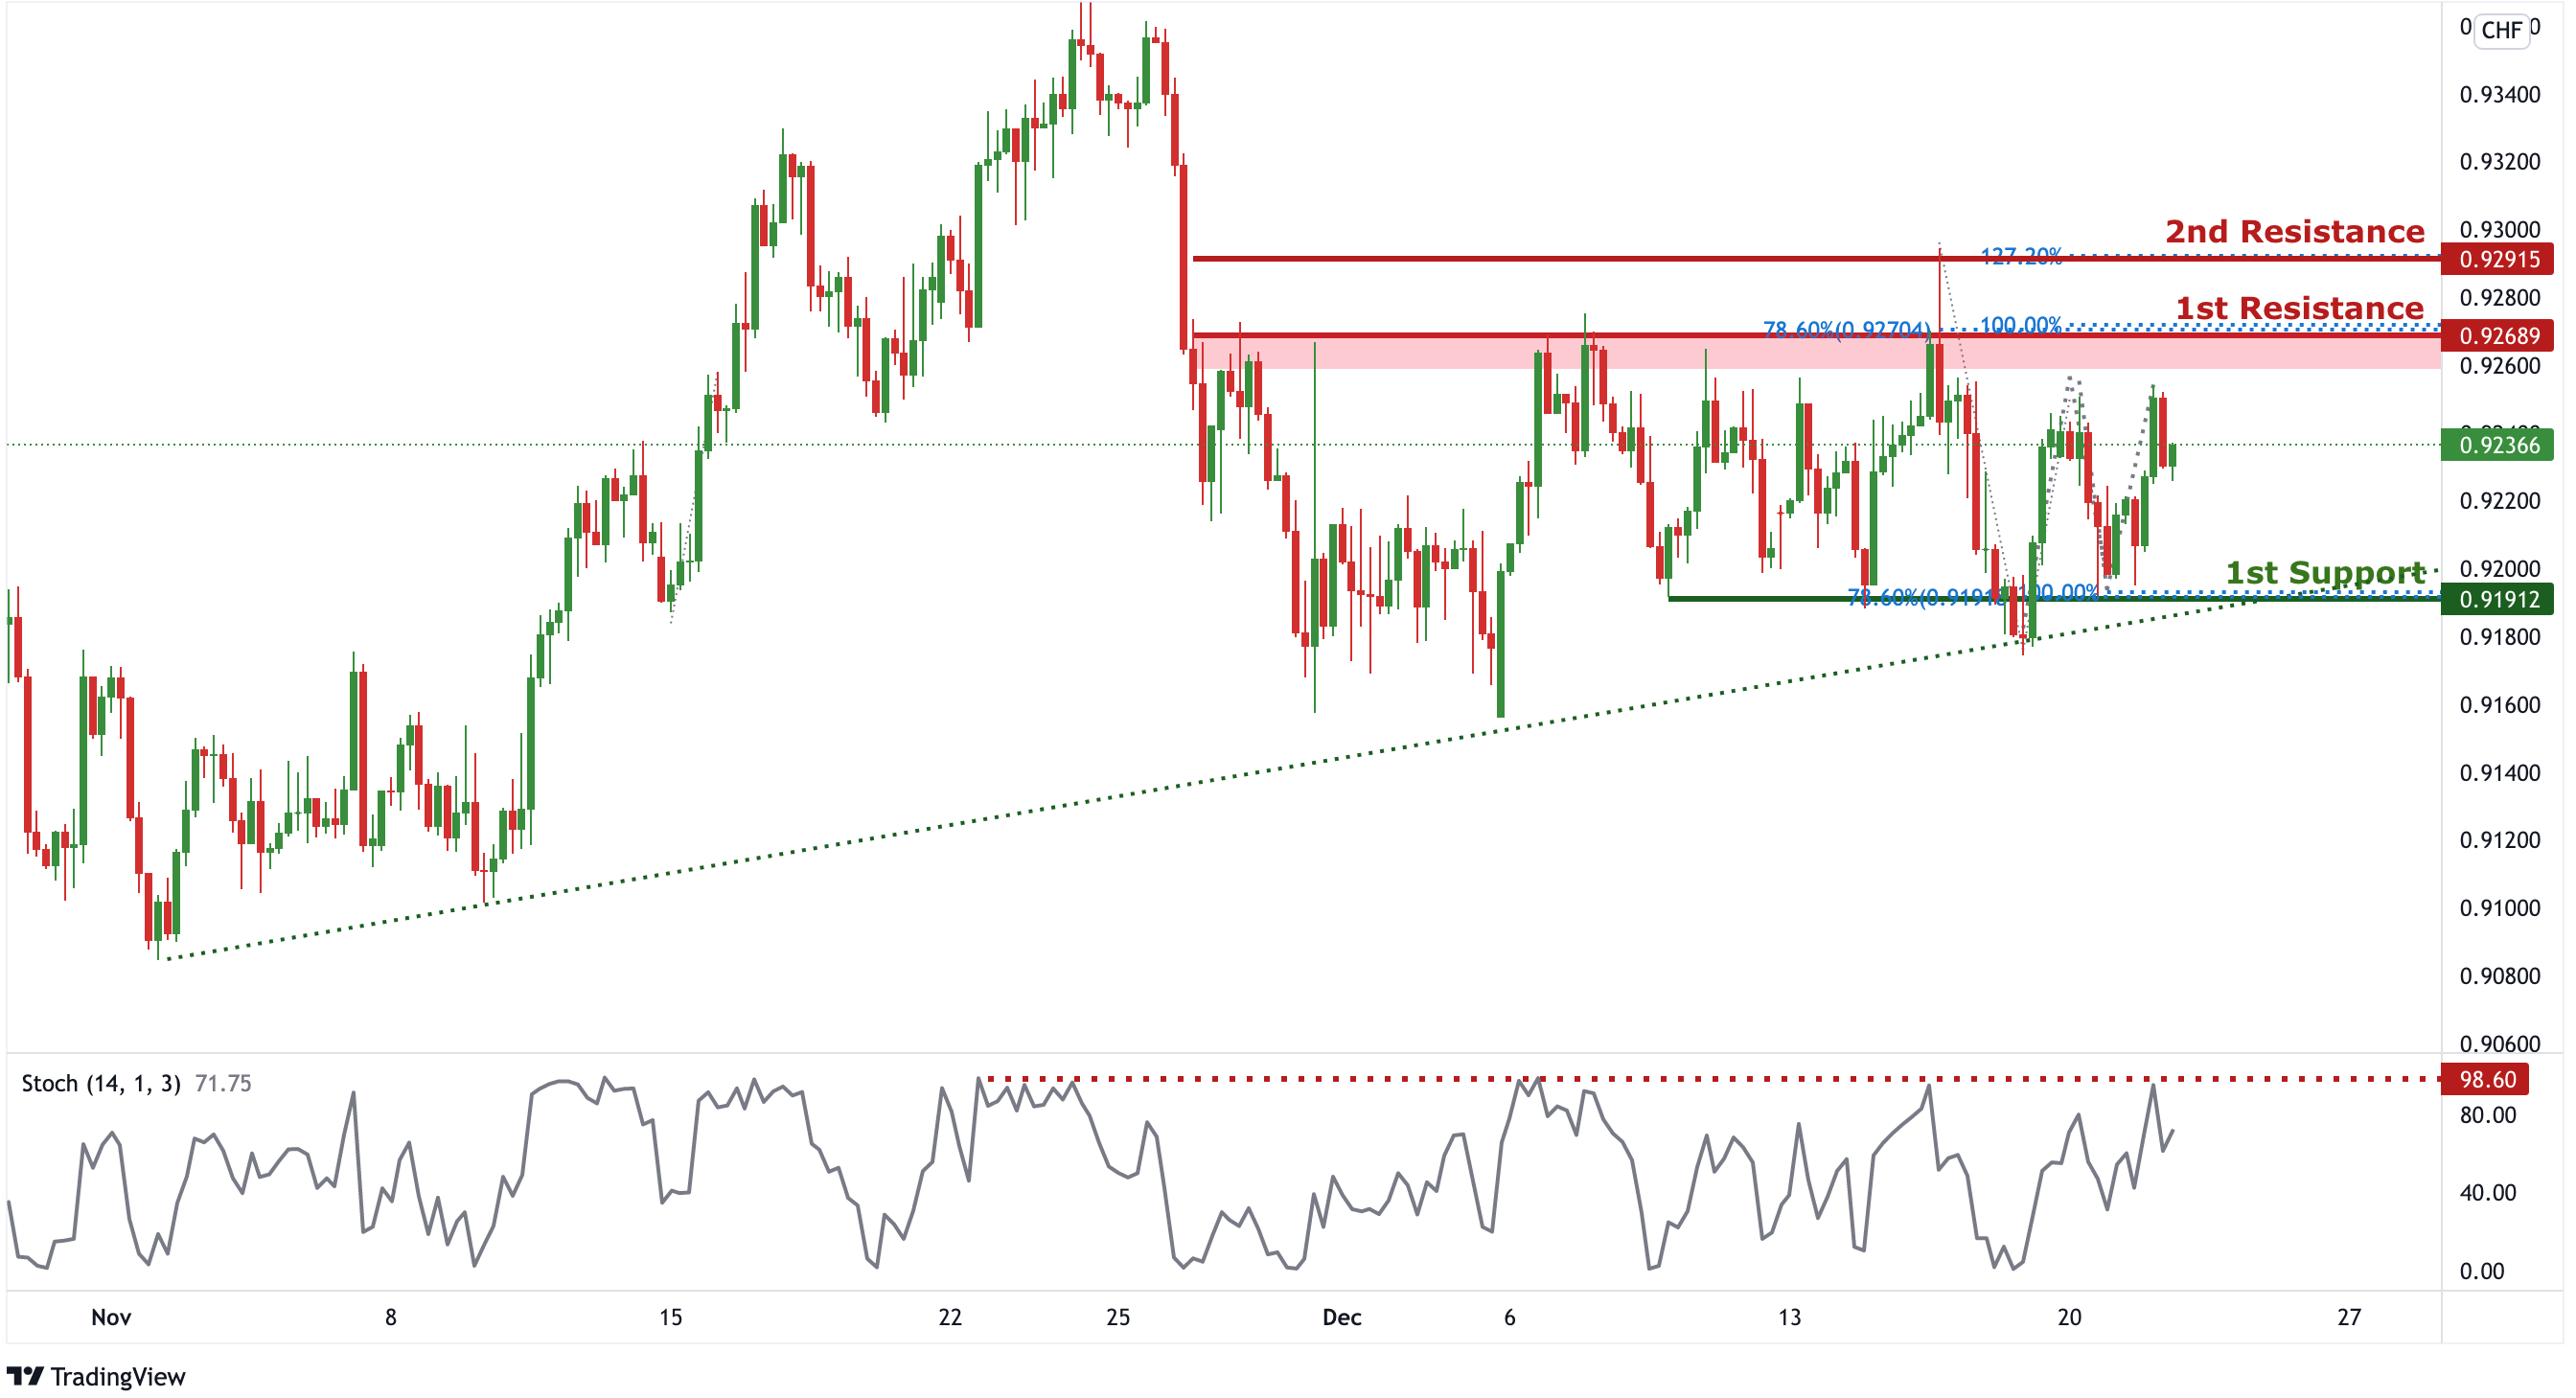
USD/CHF
In reference to yesterday’s analysis, price indeed pushed up to 1st Resistance. On the H4 timeframe, we can expect price to drop from the 1st Resistance in line with 100% Fibonacci projection, 78.6% Fibonacci retracement and horizontal resistance towards 1st Support in line with 78.6% Fibonacci retracement, 100% FIbonacci projection and horizontal support. Our short-term bearish momentum is further supported by the stochastic indicator where the %K line dropped when it approached the resistance level.
Areas of consideration:
- Watch 1st Support at 0.91912
- Watch 1st Resistance at 0.92689
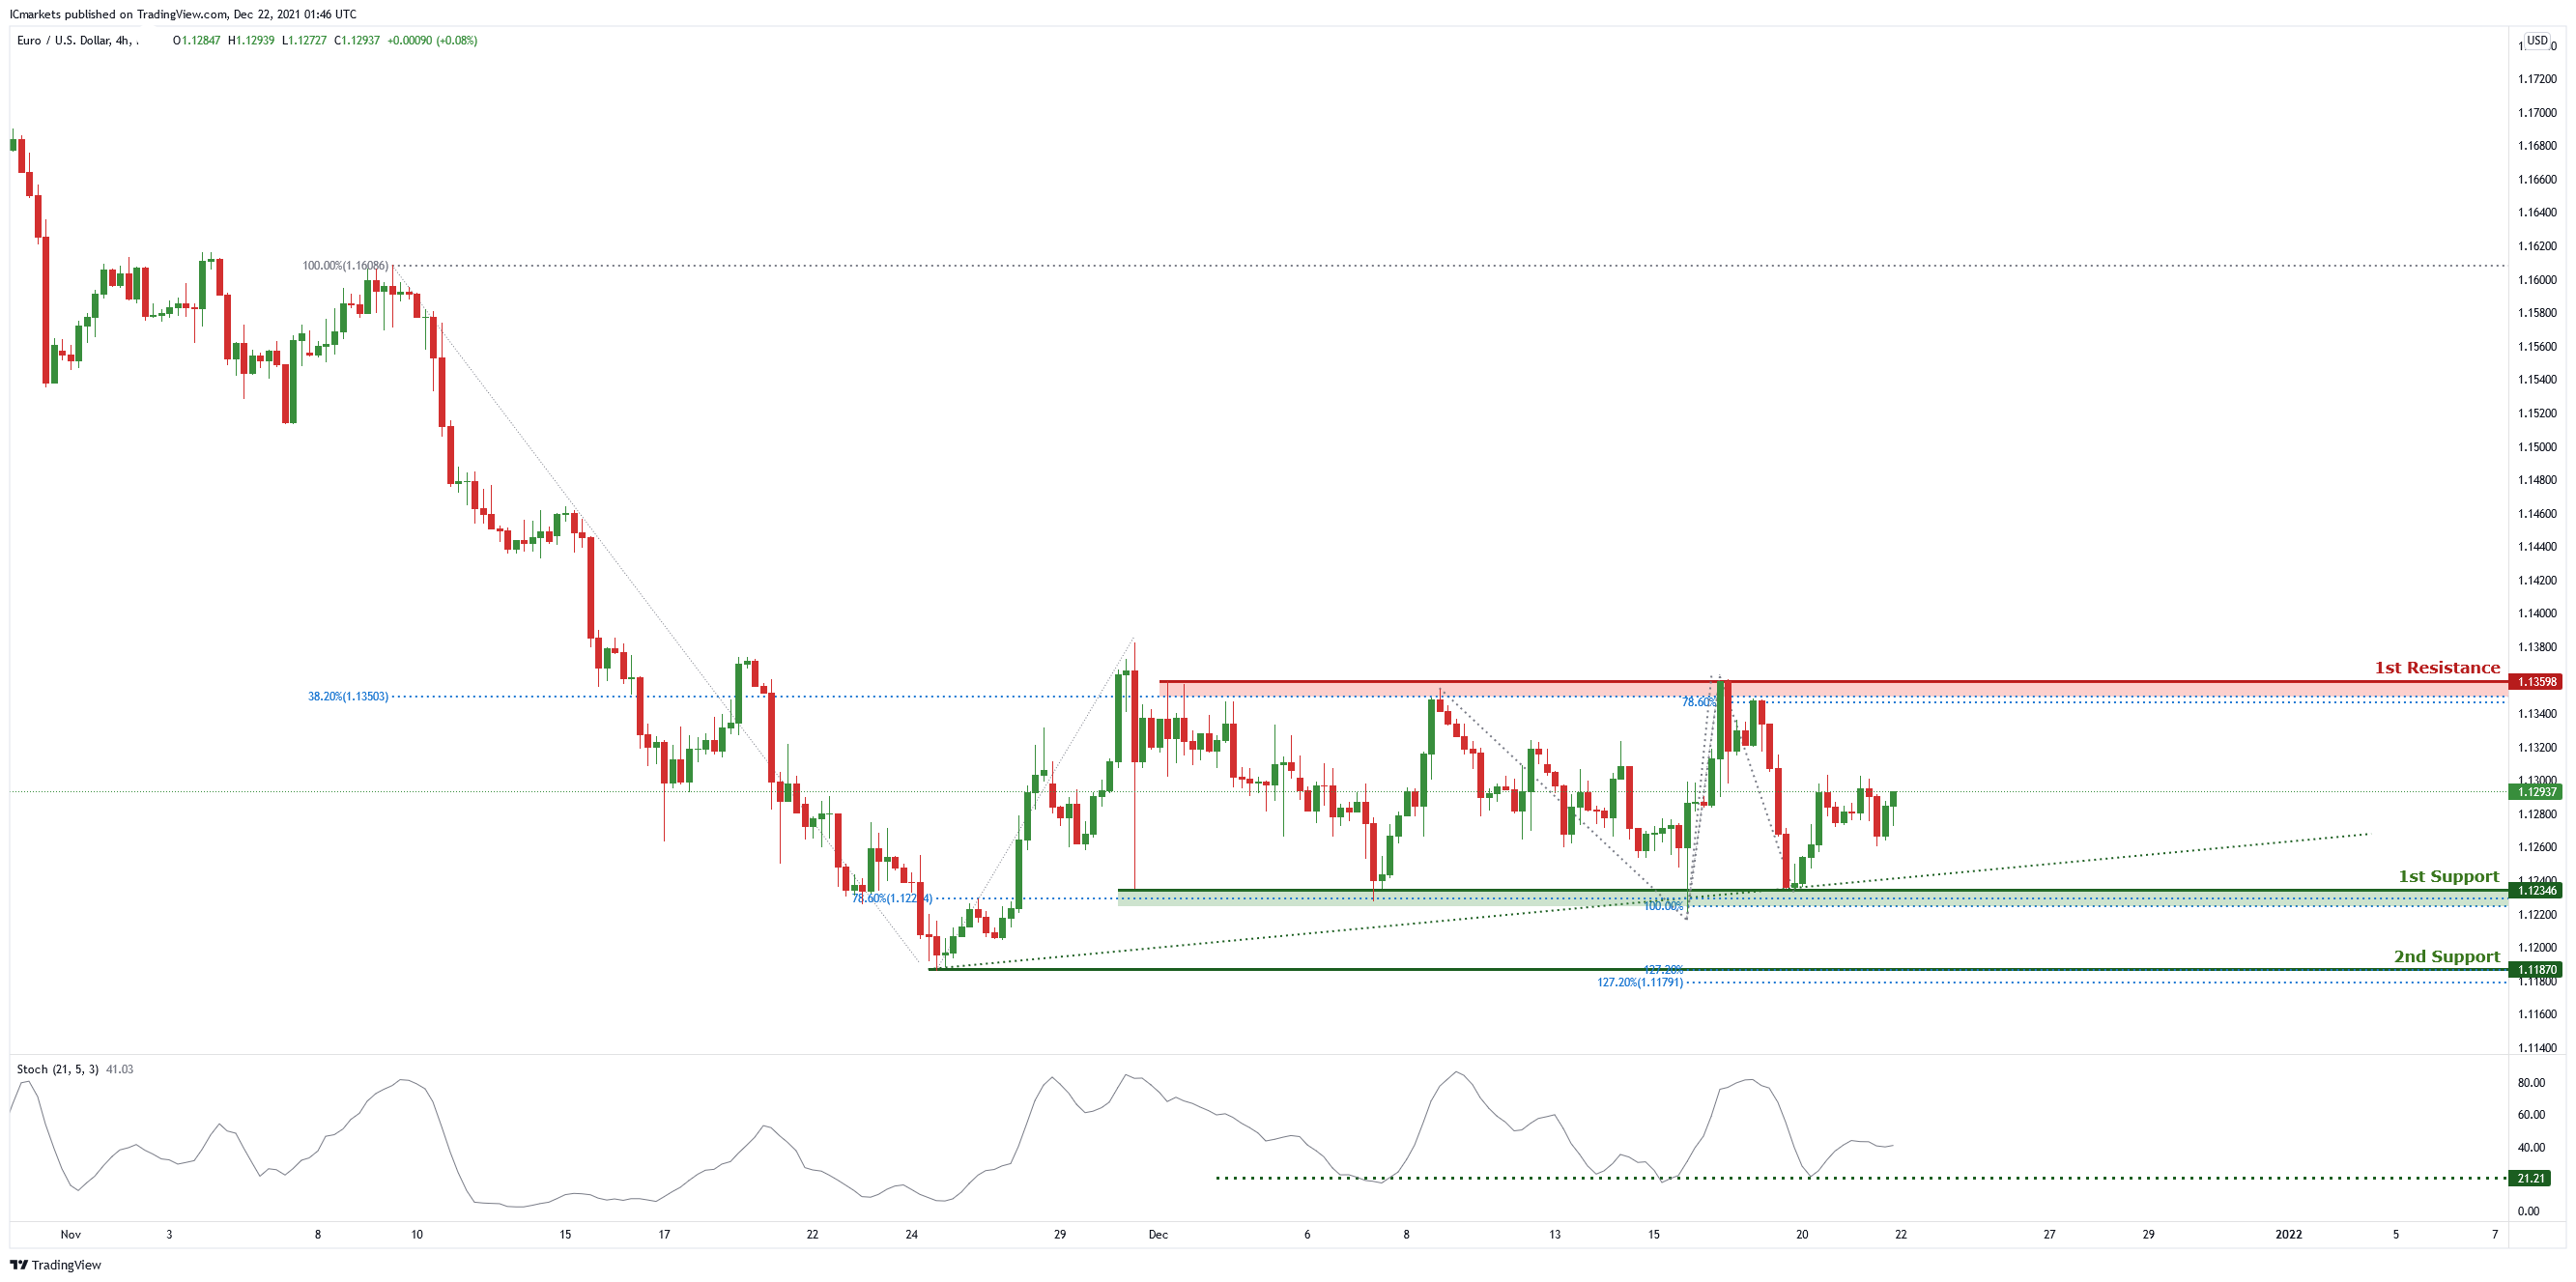
EUR/USD :
On the H4 chart price is abiding by an ascending trendline and near the 1st support level of 1.12346 which is also 100% Fibonacci projection and 78.6% Fibonacci retracement. Price can potentially bounce to the 1st resistance level of 1.13598 which is also 78.6% Fibonacci projection and 38.2% Fibonacci retracement. Our bullish bias is supported by the stochastic indicator as it is at support level.
Areas of consideration :
- H4 1st resistance at 1.13598
- H4 1st support at 1.12346
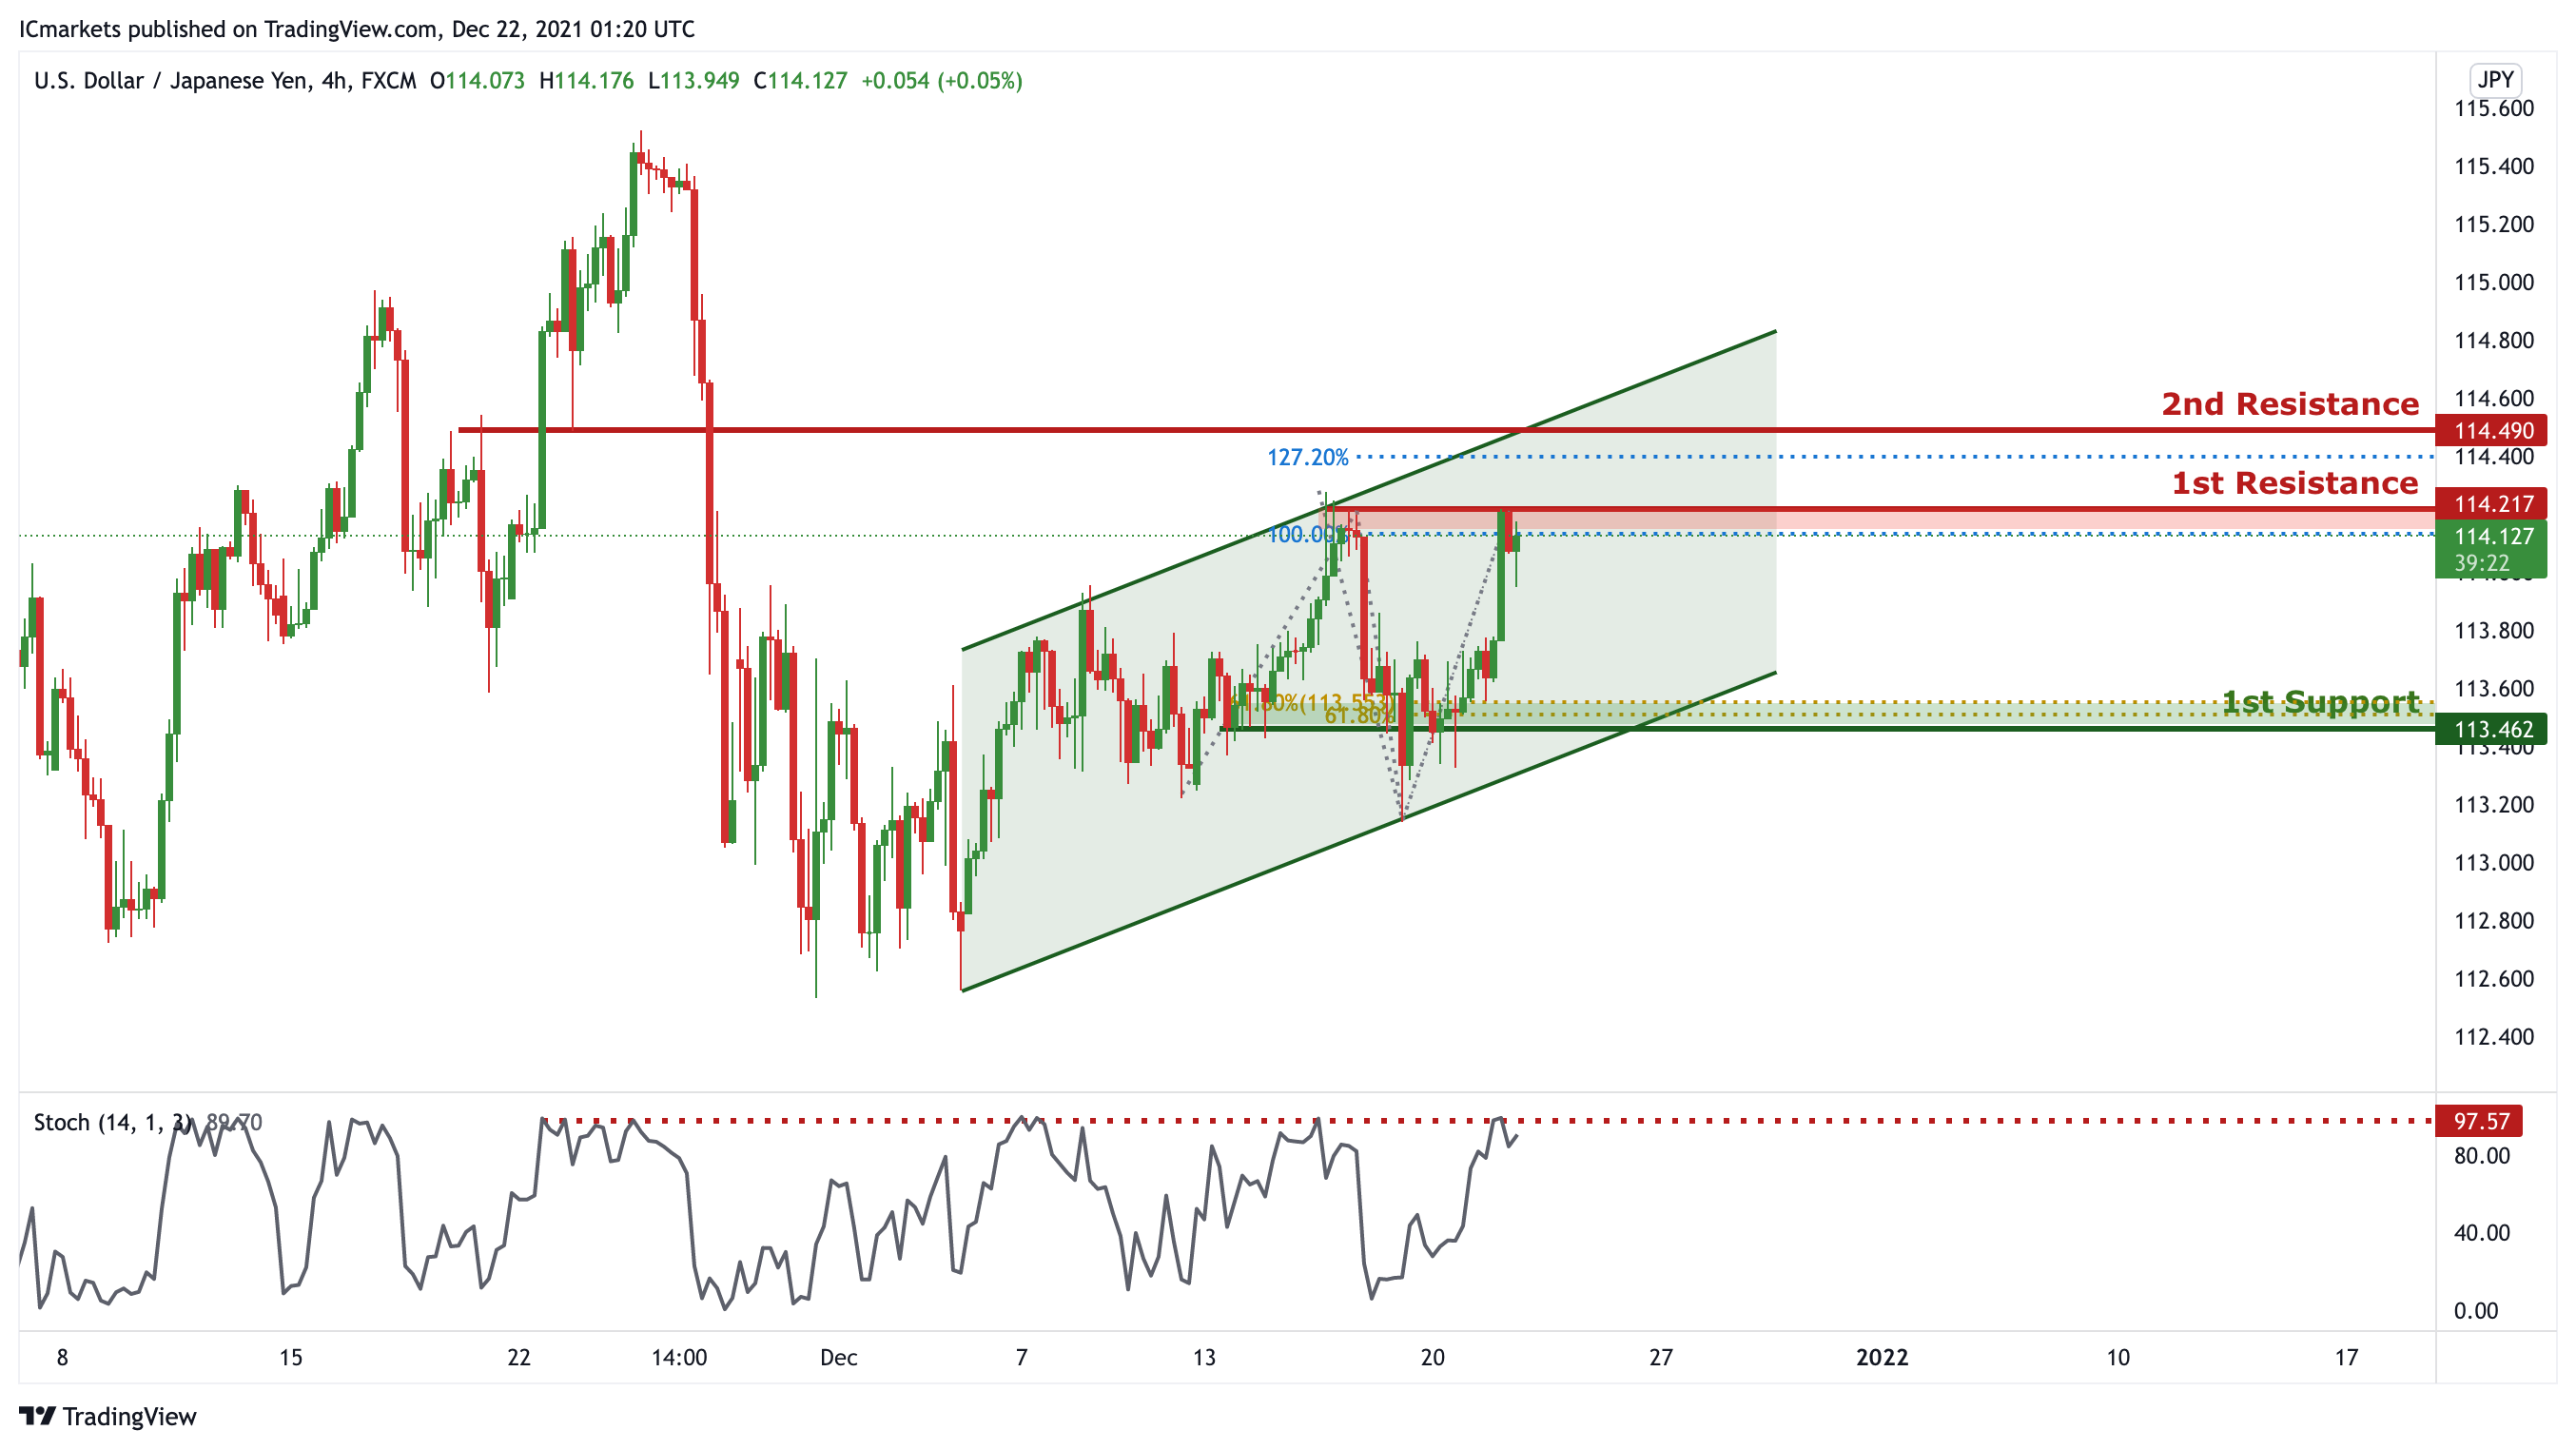
USD/JPY
On the H4 timeframe, price is abiding to the ascending channel, showing an overall bullish momentum. However, we can expect a short term bearish momentum from 1st resistance , in line with previous high and 100% Fibonacci projection and drop towards 1st Support in line with horizontal support, 61.8% Fibonacci projection and 61.8% Fibonacci retracement. Our bearish bias is further supported by stochastic where the %K line dropped from the resistance.
Areas of consideration:
- H4 1st resistance level 114.217
- H4 1st support level 113.462
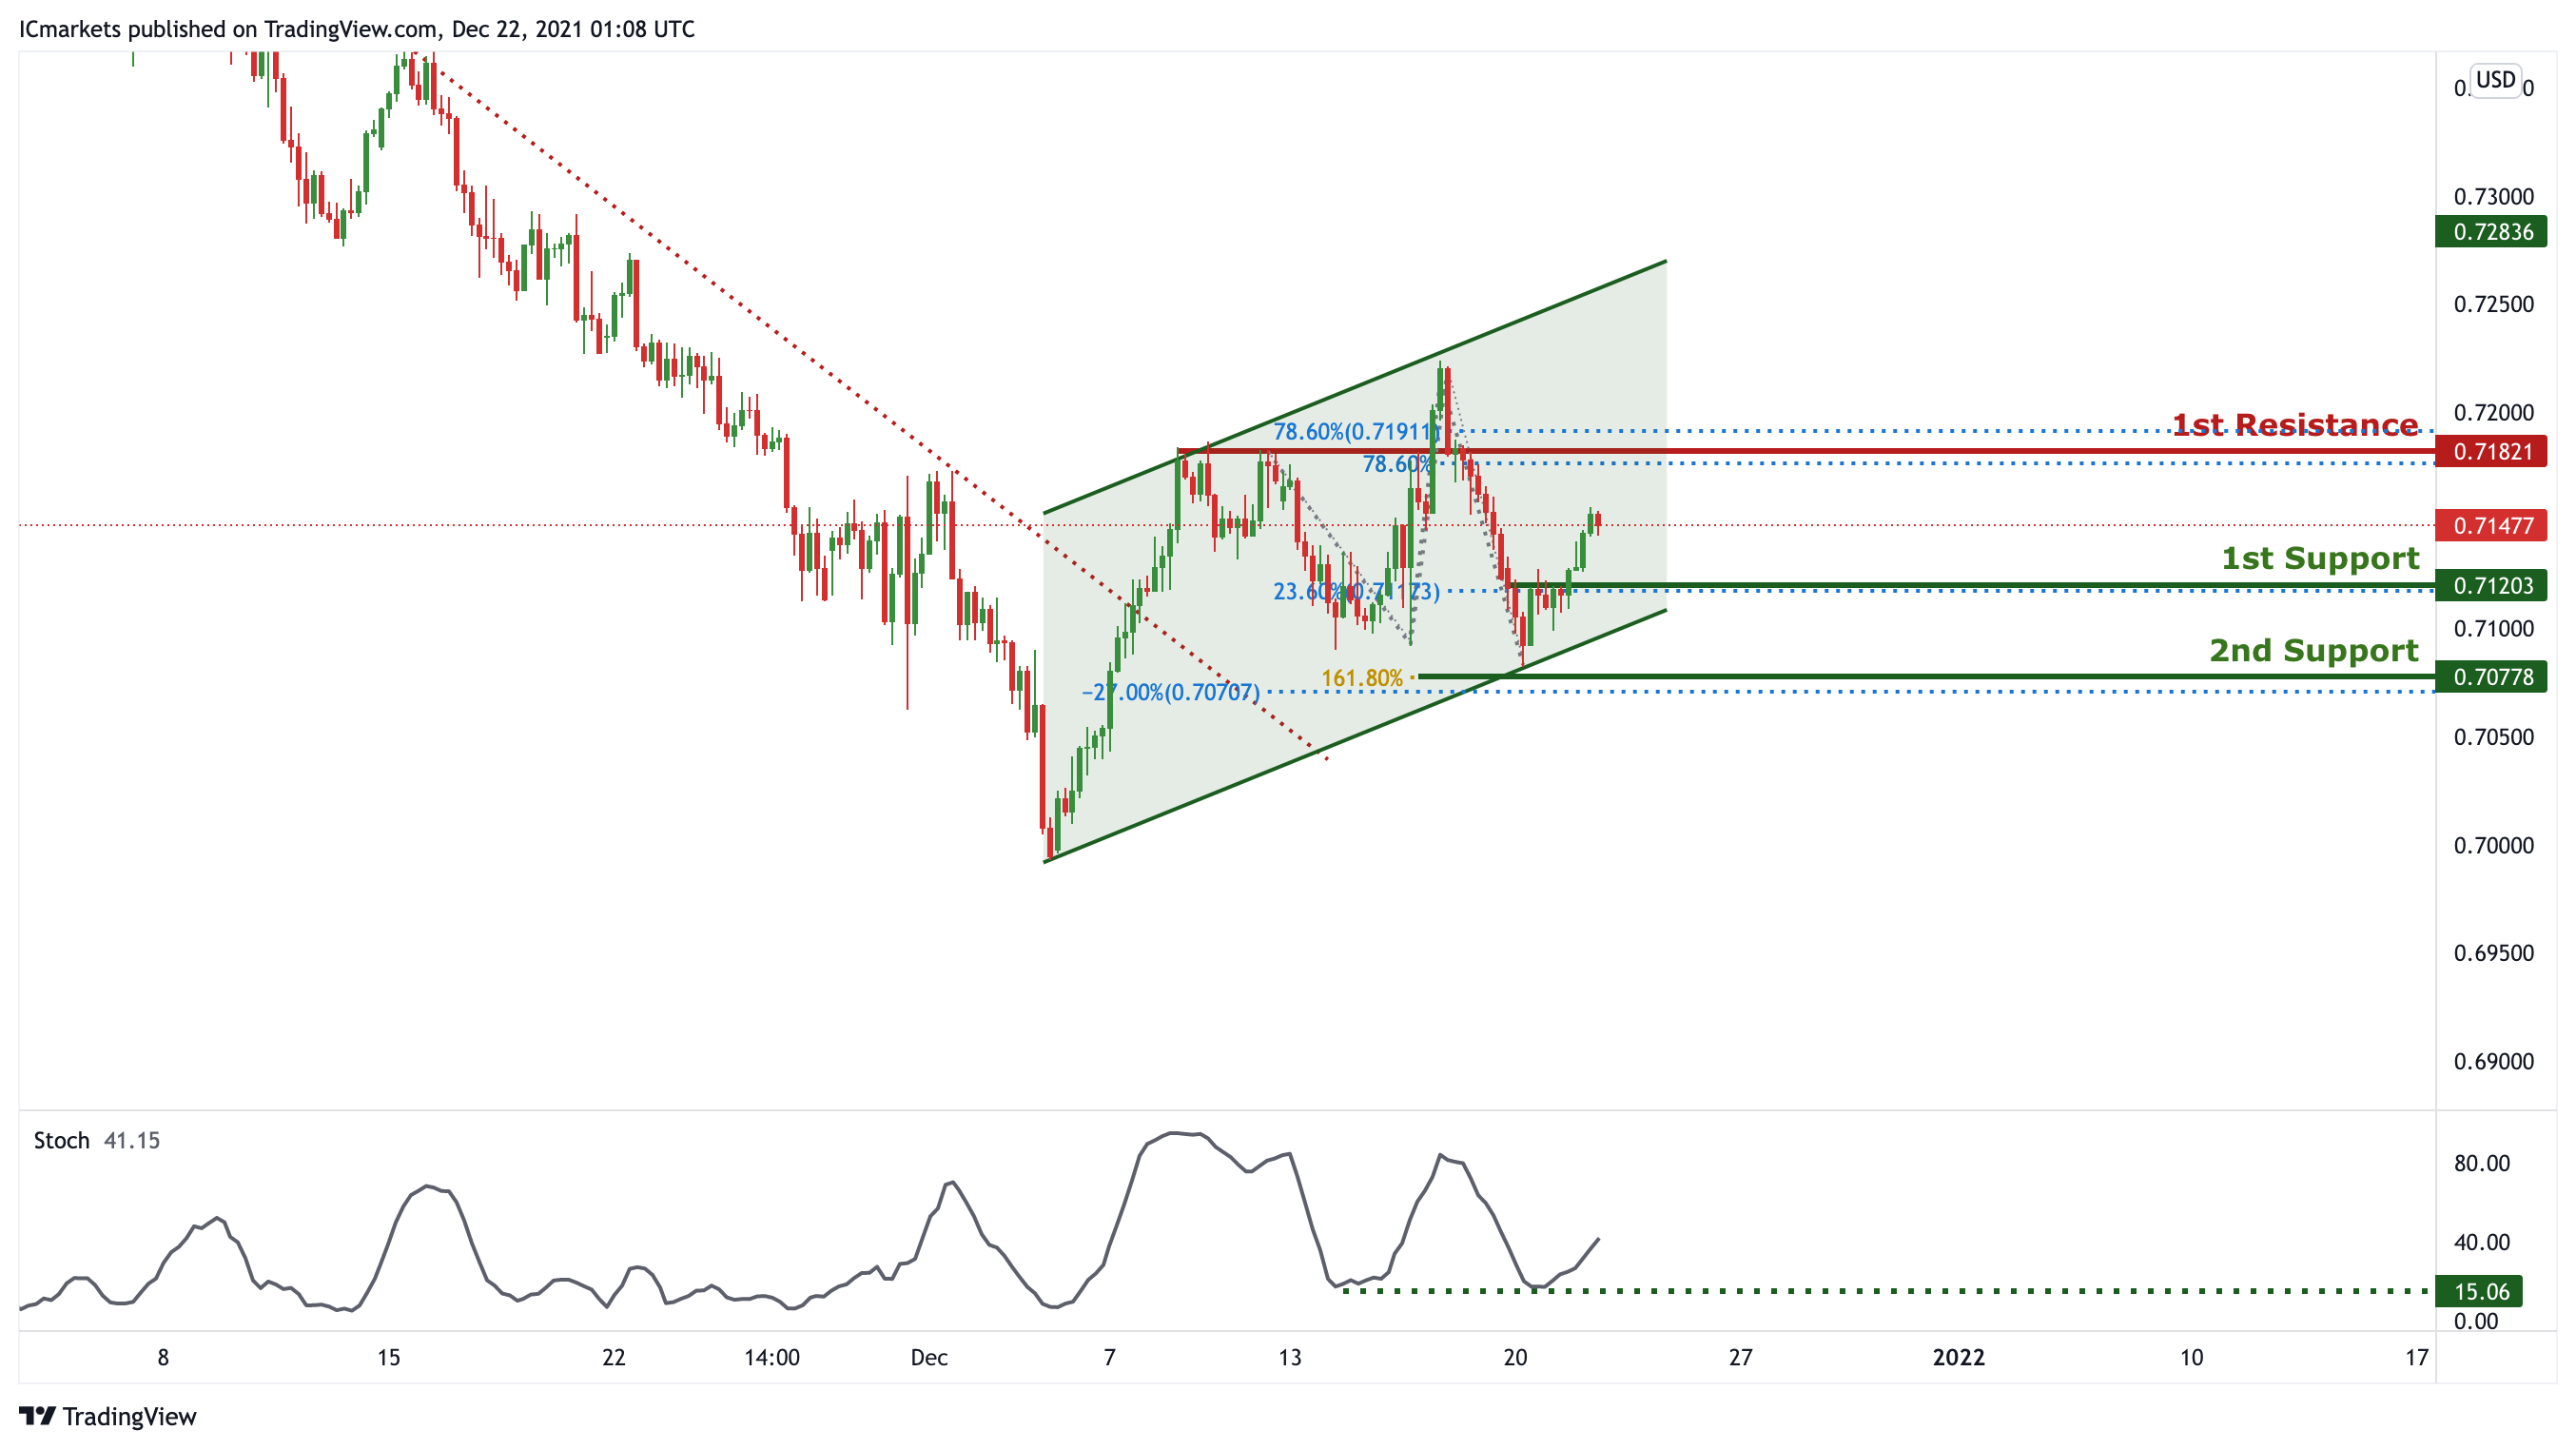
AUD/USD:
On the H4, price has broken out of the descending trendline resistance and reacting in an ascending channel, signifying bullish momentum. We can expect price to bounce from 1st Support in line with 23.6% Fibonacci retracement towards 1st Resistance in line with 78.6% Fibonacci projection and 78.6% Fibonacci retracement. Our bullish bias is further supported by the stochastic indicator where the %K line bounced off at the support level.
Areas of consideration:
- H4 1st Support level 0.71203
- H4 1st resistance level 0.71821
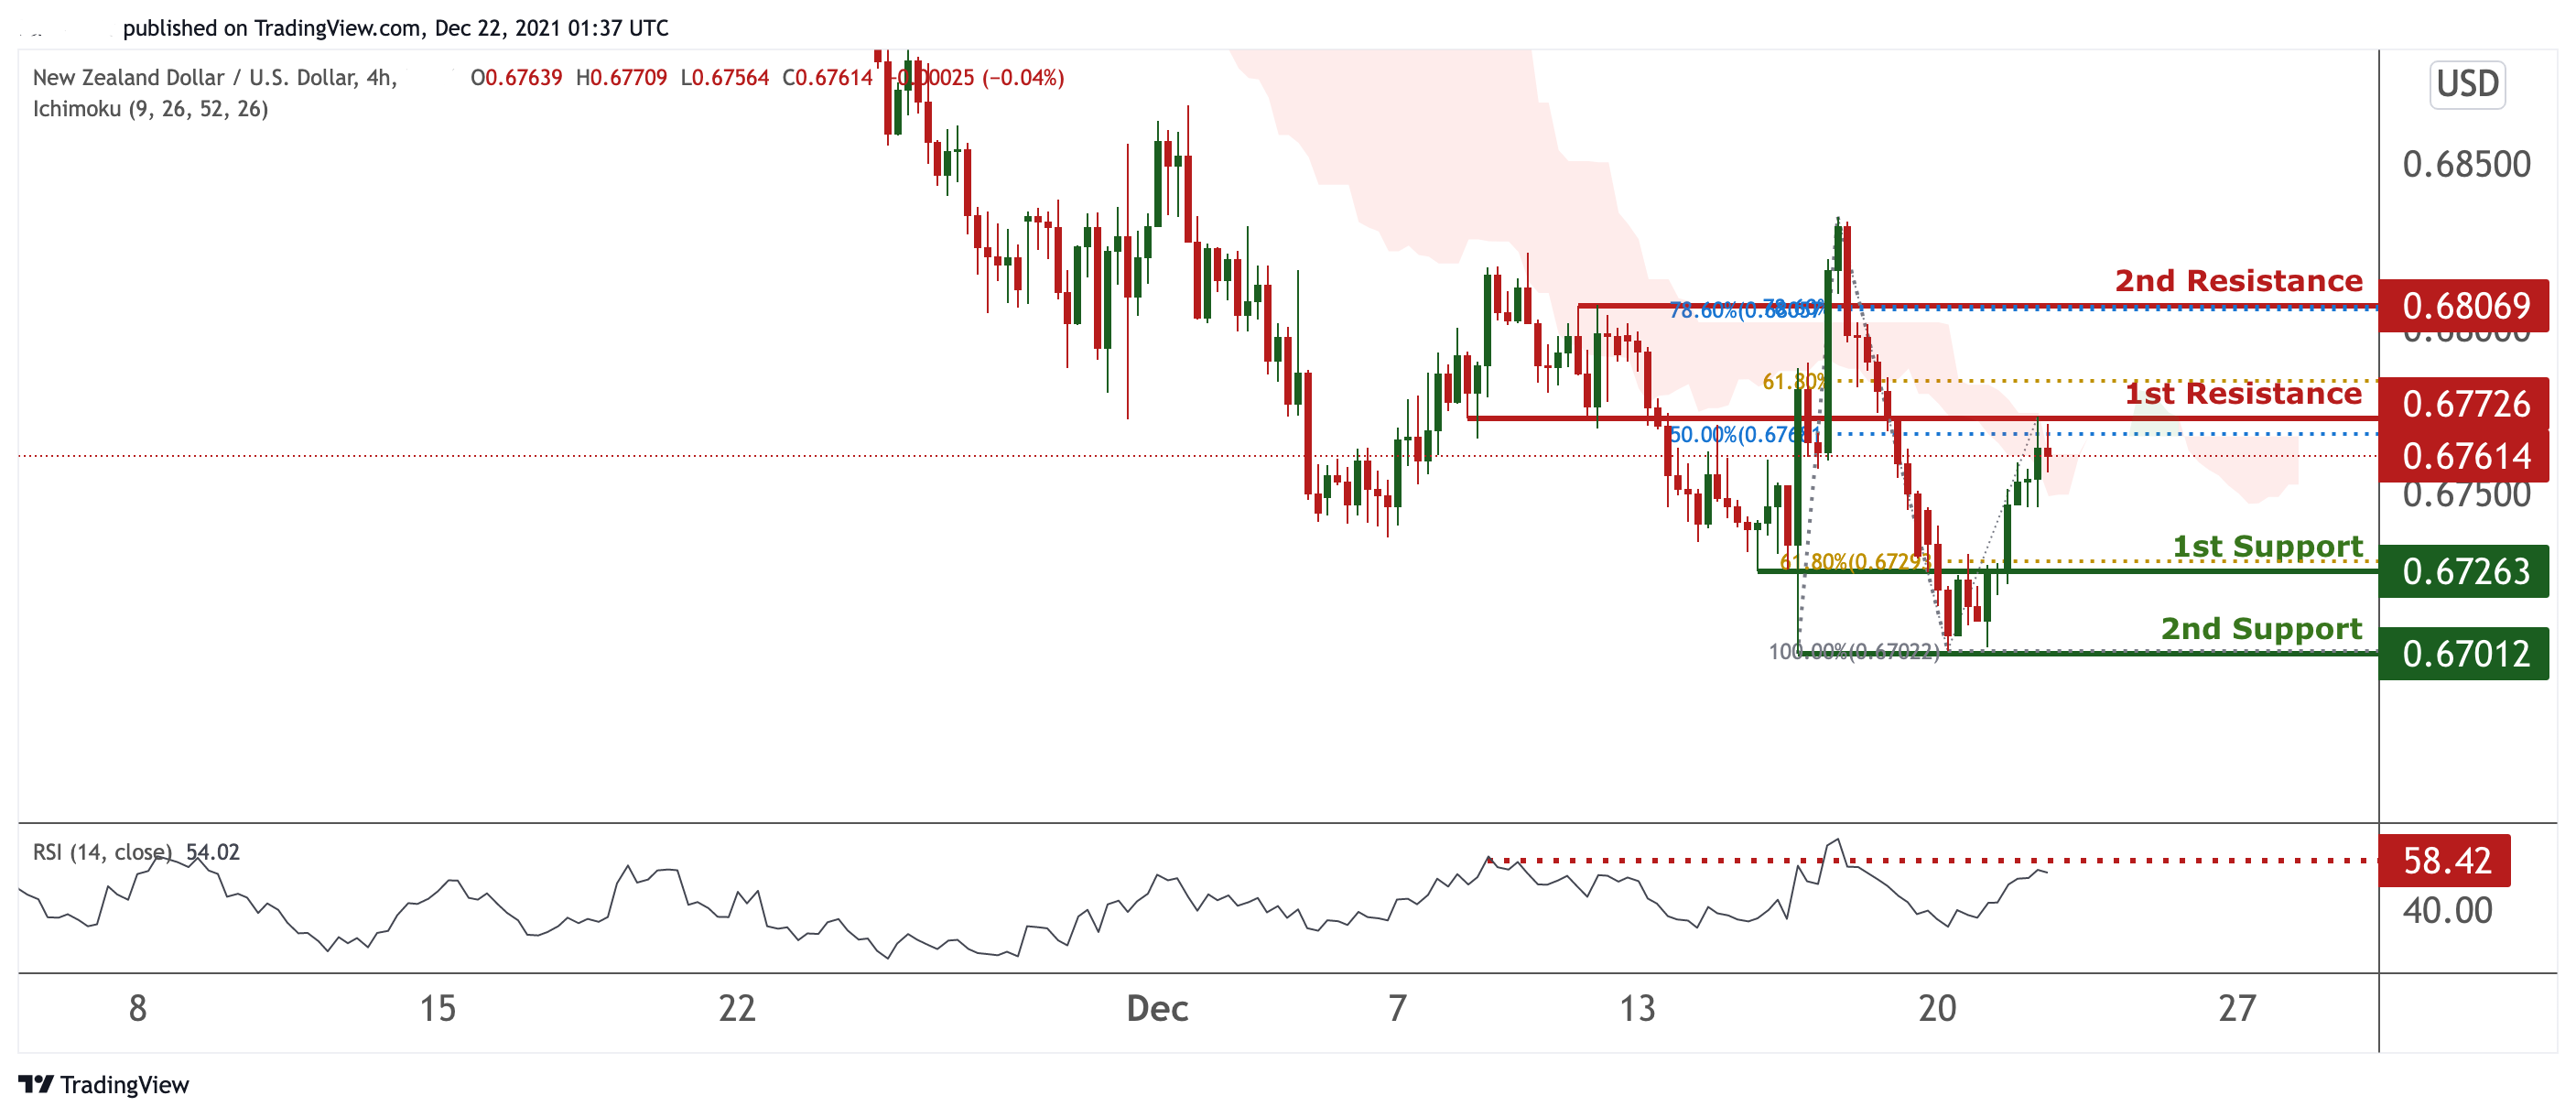
NZD/USD:
On the H4, prices are on a bearish momentum. With RSI at a level where dips previously occurred, we see a potential dip from our 1st resistance at 0.67726 in line with 50% Fibonacci retracement and 61.8% Fibonacci extension towards our 1st support at 0.67263 in line with 61.8% Fibonacci extension. Prices are also facing resistance within the Ichimoku Clouds, supporting our bearish bias. Alternatively, breaking our 1st resistance may find prices climbing higher towards our 2nd resistance at 0.68069 in line with 78.6% Fibonacci retracement and 78.6% Fibonacci extension.
Areas of consideration:
- H4 time frame, 1st resistance at 0.67726
- H4 time frame, 1st support at 0.67263
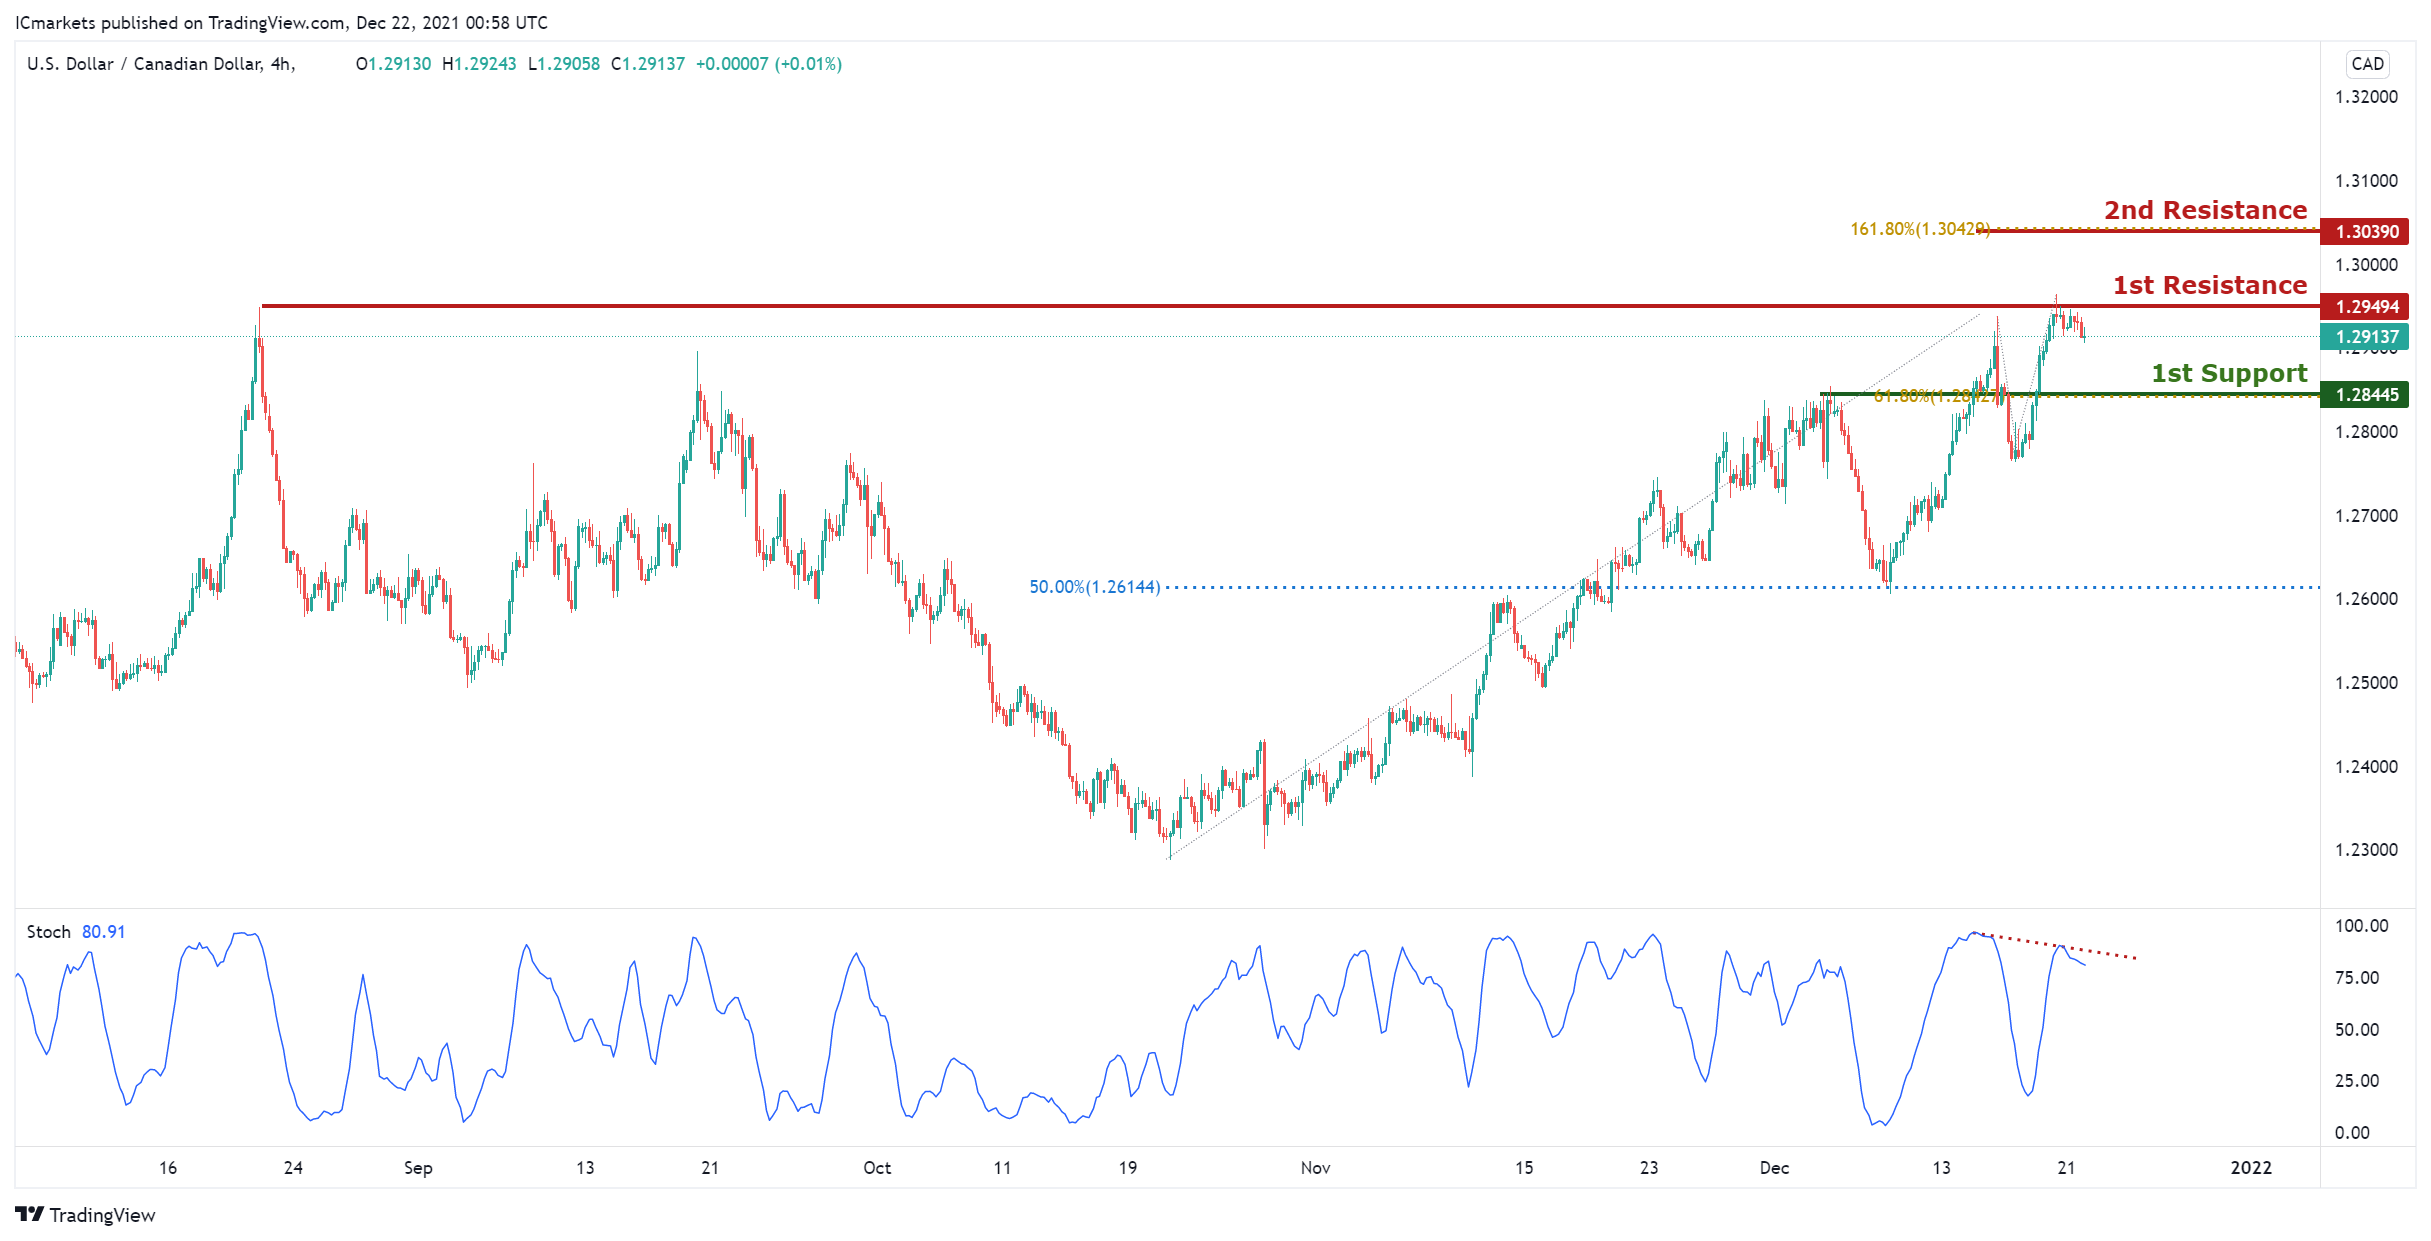
USD/CAD:
On the H4 timeframe,with price approaching the resistance of the stochastics indicator, we have a bearish bias that price will drop from 1st resistance at 1.29494 in line with the graphical swing high resistance to 1st support at 1.28445 in line with the horizontal swing low support and 61.8% Fibonacci retracement. Alternatively, price may break 1st resistance structure and head for 2nd resistance at 1.30390 in line with the 161.8% Fibonacci retracement and horizontal swing high resistance.
Areas of consideration:
- H4 time frame, support at 1.28445
- H4 time frame, resistance at 1. 2844
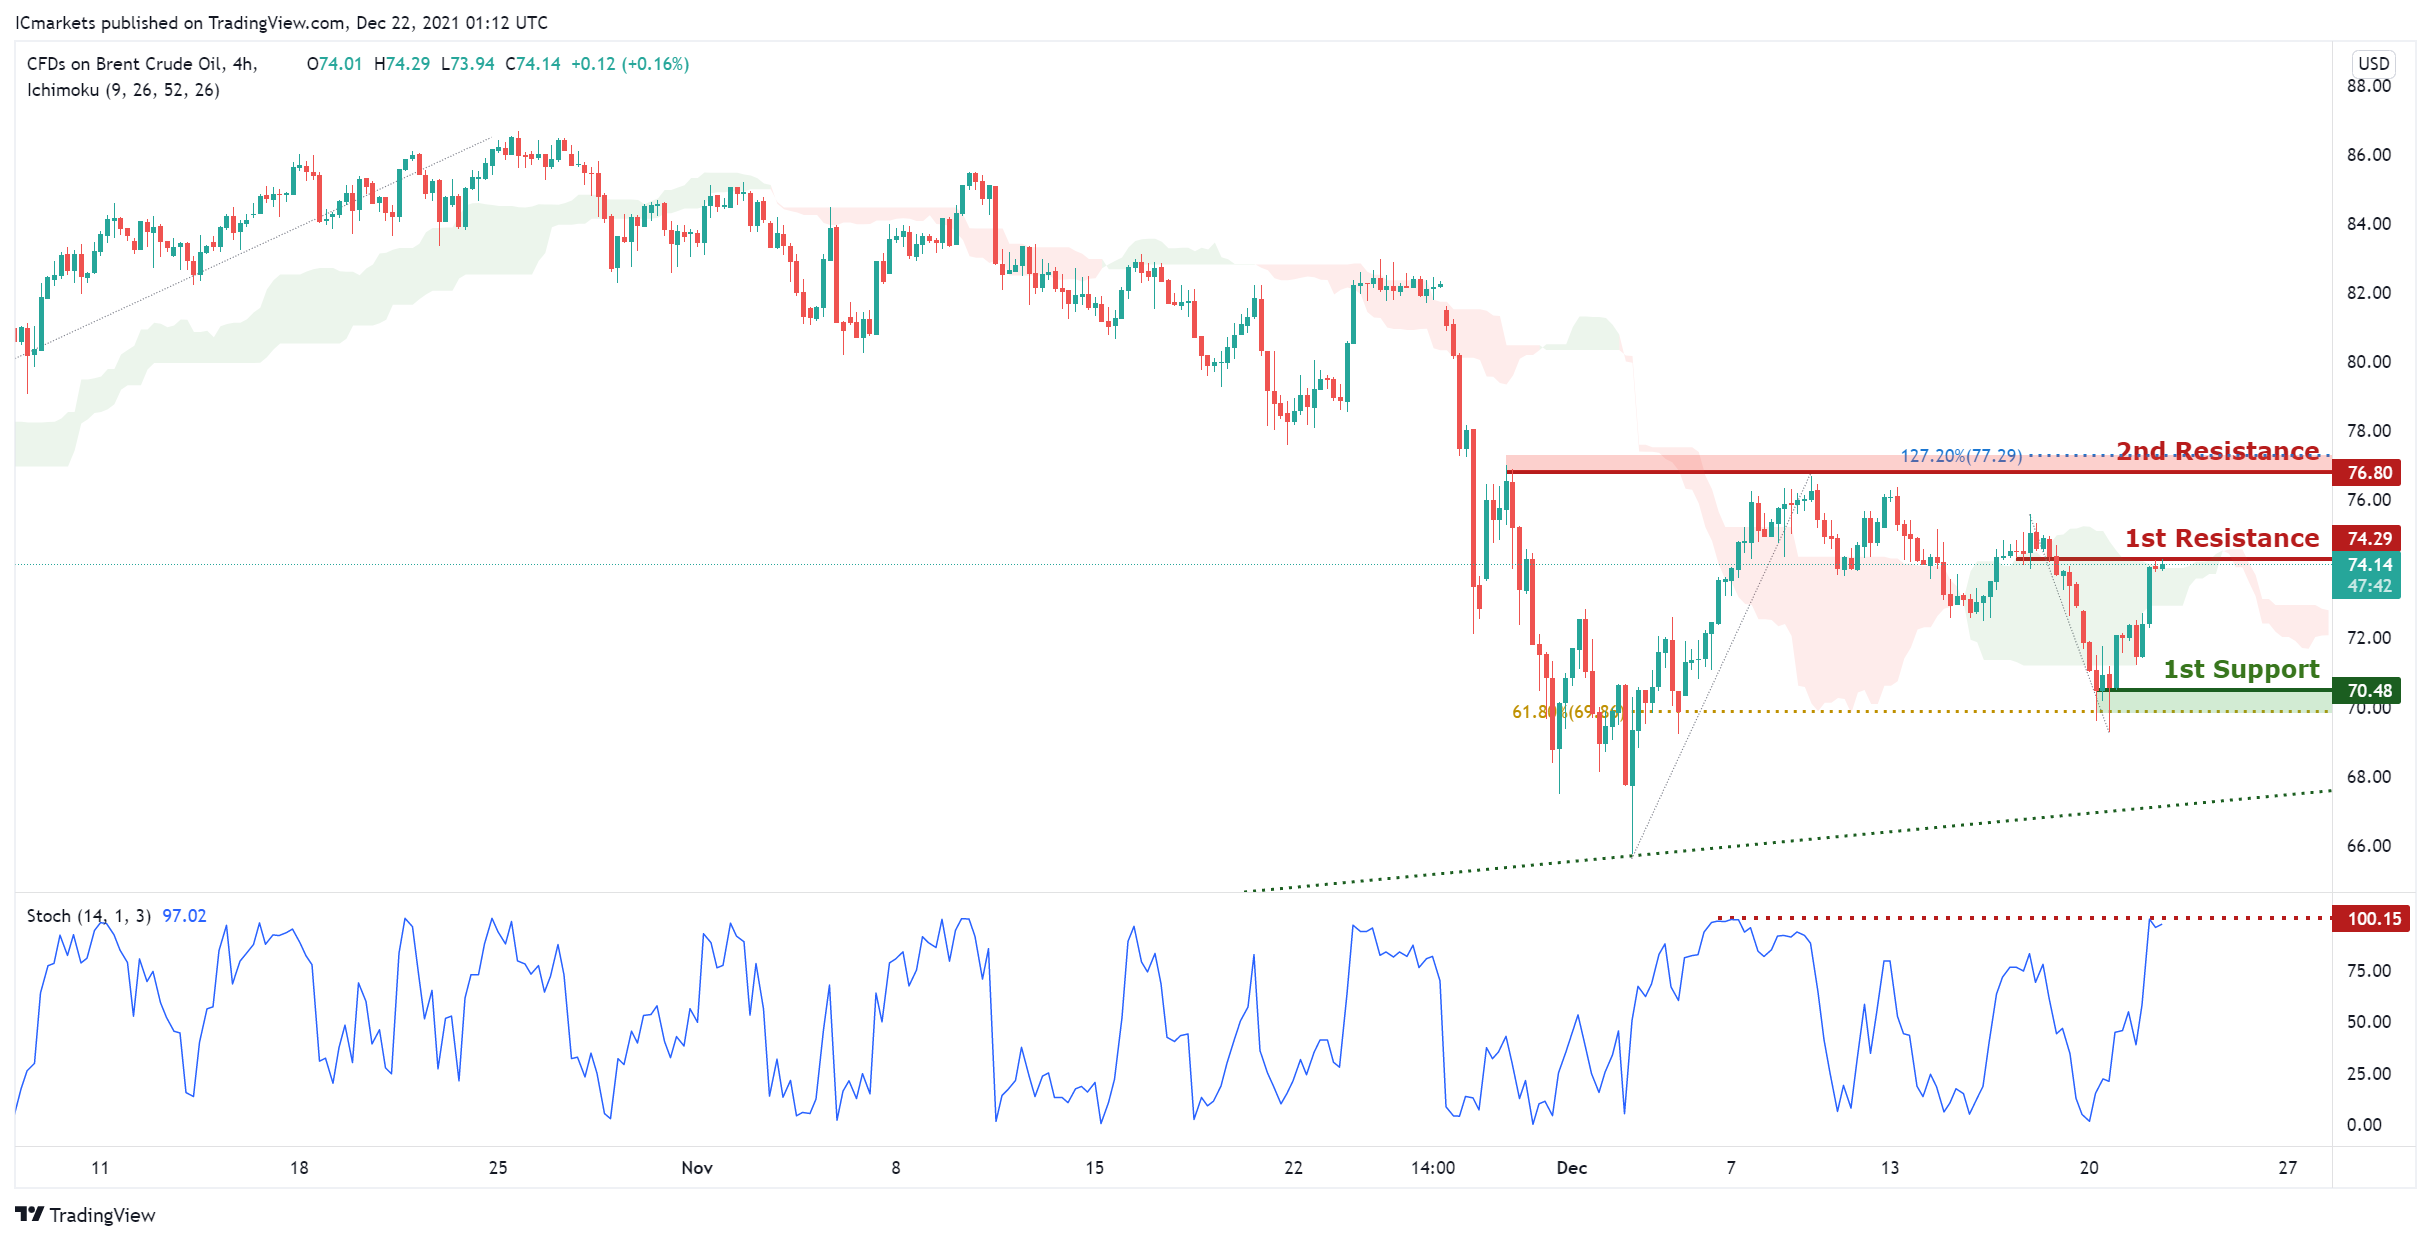
OIL:
On the H4 timeframe, with price approaching the resistance of the ichimoku cloud and the stochastics indicator, we have a bearish bias that price will fall from 1st resistance at 74.29 in line with the graphical swing overlap resistance to 1st support at 70.48 in line with the 61.8% Fibonacci retracement and graphical swing low support. Alternatively, we may see price break 1st resistance and head for 2nd resistance at 76.58 in line with the horizontal swing high resistance and 127.2% Fibonacci extension level.
Areas of consideration:
- H4 time frame, 1st resistance of 29
- H4 time frame, 1st support of 48
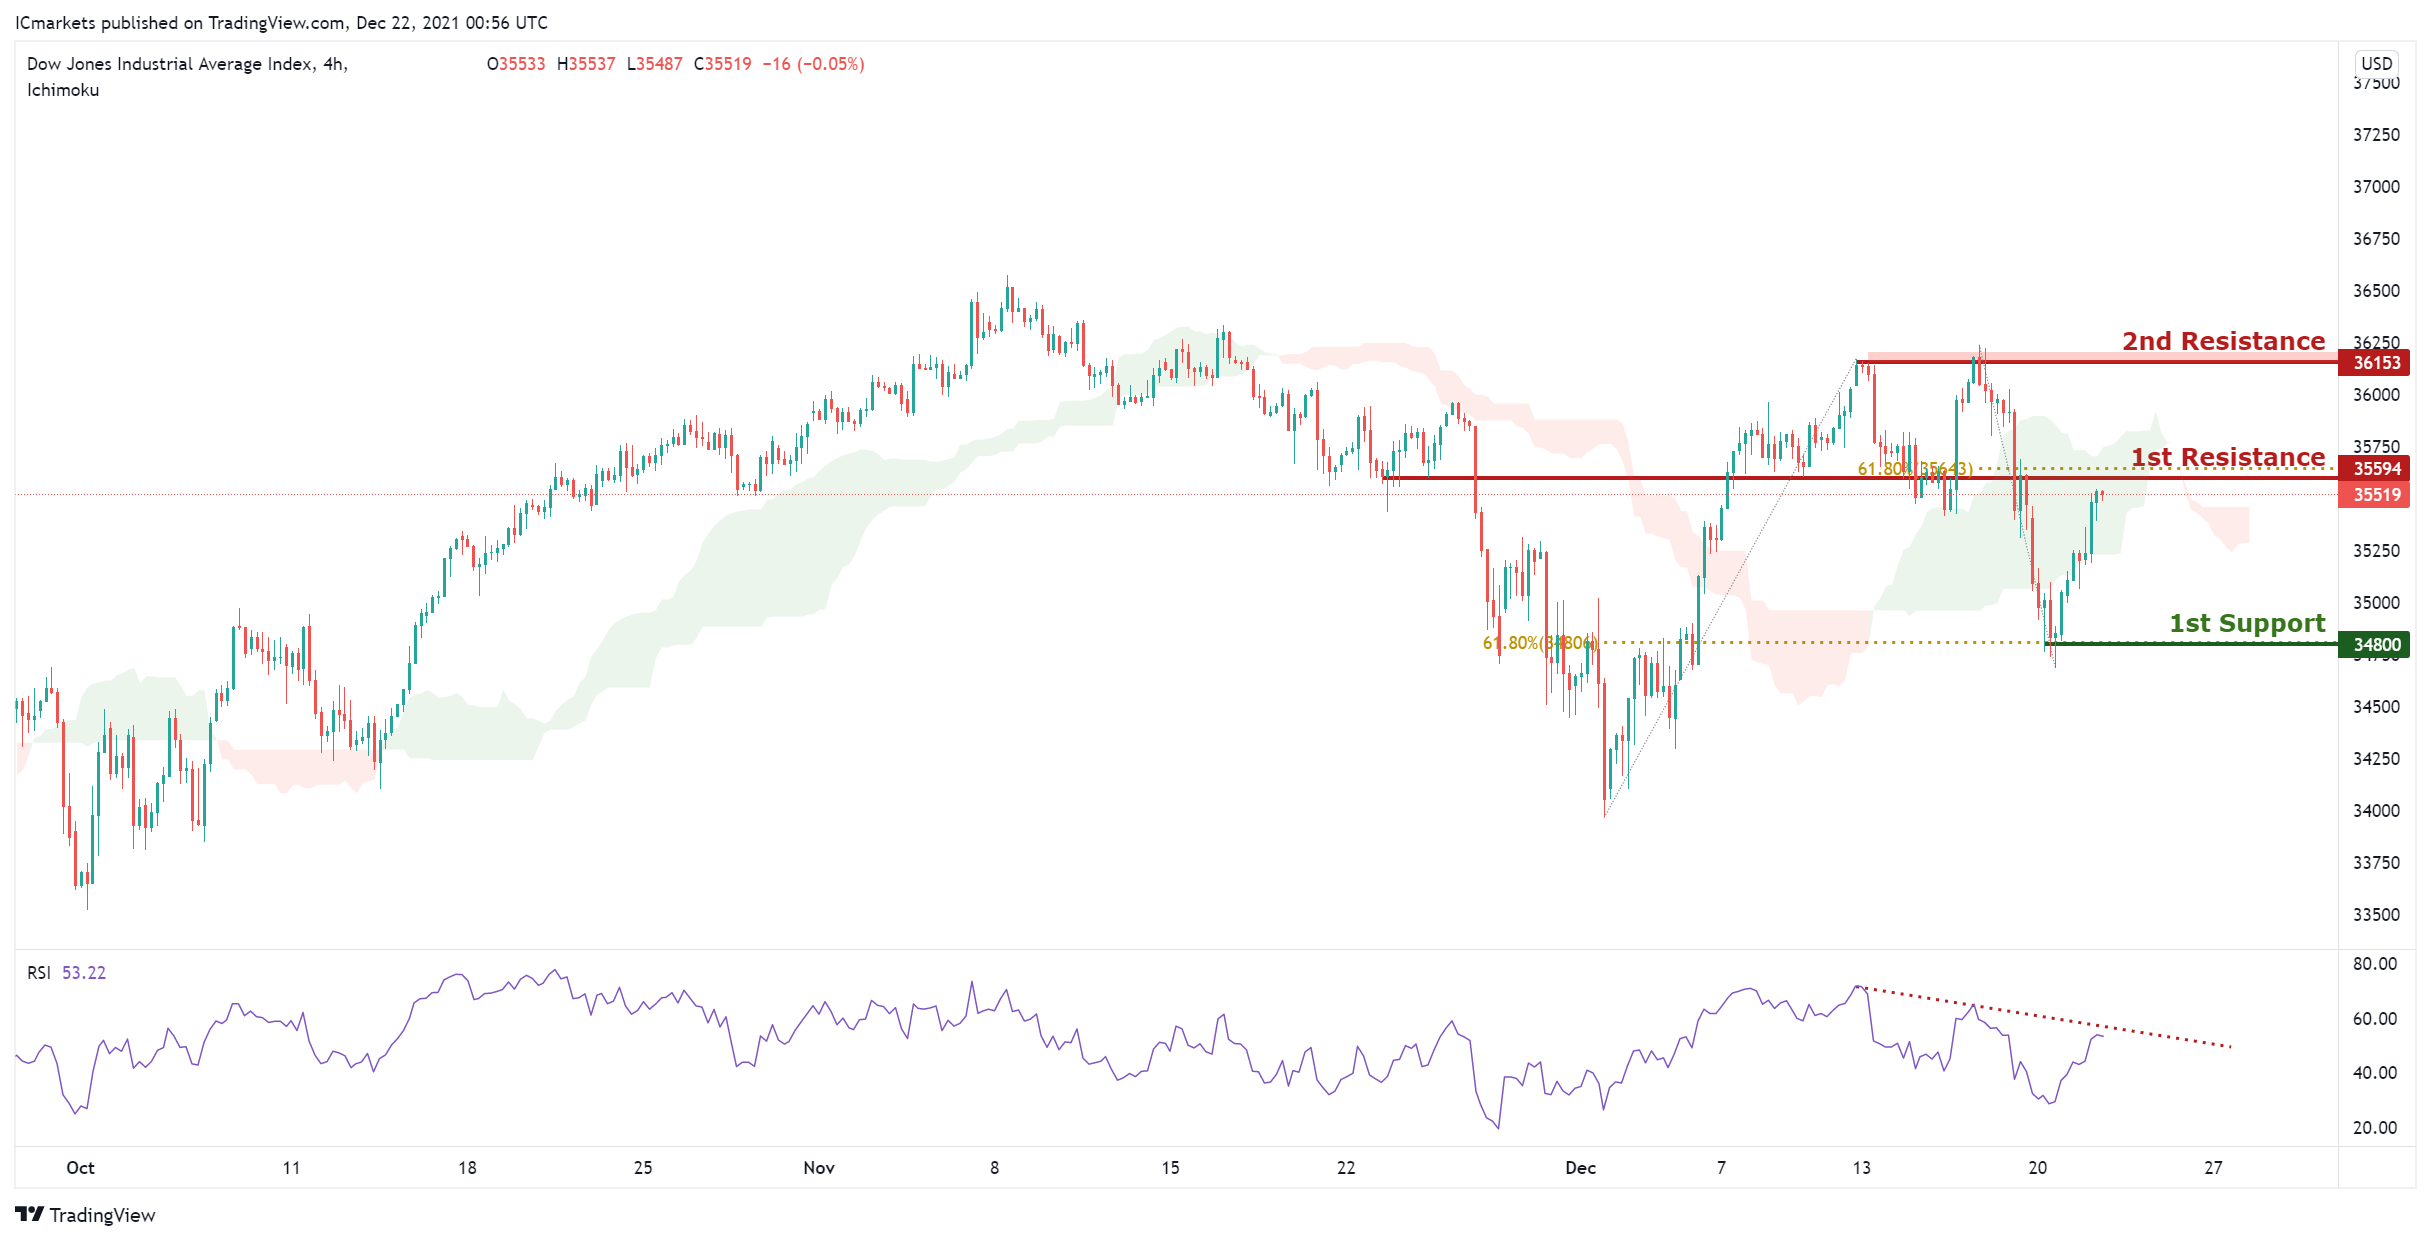
Dow Jones Industrial Average:
On the H4 timeframe, with price approaching the resistance within the ichimoku cloud and the stochastics indicator, we have a bearish bias that price will fall from 1st resistance at 35594 in line with the graphical swing overlap resistance and 61.8% Fibonacci retracement to 1st support at 34800 in line with the 61.8% Fibonacci retracement and graphical swing low support. Alternatively, we may see price break 1st resistance and head for 2nd resistance at 36153 in line with the horizontal swing high resistance.
Area of consideration:
- 4H resistance at 35594
- 4H support at 34800
The accuracy, completeness and timeliness of the information contained on this site cannot be guaranteed. IC Markets does not warranty, guarantee or make any representations, or assume any liability regarding financial results based on the use of the information in the site.
News, views, opinions, recommendations and other information obtained from sources outside of www.icmarkets.com.au, used in this site are believed to be reliable, but we cannot guarantee their accuracy or completeness. All such information is subject to change at any time without notice. IC Markets assumes no responsibility for the content of any linked site.
The fact that such links may exist does not indicate approval or endorsement of any material contained on any linked site. IC Markets is not liable for any harm caused by the transmission, through accessing the services or information on this site, of a computer virus, or other computer code or programming device that might be used to access, delete, damage, disable, disrupt or otherwise impede in any manner, the operation of the site or of any user’s software, hardware, data or property.


