Key risk events today:
ECB President Lagarde Speaks; US CPI m/m; US Core CPI m/m.
(Previous analysis as well as outside sources – italics).
EUR/USD:
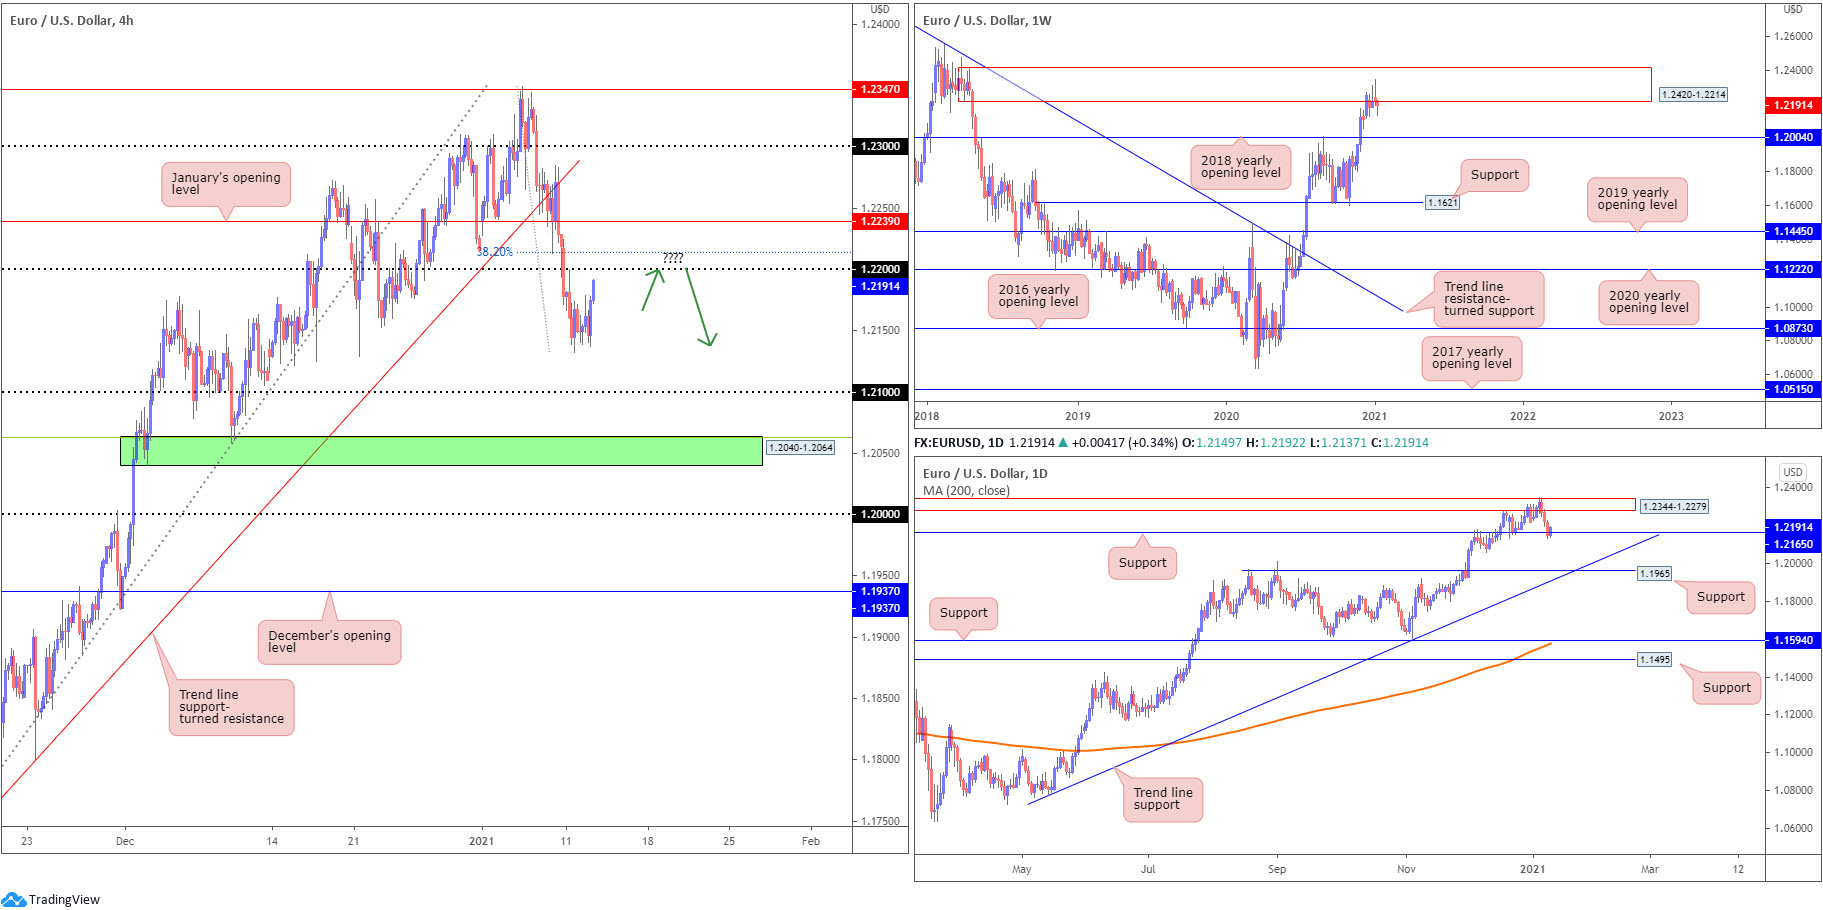
The US dollar index snapping a three-day bullish phase prompted a modest euro bid Tuesday, reclaiming space above 1.2150. As evident from the H4 space, price action is on track to retest the underside of the 1.22 figure, fixed just south of a 38.2% Fibonacci retracement ratio at 1.2213 and January’s opening value from 1.2239.
From the weekly timeframe, limited change has been observed. Therefore, here’s a reminder of where we left things in Tuesday’s briefing (italics):
Weekly supply at 1.2420-1.2214 remains central focus, with last week establishing a shooting star pattern off multi-month peaks at 1.2349. Should sellers take the reins, the 2018 yearly opening value at 1.2004 is likely a level downside movement may target. In terms of trend, however, upside remains favoured – more so if price overthrows the 1.2555 February 12 high (2018). The above implies buyers could take the wheel and eventually attempt to overthrow the aforementioned supply zone.
Technical structure on the daily timeframe is seen shaking hands with support priced in at 1.2165, following a dominant rejection from supply at 1.2344-1.2279 (nestled within the walls of weekly supply mentioned above at 1.2420-1.2214). A break of support not only lays the basis for further selling to another support at 1.1965 (and trend line support, taken from the low 1.0774), a bearish move would also add conviction to the weekly timeframe’s supply.
Areas of consideration:
- Longer term, although the trend has faced an upward trajectory since early 2020, weekly price displays signs of weakness within supply at 1.2420-1.2214.
- A retest at 1.22/1.2213 (H4) could prove interesting for sellers today, particularly for those looking to secure an entry from weekly supply, targeting 1.21 (H4). However, this would entail going up against daily support at 1.2165.
GBP/USD:
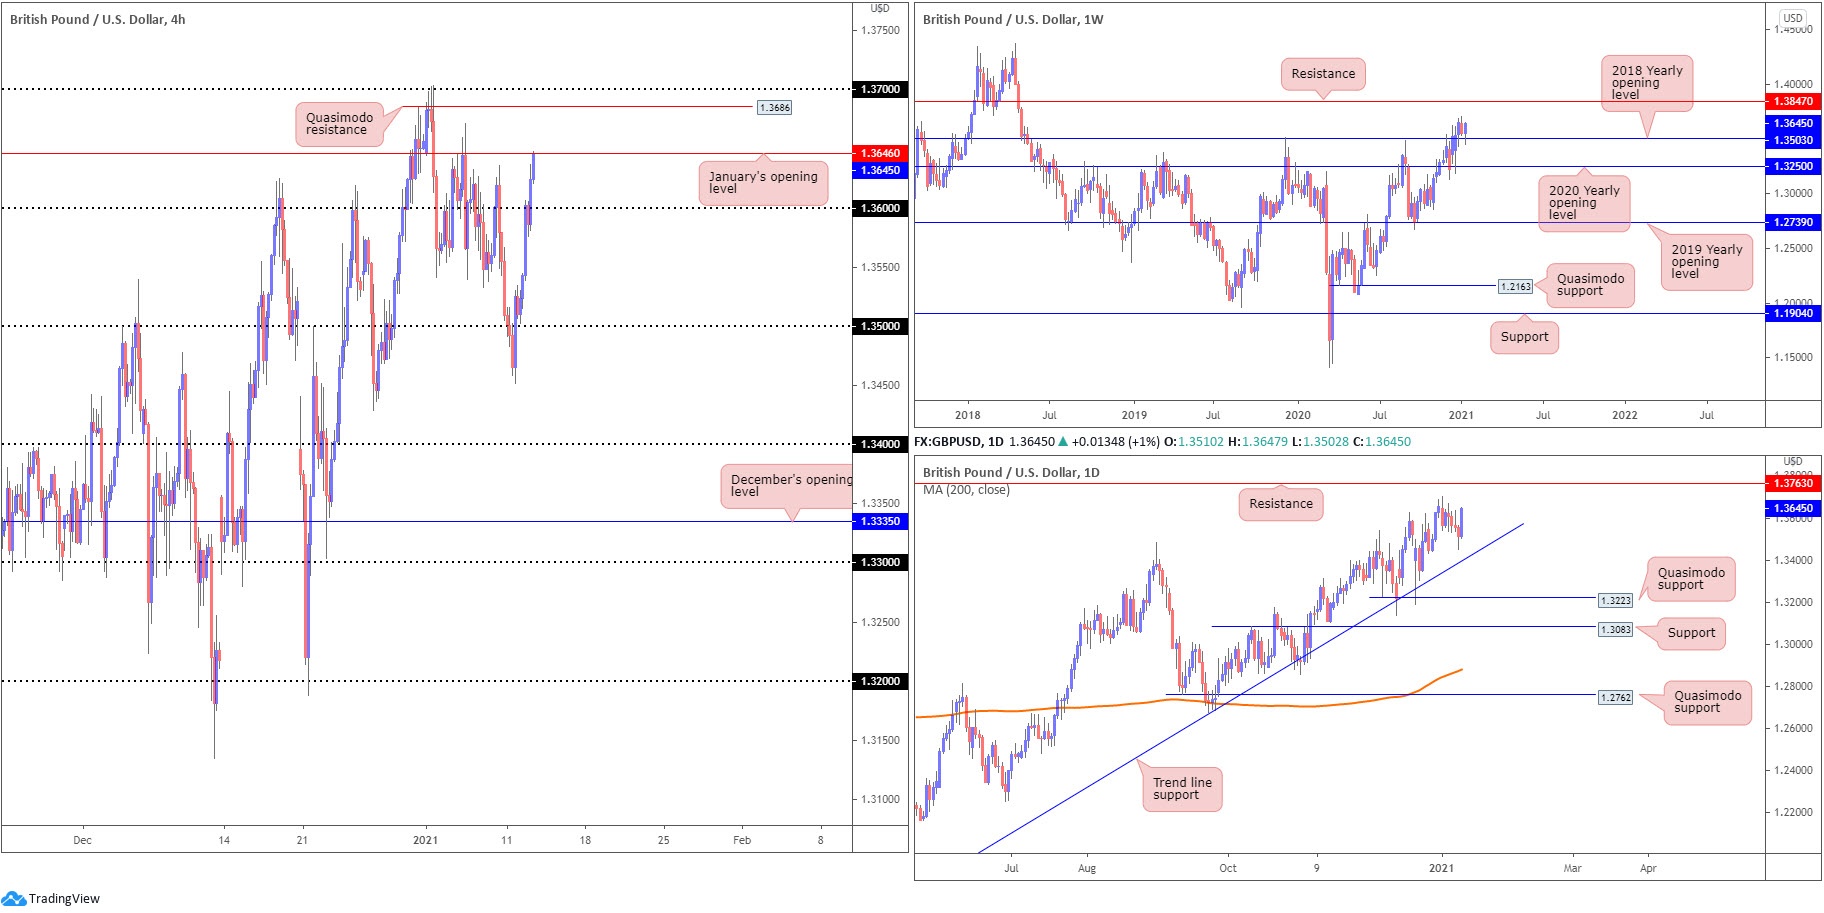
Sterling convincingly reclaimed the 1.36 figure against the US dollar on Tuesday following another roll back against NIRP from BoE’s Governor Bailey. H4, as you can see, has since gripped the underside of January’s opening value at 1.3646, with a break of here to perhaps pursue Quasimodo resistance at 1.3686 and the 1.37 figure.
Recent buying was expected, according to the weekly timeframe – traders will see GBP/USD crossed swords with the 2018 yearly opening value at 1.3503 on Monday. To the upside, resistance at 1.3847 is on the radar. Also of technical interest is a recent engulf of 1.3514 (December 9 [2019] high), helping to confirm the current uptrend in play since early 2020.
The technical landscape on the daily timeframe shows price moulded a bullish pivot swing point (green arrow) on Tuesday, north of trend line support, etched from the low 1.1409. To the upside, resistance, aside from the 1.3703 January 4 high, can be seen at 1.3763.
Areas of consideration:
- Weekly support at 1.3503 making an appearance, in a market that’s been trending since the early months of 2020, along with daily price forming a bullish pivot point, could fuel buyers to take on January’s opening value at 1.3646 (H4) to reach the 1.37ish neighbourhood.
AUD/USD:
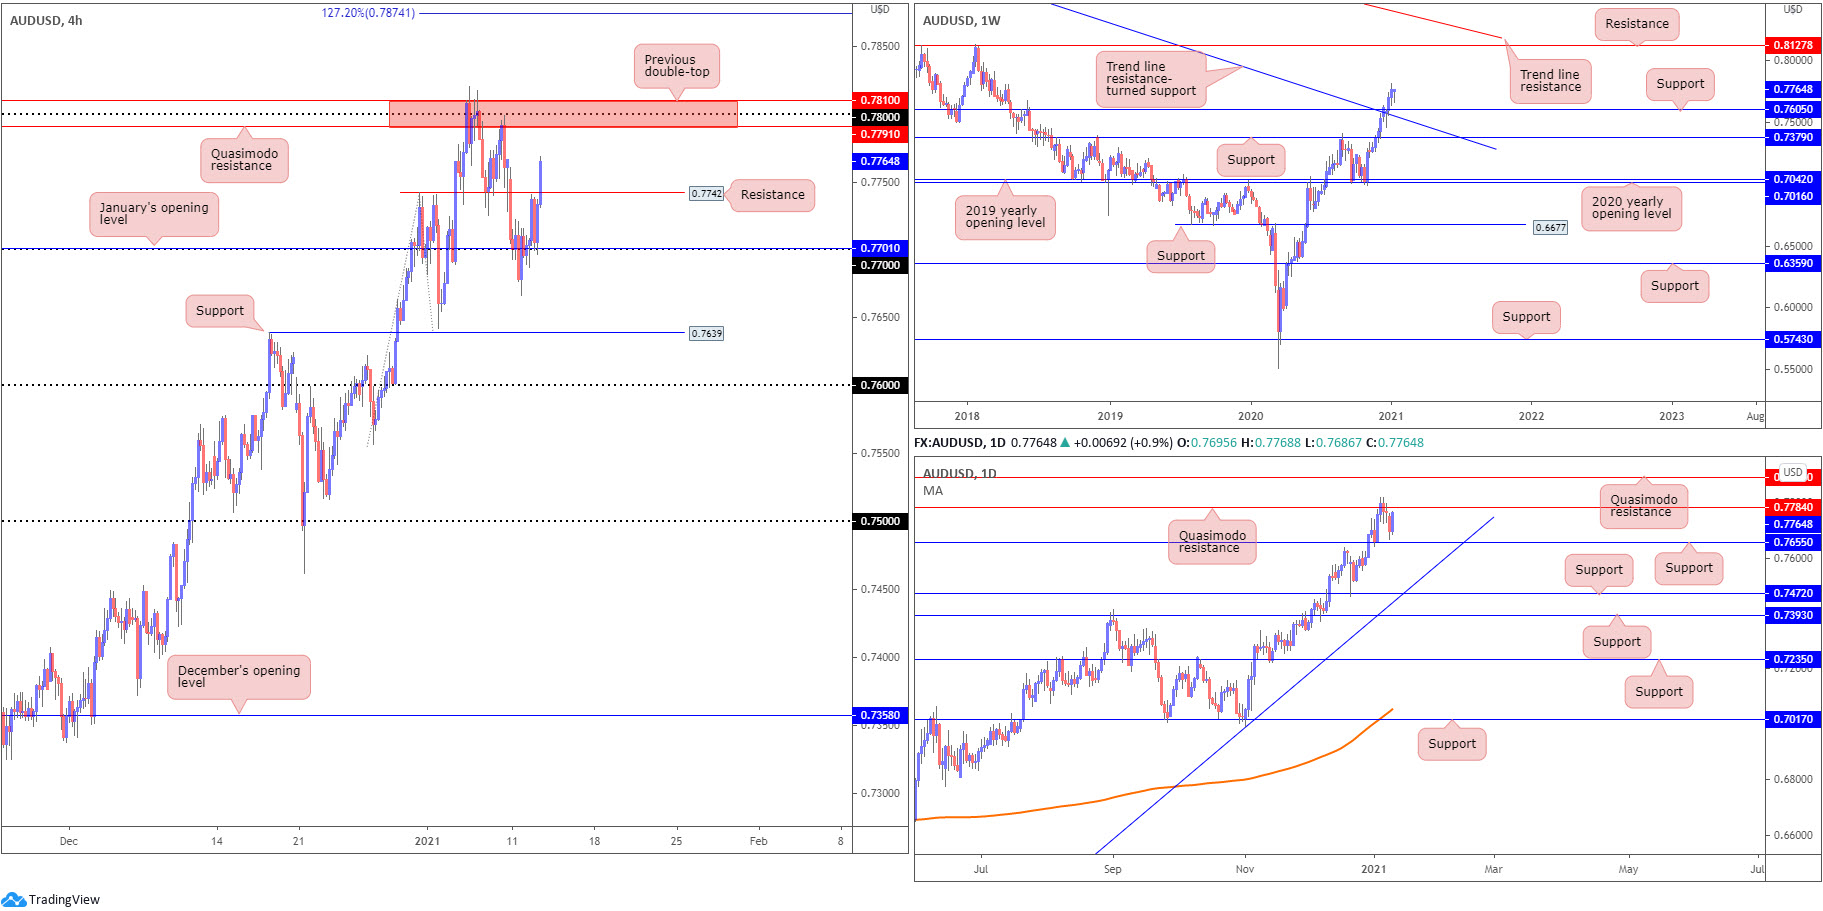
Modestly upbeat risk sentiment, on top of Tuesday’s broadly softer dollar, recently elevated AUD/USD above H4 resistance from 0.7742, following a decisive retest at 0.77 and January’s opening value at 0.7701. The next port of resistance on the H4 scale falls in around 0.7810/0.7791 (red), an area formed from a previous double-top pattern, a Quasimodo resistance and the 0.78 figure.
Out of the weekly chart, AUD/USD is seen mildly fading 30-month highs at 0.7820, a few inches north of 0.7605, a previous Quasimodo resistance (now acting support) that merges closely with trend line resistance-turned support, taken from the high 1.1065. This places buyers in a strong position with room to possibly reach as far north as resistance coming in at 0.8127.
The technical position on the daily timeframe has price loitering just south of Quasimodo resistance at 0.7784. This follow’s Monday’s near-test of support at 0.7655. An advance beyond 0.7784 also shines the technical spotlight on a Quasimodo resistance at 0.7893.
Areas of consideration:
- 78 and the surrounding H4 resistances (0.7810/0.7791), on top of the daily Quasimodo resistance at 0.7784, could prove difficult for buyers, despite weekly price exhibiting scope to climb further.
- Retesting 0.7742 (a resistance-turned support) on the H4 could be in store for short-term traders today, targeting the 0.78ish space.
USD/JPY:
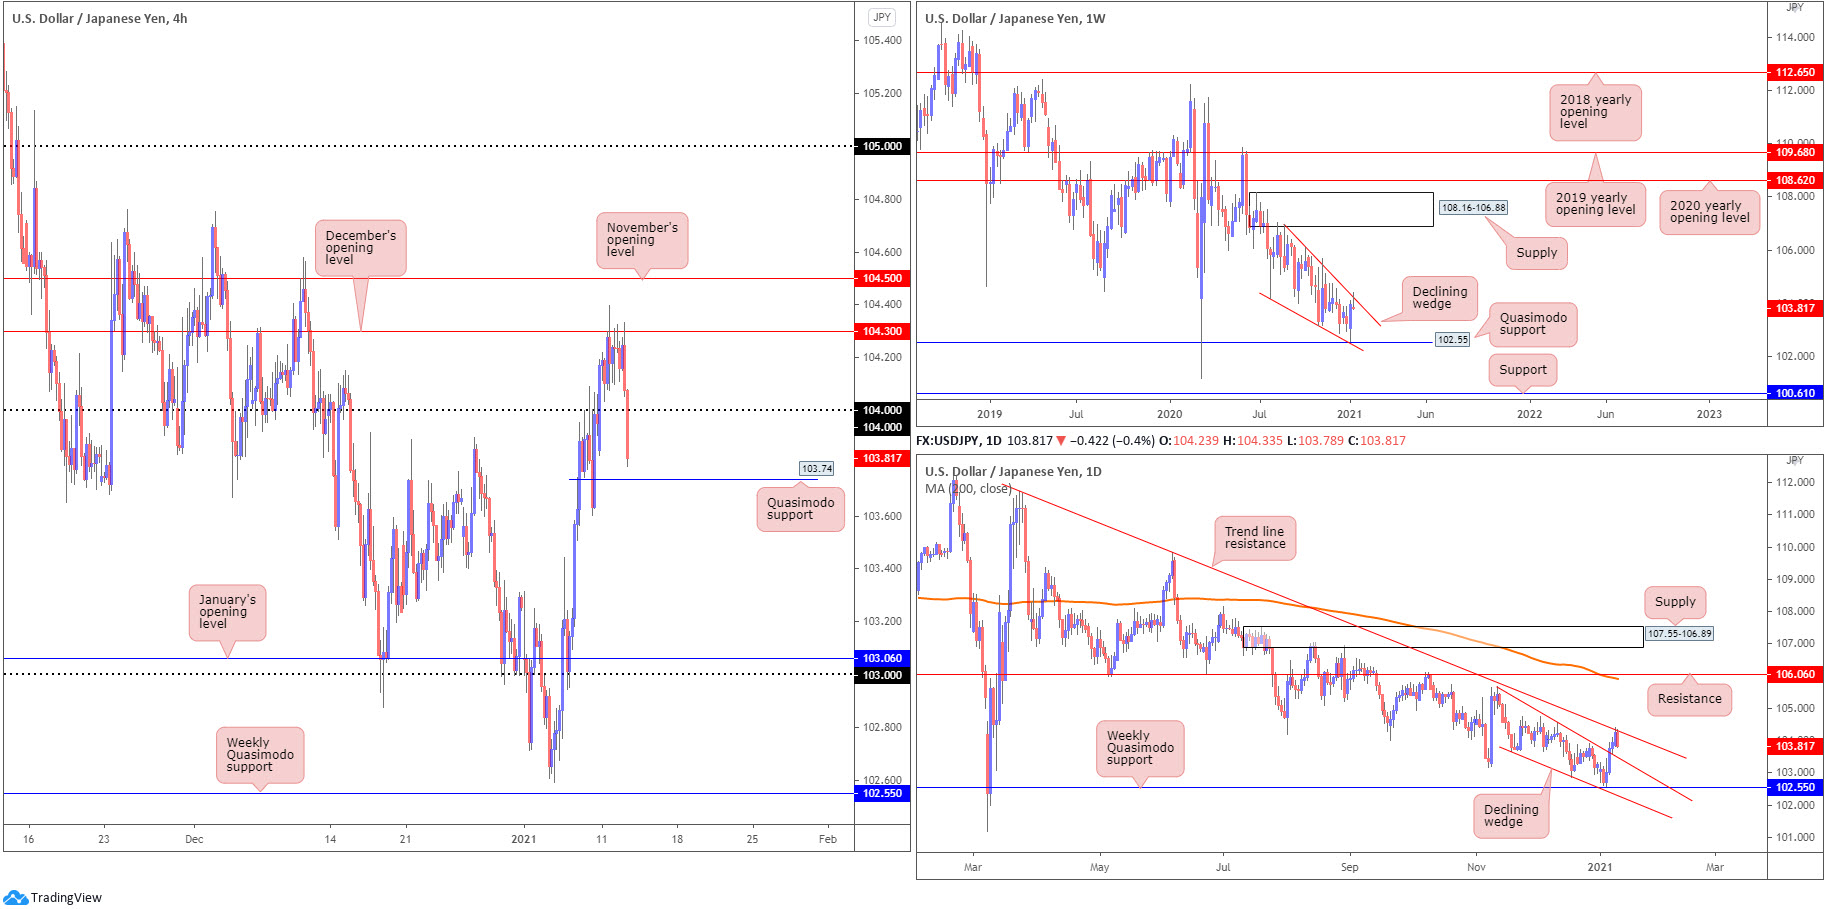
December’s opening value plotted at 104.30 was a technical dream in terms of confluence.
Not only are monthly opening values noteworthy S/R levels, December’s opening value on the H4 also partnered up with daily trend line resistance, extended from the high 111.71, and the upper edge of a weekly declining wedge pattern, taken from the high 106.94.
Therefore, the aggressive downside move through 104 on the H4 should not be a surprise for those who read Tuesday’s technical briefing (italics):
Bolstered by higher timeframe resistances, a bearish scenario could emerge off November’s opening value at 104.30 on the H4 today, and further selling may develop should a H4 close sub 104 take shape.
The next downside target seen on the H4 scale is Quasimodo support at 103.74, with a break potentially targeting as far south as January’s opening value at 103.06 and the 103 figure.
Areas of consideration:
- H4 rebounding from H4 Quasimodo support at 103.74 could facilitate a 104 retest. This, given the room available to move south of 103.74 on the H4, along with daily and weekly timeframes showing scope to travel lower ground, could spark further selling.
USD/CAD:
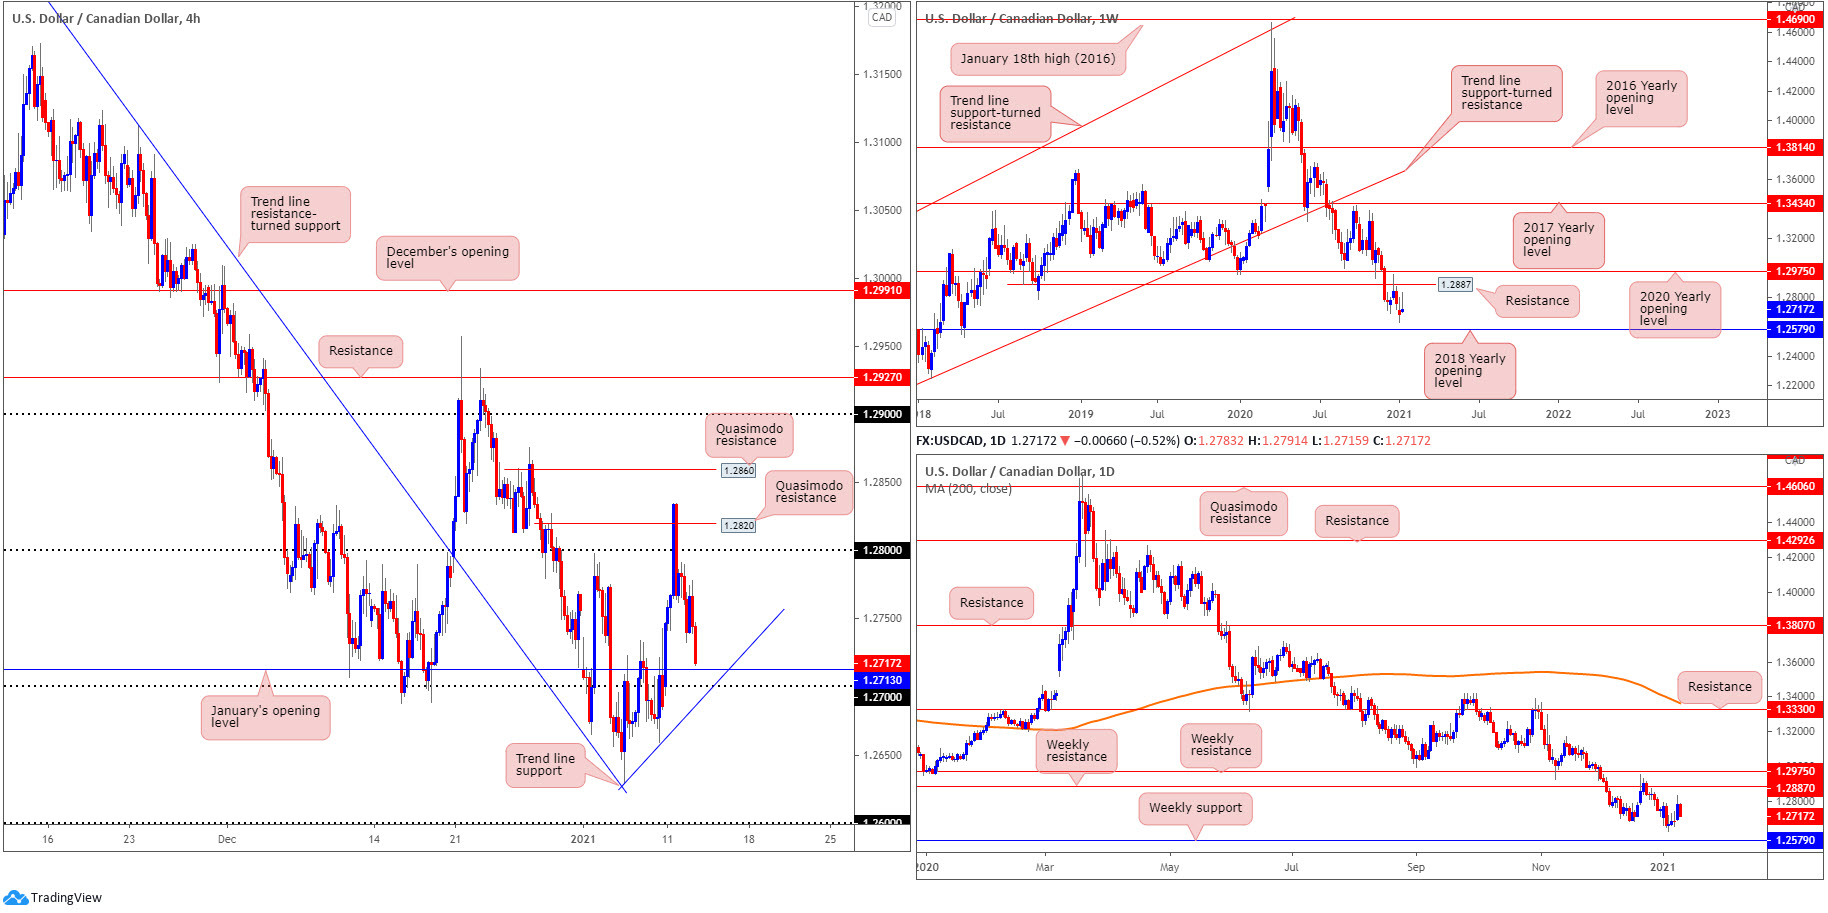
According to longer-term charts (weekly timeframe), this week’s action trades significantly off best levels. Technically, this was likely expected, particularly after early December obliterated the 2020 yearly opening value at 1.2975 and Quasimodo support at 1.2887. With 1.2887 serving as resistance heading into the close of 2020, this (although last week formed an indecision candle) seats the 2018 yearly opening value at 1.2579 in the firing line. Also important to note is that long-term flow (trend) has been pointing lower since topping in March (2020).
The daily chart’s technical picture pretty much resembles that of the weekly timeframe: weekly resistance at 1.2887 and weekly support plotted at 1.2579.
Across the page on the H4 timeframe, however, price action is fast approaching January’s opening value from 1.2713, the 1.27 figure and trend line support, taken from the multi-month low 1.2630. This follows a near-0.5% move south of the 1.28 figure and nearby Quasimodo resistance at 1.2820 on Tuesday. Pushing through trend line support today places 1.2630 in sight, with a break shining the spotlight on 1.26, sited just north of weekly support mentioned above at 1.2579.
Areas of consideration:
- Daily and weekly timeframes, according to the technical studies presented above, exhibit bearish posture.
- With the above on board, a bearish scenario could form and take on 1.27 today to target 1.2630, as well as the 1.26 figure and the weekly support level at 1.2579.
USD/CHF:
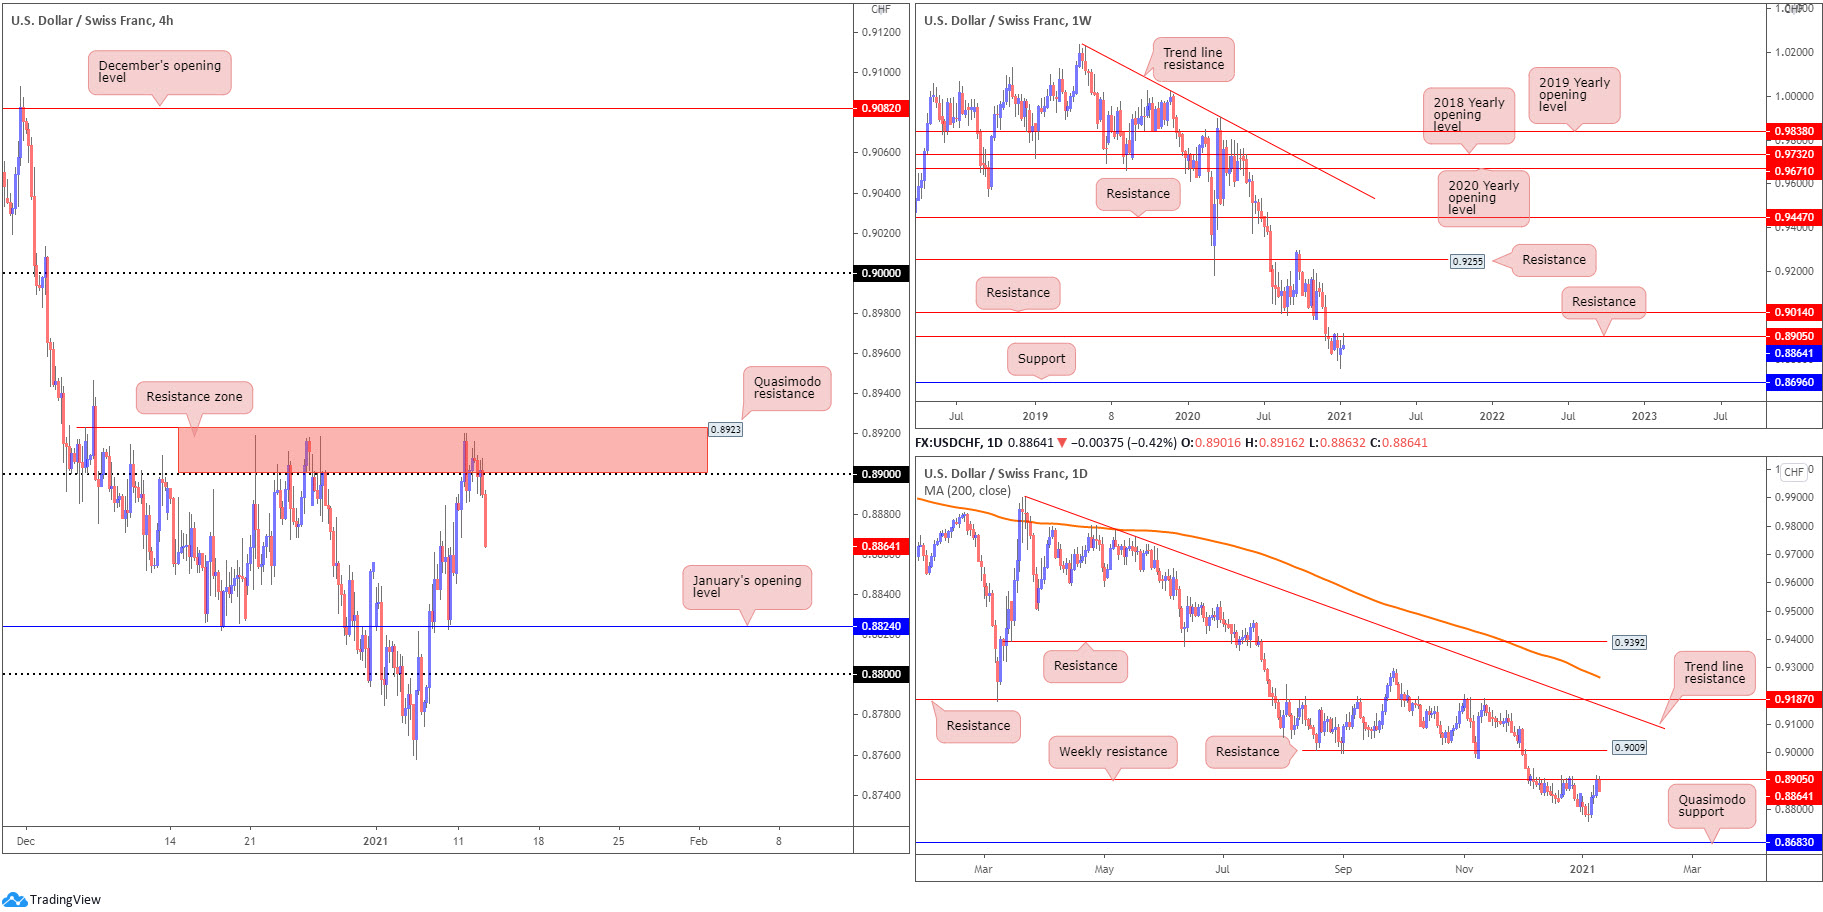
The weekly timeframe shaking hands with resistance at 0.8905, a level partnering up with a H4 resistance zone marked between 0.8923 (Quasimodo resistance) and the 0.89 figure (red zone), proved to be an area of particular interest to sellers on Tuesday.
Monday’s technical briefing actually highlighted the following (italics):
H4 resistance zone at 0.8923/0.89 is an area to be conscious of this week, having noted weekly resistance converging with the base at 0.8905.
With H4 seen powering south of 0.8923/0.89, on course to perhaps reach January’s opening value from 0.8824 and the 0.88 figure, this could also excite short-term sellers.
Areas of consideration:
- Having seen room for all three timeframes (H4, daily and weekly) to seek lower terrain, this could prompt traders to drill down to the lower timeframes and pursue short-term trading setups, targeting the 0.88/0.8824ish range (H4).
- A retest at 0.8923/0.89 is also a scenario worth keeping an eye out for, particularly if 0.8850 bids prove strong.
Dow Jones Industrial Average:
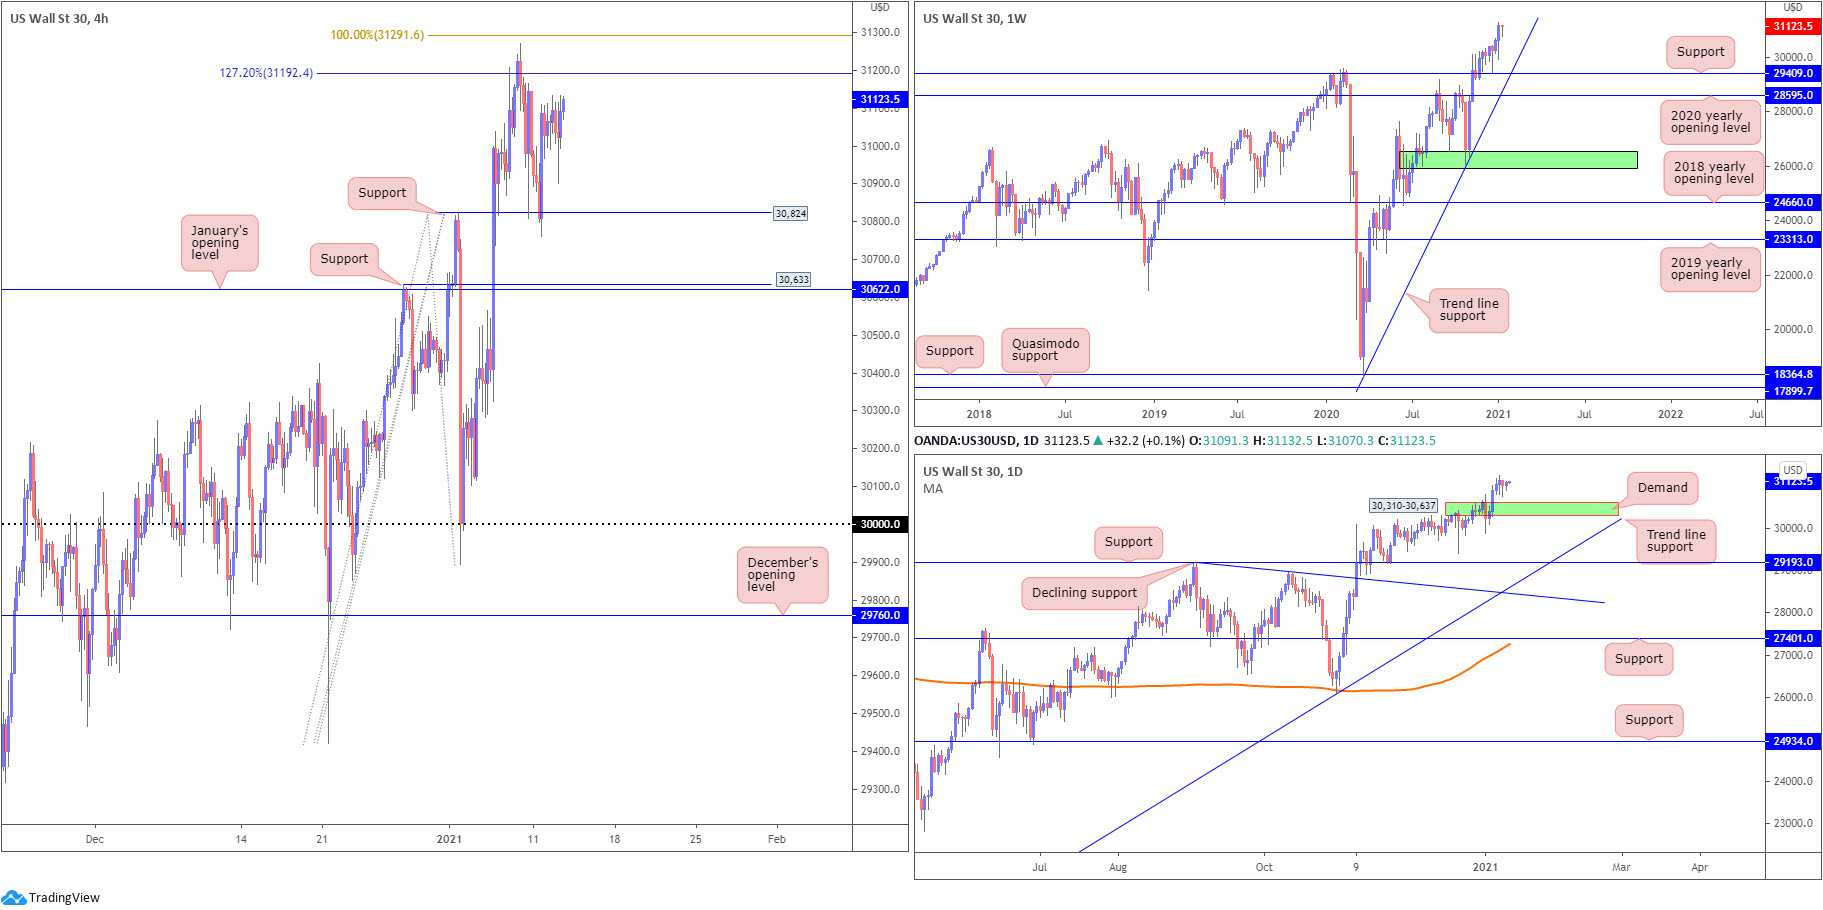
US equity indexes pencilled in modest gains Tuesday, despite technology shares weakening. The Dow Jones Industrial Average added 60.00 points, or 0.19%; the S&P 500 advanced 1.58 points, or 0.04% and the Nasdaq advanced 36.00 points, or 0.28%.
On the technical front, H4 price reveals the unit remains capped between Fibonacci resistance (127.2% Fibonacci projection point at 31,192/100% Fibonacci extension level at 31,291) and support priced in at 30,824 (swing high). Below here, support resides at 30,633, a previous Quasimodo resistance level that blends with January’s opening value at 30,622.
From the weekly timeframe, the DJIA remains circling all-time peaks at 31,271. Should a correction occur, limited support is in sight until 29,409 (previous Quasimodo resistance), together with nearby trend line support, extended from the low 18,213.
A closer reading of price action on the daily timeframe shows price has put forward an indecisive tone since the beginning of the week. If a correction does indeed come to pass, demand is seen at 30,310-30,637.
Areas of consideration:
- H4 support at 30,824.
- H4 resistance (Fibonacci) between 31,192/31,291.
- H4 support at 30,633 and January’s opening value at 30,622, an area plotted within the upper range of daily demand at 30,310-30,637.
- A H4 breakout above 31,291 potentially fuels a bullish breakout theme to refresh all-time peaks.
XAU/USD (GOLD):
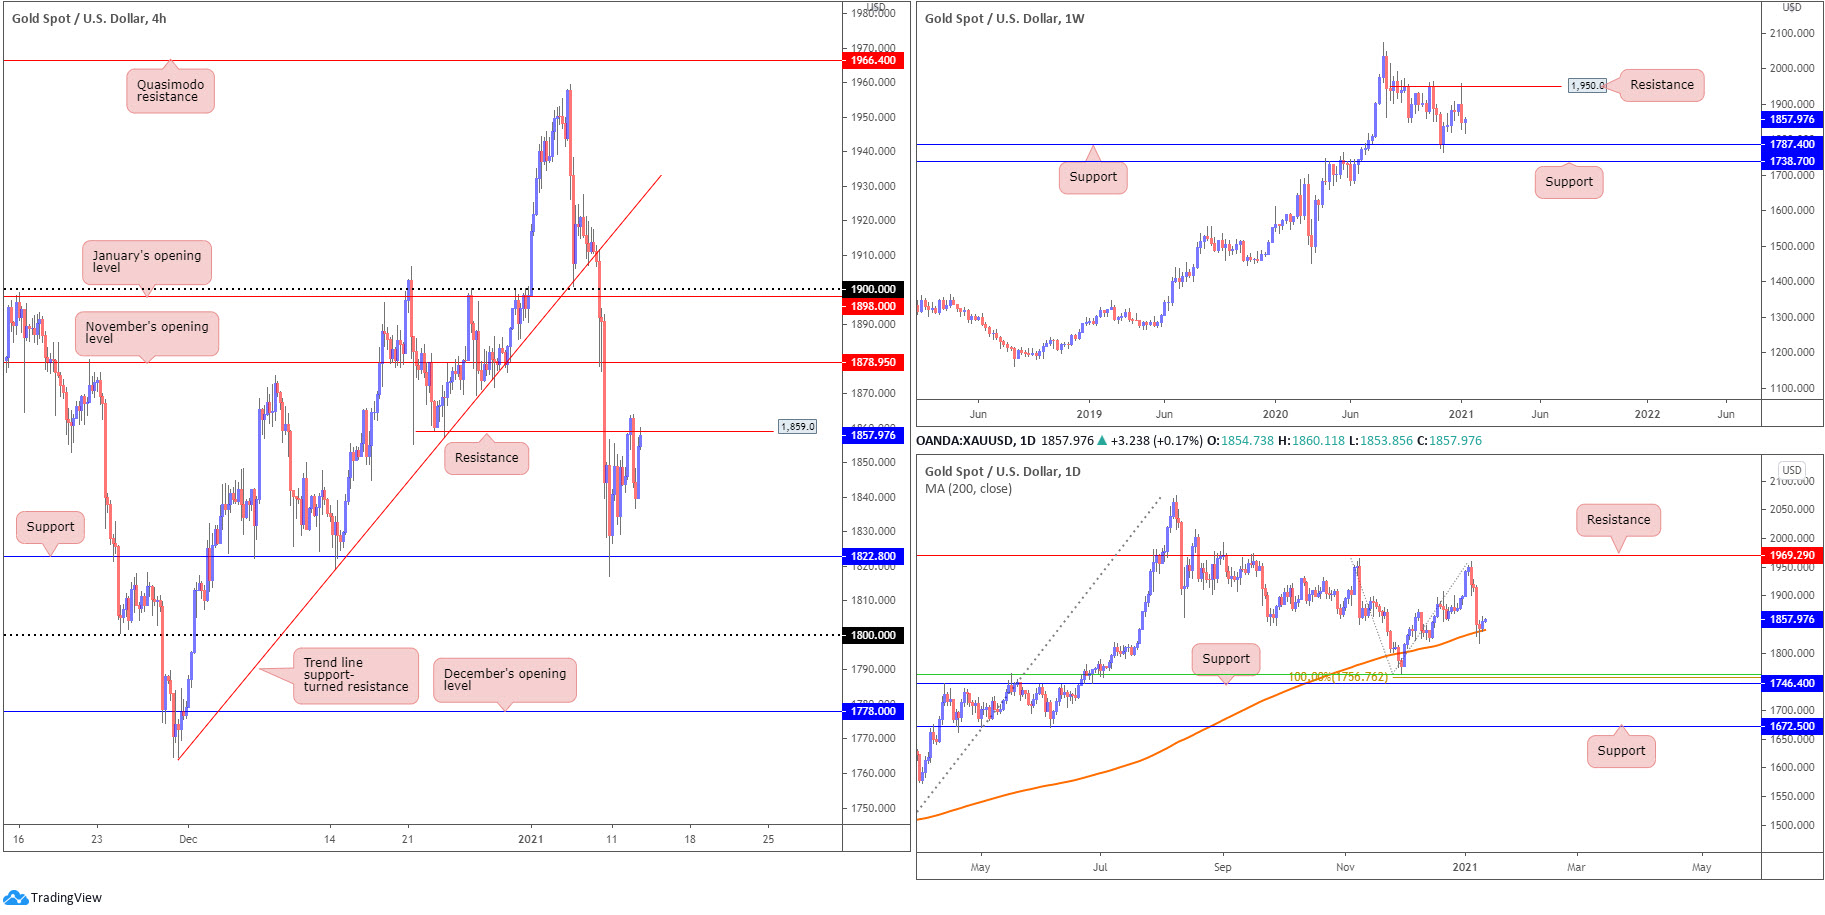
The US dollar (measured by the US dollar index) saw buyers back off on Tuesday, consequently providing fresh impetus for the yellow metal.
Although recording fresh weekly peaks, H4 resistance at $1,859 proved too much for buyers amid early US hours.
North of $1,859 could see buyers strengthen their grip, in hope of connecting with November’s opening value from $1,878 and quite possibly the $1,900 psychological figure (as well as January’s opening value at $1,898). Fresh buying, of course, remains bolstered by the 200-day SMA (orange – $1,840), a dynamic support that made an appearance last Friday.
The other side of the field, however, reveals weekly price recently rebounded from the underside of resistance at $1,950. Should sellers govern direction, support at $1,787 could play a leading role, a level plotted just north of another layer of support at $1,738.
Also clear on the weekly timeframe is that although the recent sell-off may have triggered short-term interest to the downside, it is worth noting that in terms of trend we’ve been higher since early 2016.
Areas of consideration:
- Weekly resistance at $1,950 suggests sellers want to keep things lower, potentially at least until weekly support enters the fight at $1,787. The concern for sellers, nevertheless, is the test of the 200-day SMA and, of course, the prevailing uptrend.
- A H4 close above H4 resistance from $1,859 could tempt an intraday bullish theme towards November’s opening value at $1,878.
- December’s opening value at $1,778 and the $1,800 barrier on the H4 (although unlikely to be tested today) are also interesting as the levels form a relatively close connection with weekly support at $1,787.
The accuracy, completeness and timeliness of the information contained on this site cannot be guaranteed. IC Markets does not warranty, guarantee or make any representations, or assume any liability regarding financial results based on the use of the information in the site.
News, views, opinions, recommendations and other information obtained from sources outside of www.icmarkets.com.au, used in this site are believed to be reliable, but we cannot guarantee their accuracy or completeness. All such information is subject to change at any time without notice. IC Markets assumes no responsibility for the content of any linked site.
The fact that such links may exist does not indicate approval or endorsement of any material contained on any linked site. IC Markets is not liable for any harm caused by the transmission, through accessing the services or information on this site, of a computer virus, or other computer code or programming device that might be used to access, delete, damage, disable, disrupt or otherwise impede in any manner, the operation of the site or of any user’s software, hardware, data or property.


