DXY (US Dollar Index):
Potential Direction: Bearish
Overall momentum of the chart: Bearish
Price could potentially make a bearish reaction off pivot and drop to 1st support.
Pivot: 105.41
Supporting reasons: An Overlap resistance, indicating a significant level where selling pressure might intensify.
1st support: 104.88
Supporting reasons: Swing low support, suggesting a level where buyers might step in to support the price.
1st resistance: 105.93
Supporting reasons: An Overlap resistance, representing a level where selling pressure might increase, potentially acting as a barrier to further upside movement.

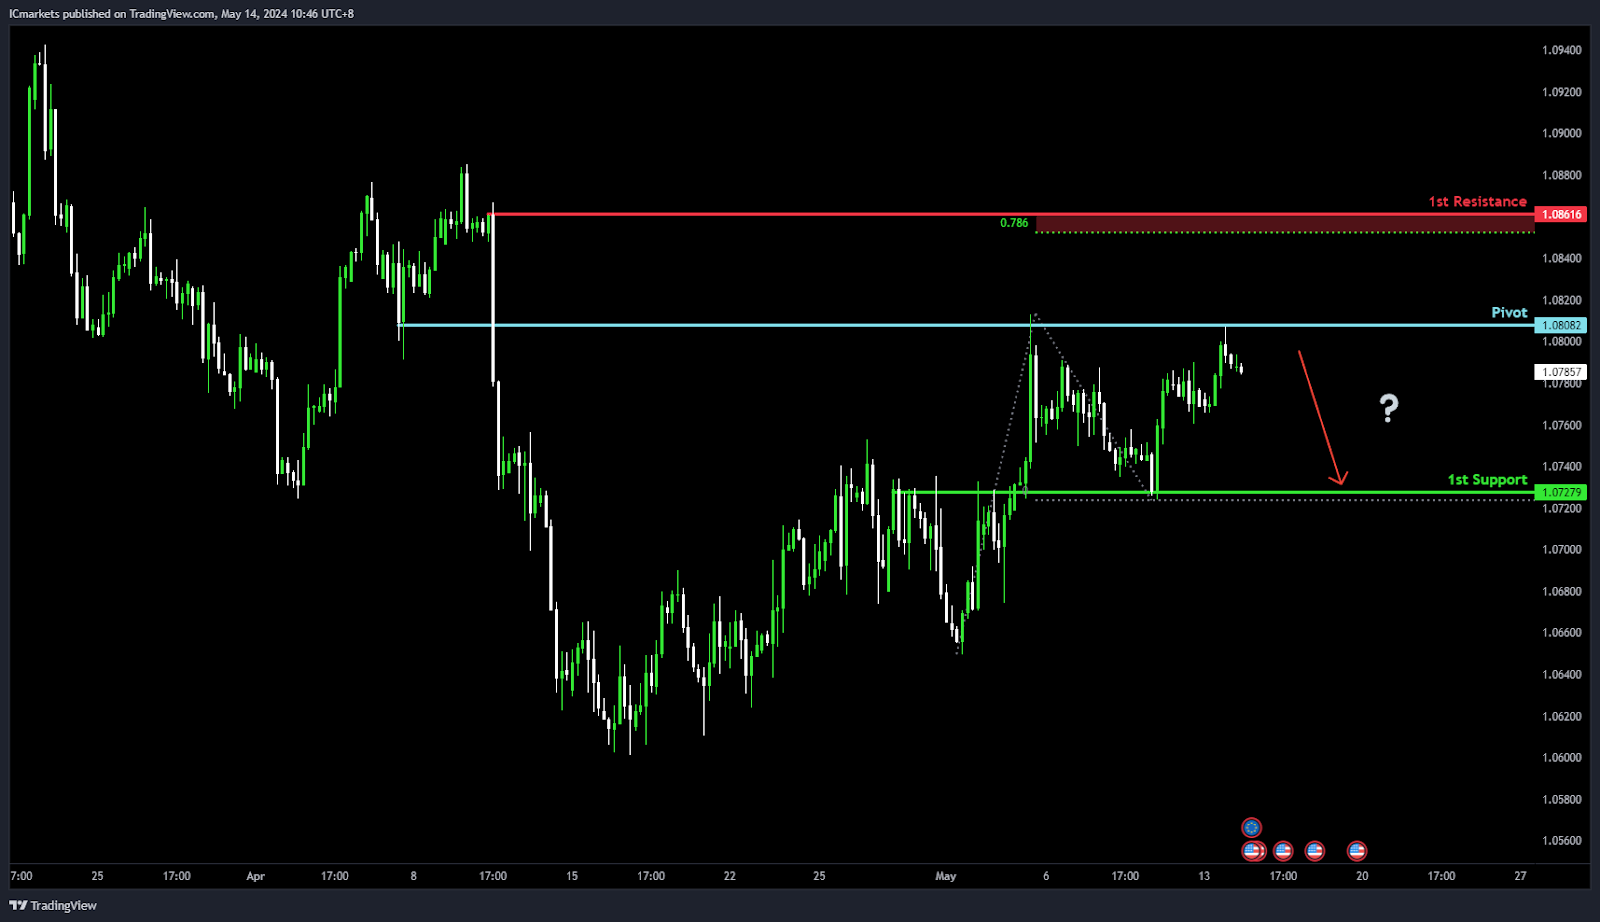
EUR/USD:
Potential Direction: Bearish
Overall momentum of the chart: Bullish
Price could potentially make a bearish reaction off pivot and drop to 1st support.
Pivot: 1.0808
Supporting reasons: An Overlap resistance, indicating a significant level where selling pressure might intensify.
1st support: 1.0727
Supporting reasons: An Overlap support, suggesting a level where buyers might step in to support the price.
1st resistance: 1.0861
Supporting reasons: An Overlap resistance, representing a level where selling pressure might increase, potentially acting as a barrier to further upside movement, further supported by the 78.60% Fibonacci Projection.
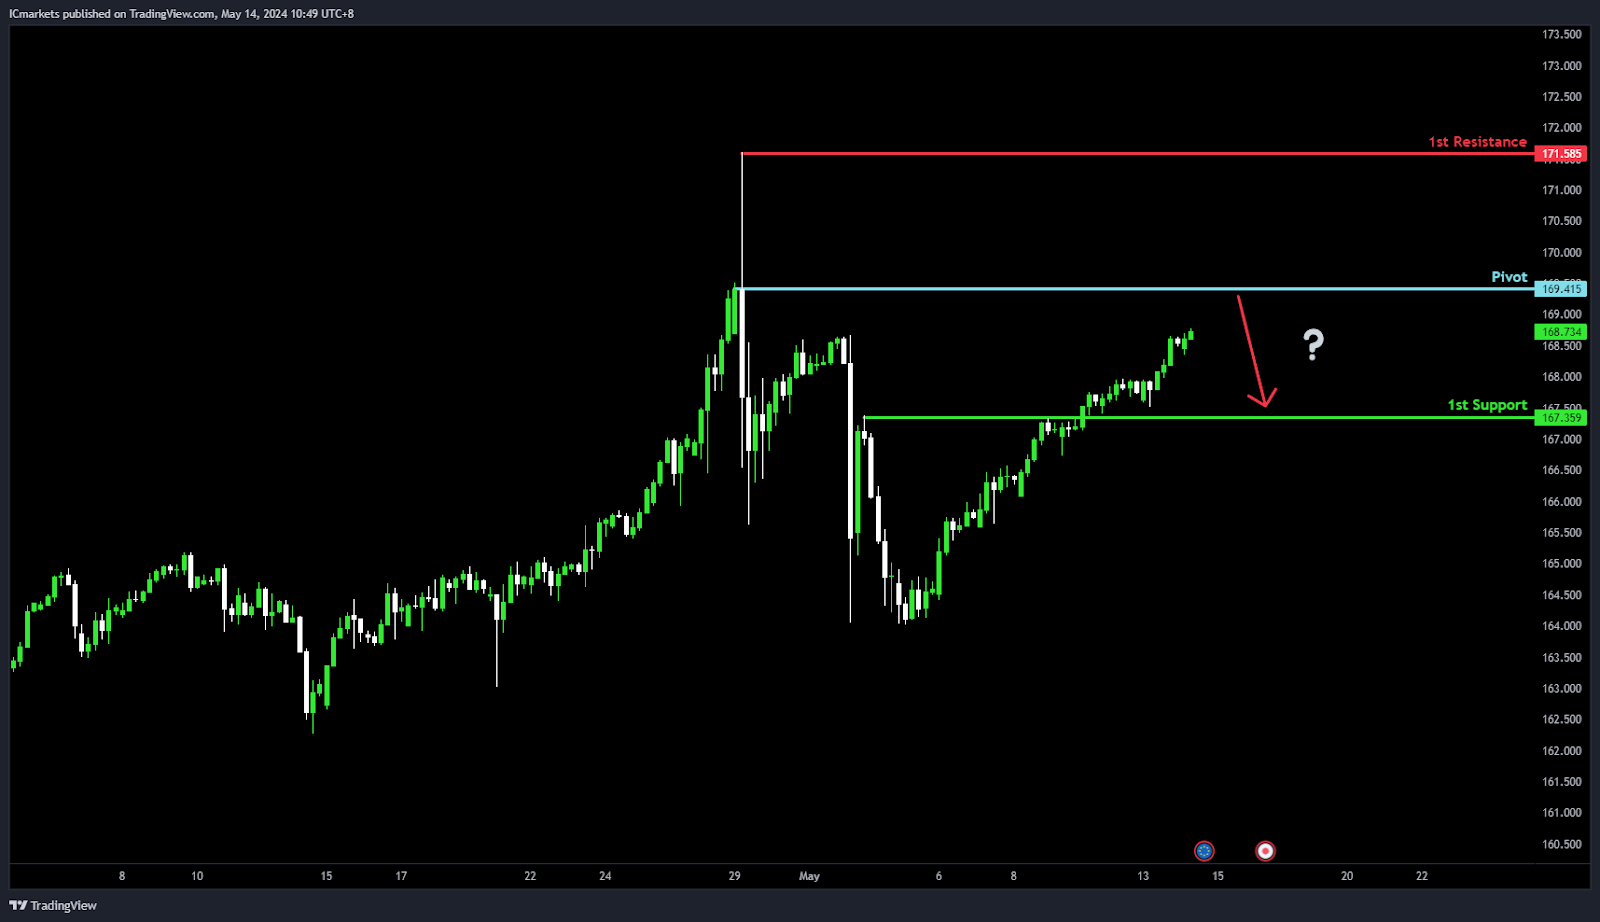
EUR/JPY:
Potential Direction: Bearish
Overall momentum of the chart: Bullish
Price could potentially make a bearish reaction off pivot and drop to 1st support.
Pivot: 169.41
Supporting reasons: The pivot level coincides with a significant swing high resistance, indicating a level where selling pressure might intensify.
1st support: 167.35
Supporting reasons: This level is marked by an overlap support, suggesting it as a potential area where buyers could step in to support the price.
1st resistance: 171.58
Supporting reasons: A swing high resistance is observed at this level, indicating a point where selling pressure might increase. Additionally, this resistance level is further supported by the bullish momentum of the chart.
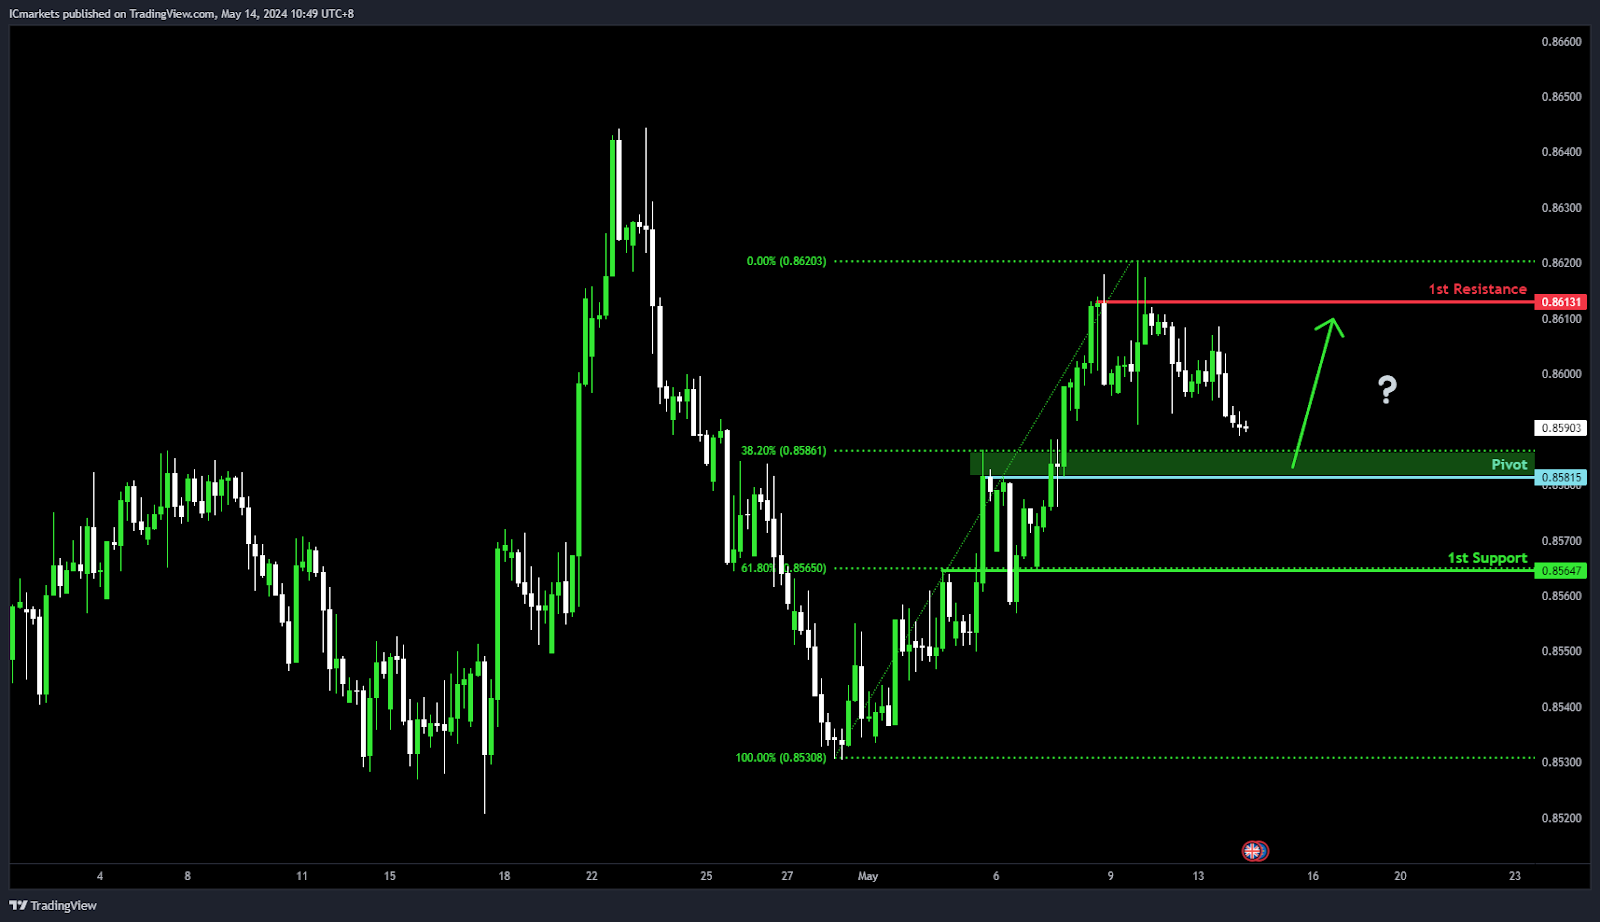
EUR/GBP:
Potential Direction: Bullish
Overall momentum of the chart: Bullish
Price could potentially make a bullish bounce off the pivot and head towards the 1st resistance.
Pivot: 0.8581
Supporting reasons: The pivot level aligns with a significant pullback support, coinciding with the 38.20% Fibonacci Retracement level.
1st support: 0.8564
Supporting reasons: This level is marked by an overlap support and also corresponds to the 61.80% Fibonacci Retracement level, indicating a strong area of potential buying interest.
1st resistance: 0.6813
Supporting reasons: A multi-swing high resistance is observed at this level, suggesting it as a significant barrier for further upside movement.
GBP/USD:
Potential Direction: Bearish
Overall momentum of the chart: Bearish
Factors contributing to the momentum: The price is currently facing resistance from an overlap resistance level and the 61.80% Fibonacci Retracement level, indicating potential selling pressure.
Price could potentially make a bearish reaction off the pivot and drop to the 1st support.
Pivot: 1.2565
Supporting reasons: The pivot level coincides with an overlap resistance and the 61.80% Fibonacci Retracement level, suggesting a strong area of resistance.
1st support: 1.2473
Supporting reasons: This level is characterized by multi-swing low support, indicating a significant level where buying interest may emerge.
1st resistance: 1.2633
Supporting reasons: A swing high resistance is observed at this level, suggesting it as a significant barrier for further upside movement.

GBP/JPY:
Potential Direction: Bearish
Overall momentum of the chart: Bullish
Price could potentially make a bearish reaction off the pivot and drop to the 1st support.
Pivot: 197.45
Supporting reasons: The pivot level aligns with a swing high resistance and the 61.80% Fibonacci Retracement level, indicating a strong area of resistance.
1st support: 193.49
Supporting reasons: This level is characterized by an overlap support, suggesting a significant level where buying interest may emerge.
1st resistance: 200.64
Supporting reasons: A swing high resistance is observed at this level, suggesting it as a significant barrier for further upside movement.

USD/CHF:
Potential Direction: Bearish
Overall momentum of the chart: Bearish
Price could potentially make a bearish reaction off the pivot and drop to the 1st support.
Pivot: 0.9097
Supporting reasons: The pivot level coincides with an overlap resistance and the 38.20% Fibonacci Retracement level, indicating a strong area of resistance.
1st support: 0.9019
Supporting reasons: This level is characterized by multiple swing lows, suggesting a significant level where buying interest may emerge.
1st resistance: 0.9152
Supporting reasons: A pullback resistance is observed at this level, indicating a potential barrier for further upside movement.

USD/JPY:
Potential Direction: Bearish
Overall momentum of the chart: Bullish
Price could potentially make a bearish reaction off the pivot and drop to the 1st support.
Pivot: 156.47
Supporting reasons: The pivot level aligns with a pullback resistance at the 78.60% Fibonacci Retracement, suggesting a strong area of resistance.
1st support: 153.37
Supporting reasons: This level is characterized by an overlap support, indicating a significant level where buying interest may emerge.
1st resistance: 158.40
Supporting reasons: A swing high resistance is observed at this level, suggesting a potential barrier for further upside movement.

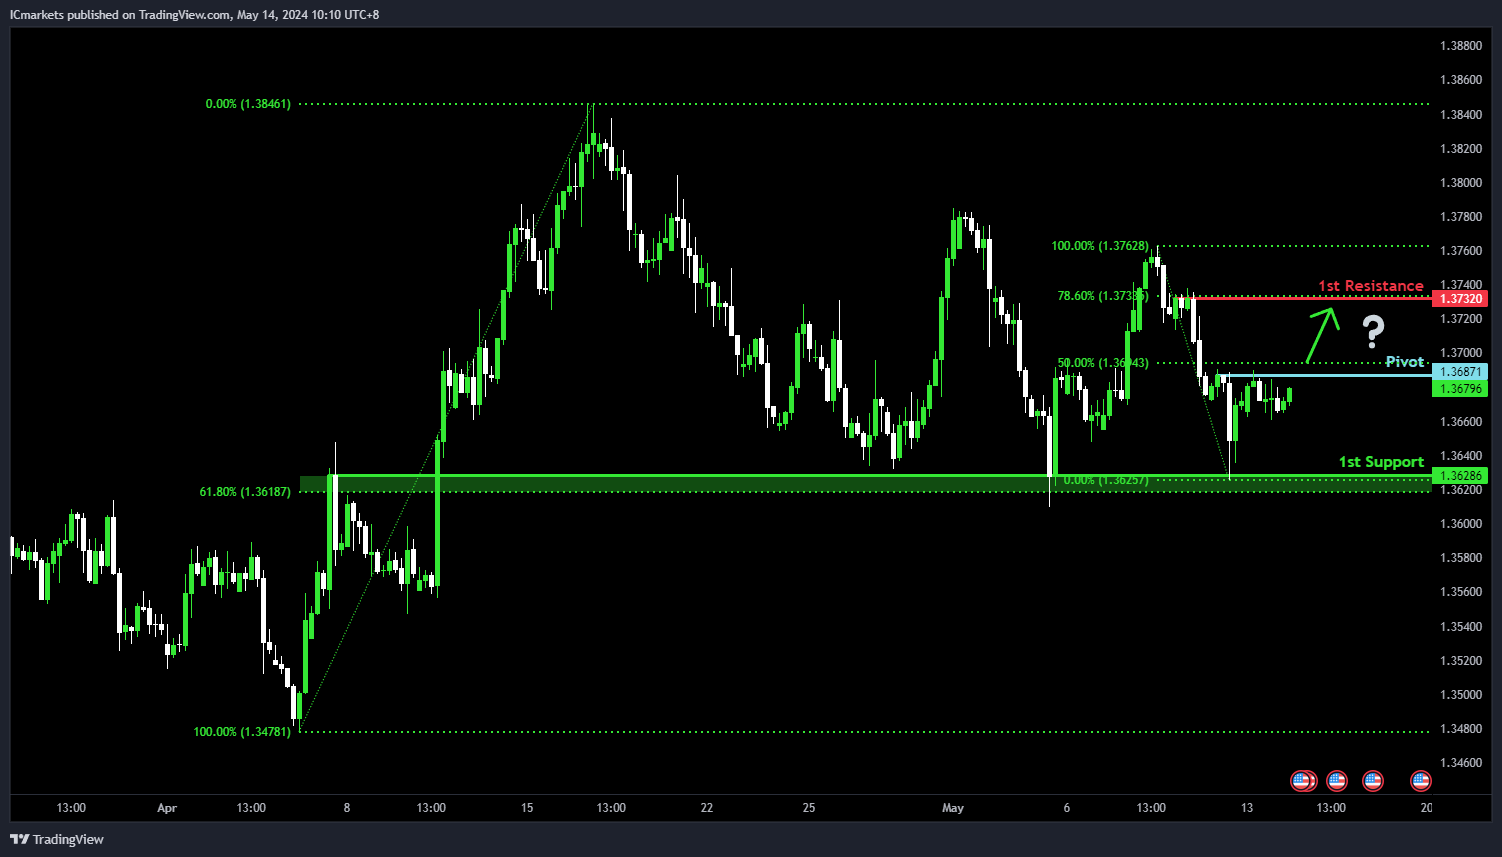
USD/CAD:
Potential Direction: Bullish
Overall momentum of the chart: Neutral
Price could make a bullish reaction through the pivot and potentially rise towards the 1st resistance.
Pivot: 1.3687
Supporting reasons: Acts as a potential breakout level where the bullish momentum could drive price higher.
1st support: 1.3628
Supporting reasons: Identified as an overlap support that aligns close to a 61.8% Fibonacci retracement level, suggesting an area where price has found strong buying interests in the past to potentially halt any further downward movement.
1st resistance: 1.3732
Supporting reasons: Identified as a pullback resistance that aligns with a 78.6% Fibonacci retracement level, marking a significant barrier that could cap further upward movements.
AUD/USD:
Potential Direction: Bearish
Overall momentum of the chart: Neutral
Price could rise towards the pivot and potentially make a bearish reaction off this level to drop towards the 1st support.
Pivot: 0.6624
Supporting reasons: Acts as a pullback resistance, suggesting an area where selling pressures have intensified recently.
1st support: 0.6562
Supporting reasons: Acts as a pullback support that aligns with a 50% Fibonacci retracement level, suggesting a significant area where price has found strong support in the past to provide a basis to halt further downward movement.
1st resistance: 0.6639
Supporting reasons: Identified as a pullback resistance, marking a barrier that has previously capped upward movements.

NZD/USD
Potential Direction: Bearish
Overall momentum of the chart: Neutral
Price could rise towards the pivot and potentially make a bearish reaction off this level to drop towards the 1st support.
Pivot: 0.6037
Supporting reasons: Acts as a pullback resistance, suggesting an area where selling pressures have intensified recently.
1st support: 0.5982
Supporting reasons: Acts as an overlap support that aligns with a 38.2% Fibonacci retracement level, suggesting a potential area where price has found strong support in the past to provide a basis to halt further downward movement.
1st resistance: 0.6073
Supporting reasons: Identified as a swing-high resistance, marking a barrier that has previously capped upward movements.

US30 (DJIA):
Potential Direction: Bullish
Overall momentum of the chart: Bullish
Price is trading close to the pivot and could potentially make a bullish reaction off this level to rise towards the 1st resistance.
Pivot: 39,412.72
Supporting reasons: Identified as an overlap support where price could stage a rebound to climb higher.
1st support: 39,045.82
Supporting reasons: Identified as an overlap support, suggesting a significant area where price could find strong buying interest to could provide a solid foundation to halt further downward movement.
1st resistance: 39,993.29
Supporting reasons: Identified as a swing-high resistance that aligns close to the all-time high, indicating a potential barrier that could cap any upward movements.

DE40 (DAX):
Potential Direction: Bullish
Overall momentum of the chart: Bullish
Price could fall towards the pivot and potentially make a bullish reaction off this level to rise towards the 1st resistance.
Pivot: 18,545.10
Supporting reasons: Identified as a pull back support that aligns close to a 23.6% Fibonacci retracement level, suggesting a significant area where buying interests could pick up.
1st support: 18,324.11
Supporting reasons: Acts as a pullback support that aligns close to a 50% Fibonacci retracement level, suggesting an area where buying interests could pick up to halt further downward movement.
1st resistance: 18,848.30
Supporting reasons: Identified as a resistance that aligns close to the all-time high, potentially functioning as a barrier that could cap any upward movements.

US500 (S&P 500):
Potential Direction: Bullish
Overall momentum of the chart: Bullish
Price is trading close to the pivot and could potentially make a bullish reaction off this level to rise towards the 1st resistance.
Pivot: 5,203.86
Supporting reasons: Identified as an overlap support where price could stage a rebound to climb higher.
1st support: 5,167.12
Supporting reasons: Acts as an overlap support, suggesting a significant area where price could find strong buying interest to could provide a solid foundation to halt further downward movement.
1st resistance: 5,278.56
Supporting reasons: Acts as a pullback resistance that aligns close to the all-time high, suggesting a significant area where selling pressures could intensify.

BTC/USD (Bitcoin):
Potential Direction: Bearish
Overall momentum of the chart: Neutral
Price has made a bearish reaction off the pivot and could potentially drop towards the 1st support.
Pivot: 63,223.31
Supporting reasons: Identified as an overlap support that aligns close to a 61.8% Fibonacci retracement level, suggesting an area where selling pressures have intensified recently.
1st support: 60,593.34
Supporting reasons: Acts as a pullback support that aligns close to a 61.8% Fibonacci retracement level, suggesting an area where buying interests could pick up to halt further downward movements.
1st resistance: 65,521.94
Supporting reasons: Marked by a swing-high resistance, indicating a significant barrier that could cap further upward movements.

ETH/USD (Ethereum):
Potential Direction: Bullish
Overall momentum of the chart: Neutral
Price could fall towards the pivot and potentially make a bullish reaction off this level to rise towards the 1st resistance.
Pivot: 2,863.34
Supporting reasons: Acts as a pullback support, suggesting a significant area where buying interests have increased in the past.
1st support: 2,685.96
Supporting reasons: Identified as an overlap support, suggesting a significant area which could provide a strong foundation to halt further downward movements.
1st resistance: 3,048.22
Supporting reasons: Identified as an overlap resistance that aligns with a 50% Fibonacci retracement level, marking a significant barrier that could cap further upward movements.

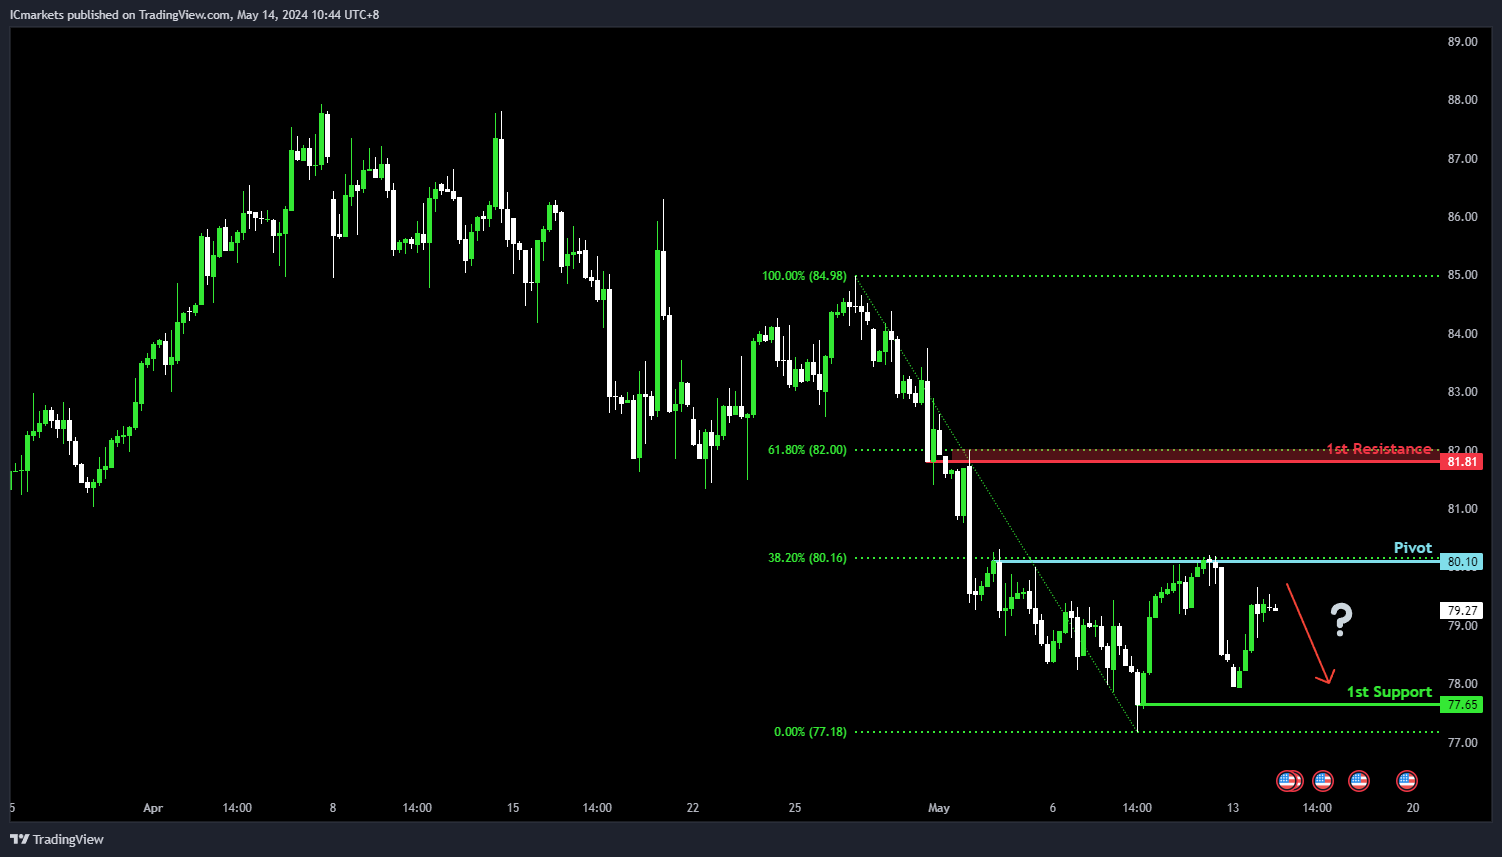
WTI/USD (Oil):
Potential Direction: Bearish
Overall momentum of the chart: Neutral
Price could rise towards the pivot and potentially make a bearish reaction off this level to drop towards the 1st support.
Pivot: 80.10
Supporting reasons: Acts as a pullback support that aligns with a 38.2% Fibonacci retracement level, suggesting a significant area where selling pressures have increased recently.
1st support: 77.65
Supporting reasons: Identified as a pullback support, suggesting a significant area where price has previously found strong buying interest recently and could provide a solid foundation to halt further downward movements.
1st resistance: 81.81
Supporting reasons: Identified as an overlap resistance that aligns close to a 61.8% Fibonacci retracement level, marking a significant barrier that could cap further upward movements.
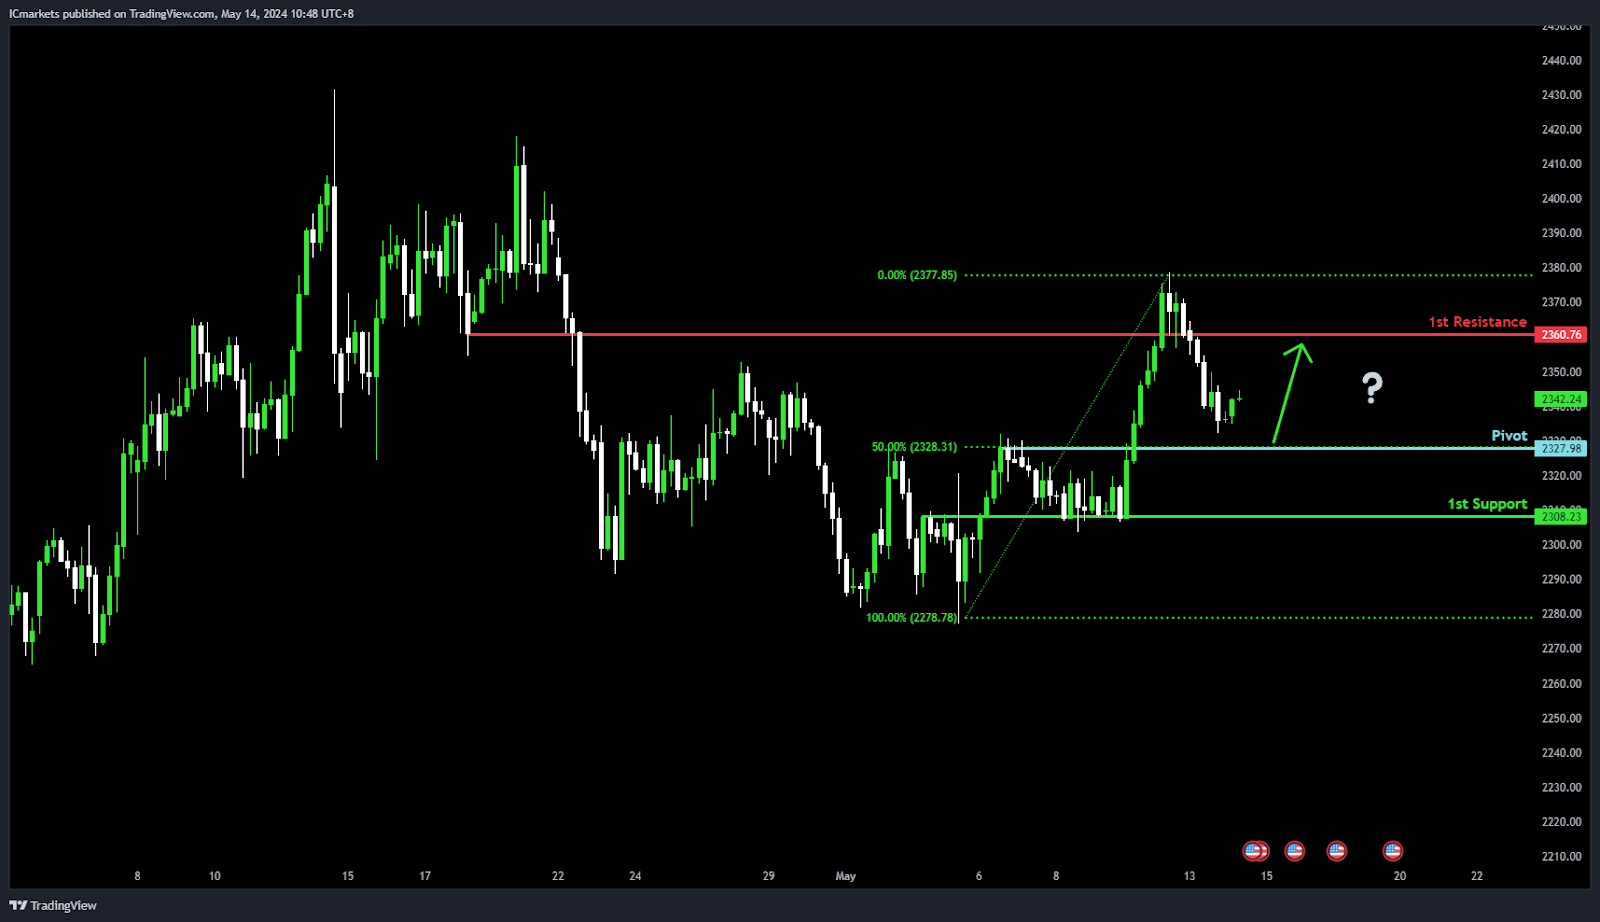
XAU/USD (GOLD):
Potential Direction: Bullish
Overall momentum of the chart: Bullish
Price could potentially make a bullish bounce off the pivot and head towards the 1st resistance.
Pivot: 2327.00
Supporting reasons: The pivot level coincides with a pullback support at the 50% Fibonacci Retracement, indicating a strong area of potential buying interest.
1st support: 2308.23
Supporting reasons: An overlap support is observed at this level, suggesting a significant area where buyers may enter the market.
1st resistance: 2360.00
Supporting reasons: This level represents a pullback resistance, indicating a potential barrier for further upward movement.
The accuracy, completeness and timeliness of the information contained on this site cannot be guaranteed. IC Markets does not warranty, guarantee or make any representations, or assume any liability regarding financial results based on the use of the information in the site.
News, views, opinions, recommendations and other information obtained from sources outside of www.icmarkets-vng.com, used in this site are believed to be reliable, but we cannot guarantee their accuracy or completeness. All such information is subject to change at any time without notice. IC Markets assumes no responsibility for the content of any linked site.
The fact that such links may exist does not indicate approval or endorsement of any material contained on any linked site. IC Markets is not liable for any harm caused by the transmission, through accessing the services or information on this site, of a computer virus, or other computer code or programming device that might be used to access, delete, damage, disable, disrupt or otherwise impede in any manner, the operation of the site or of any user’s software, hardware, data or property.


