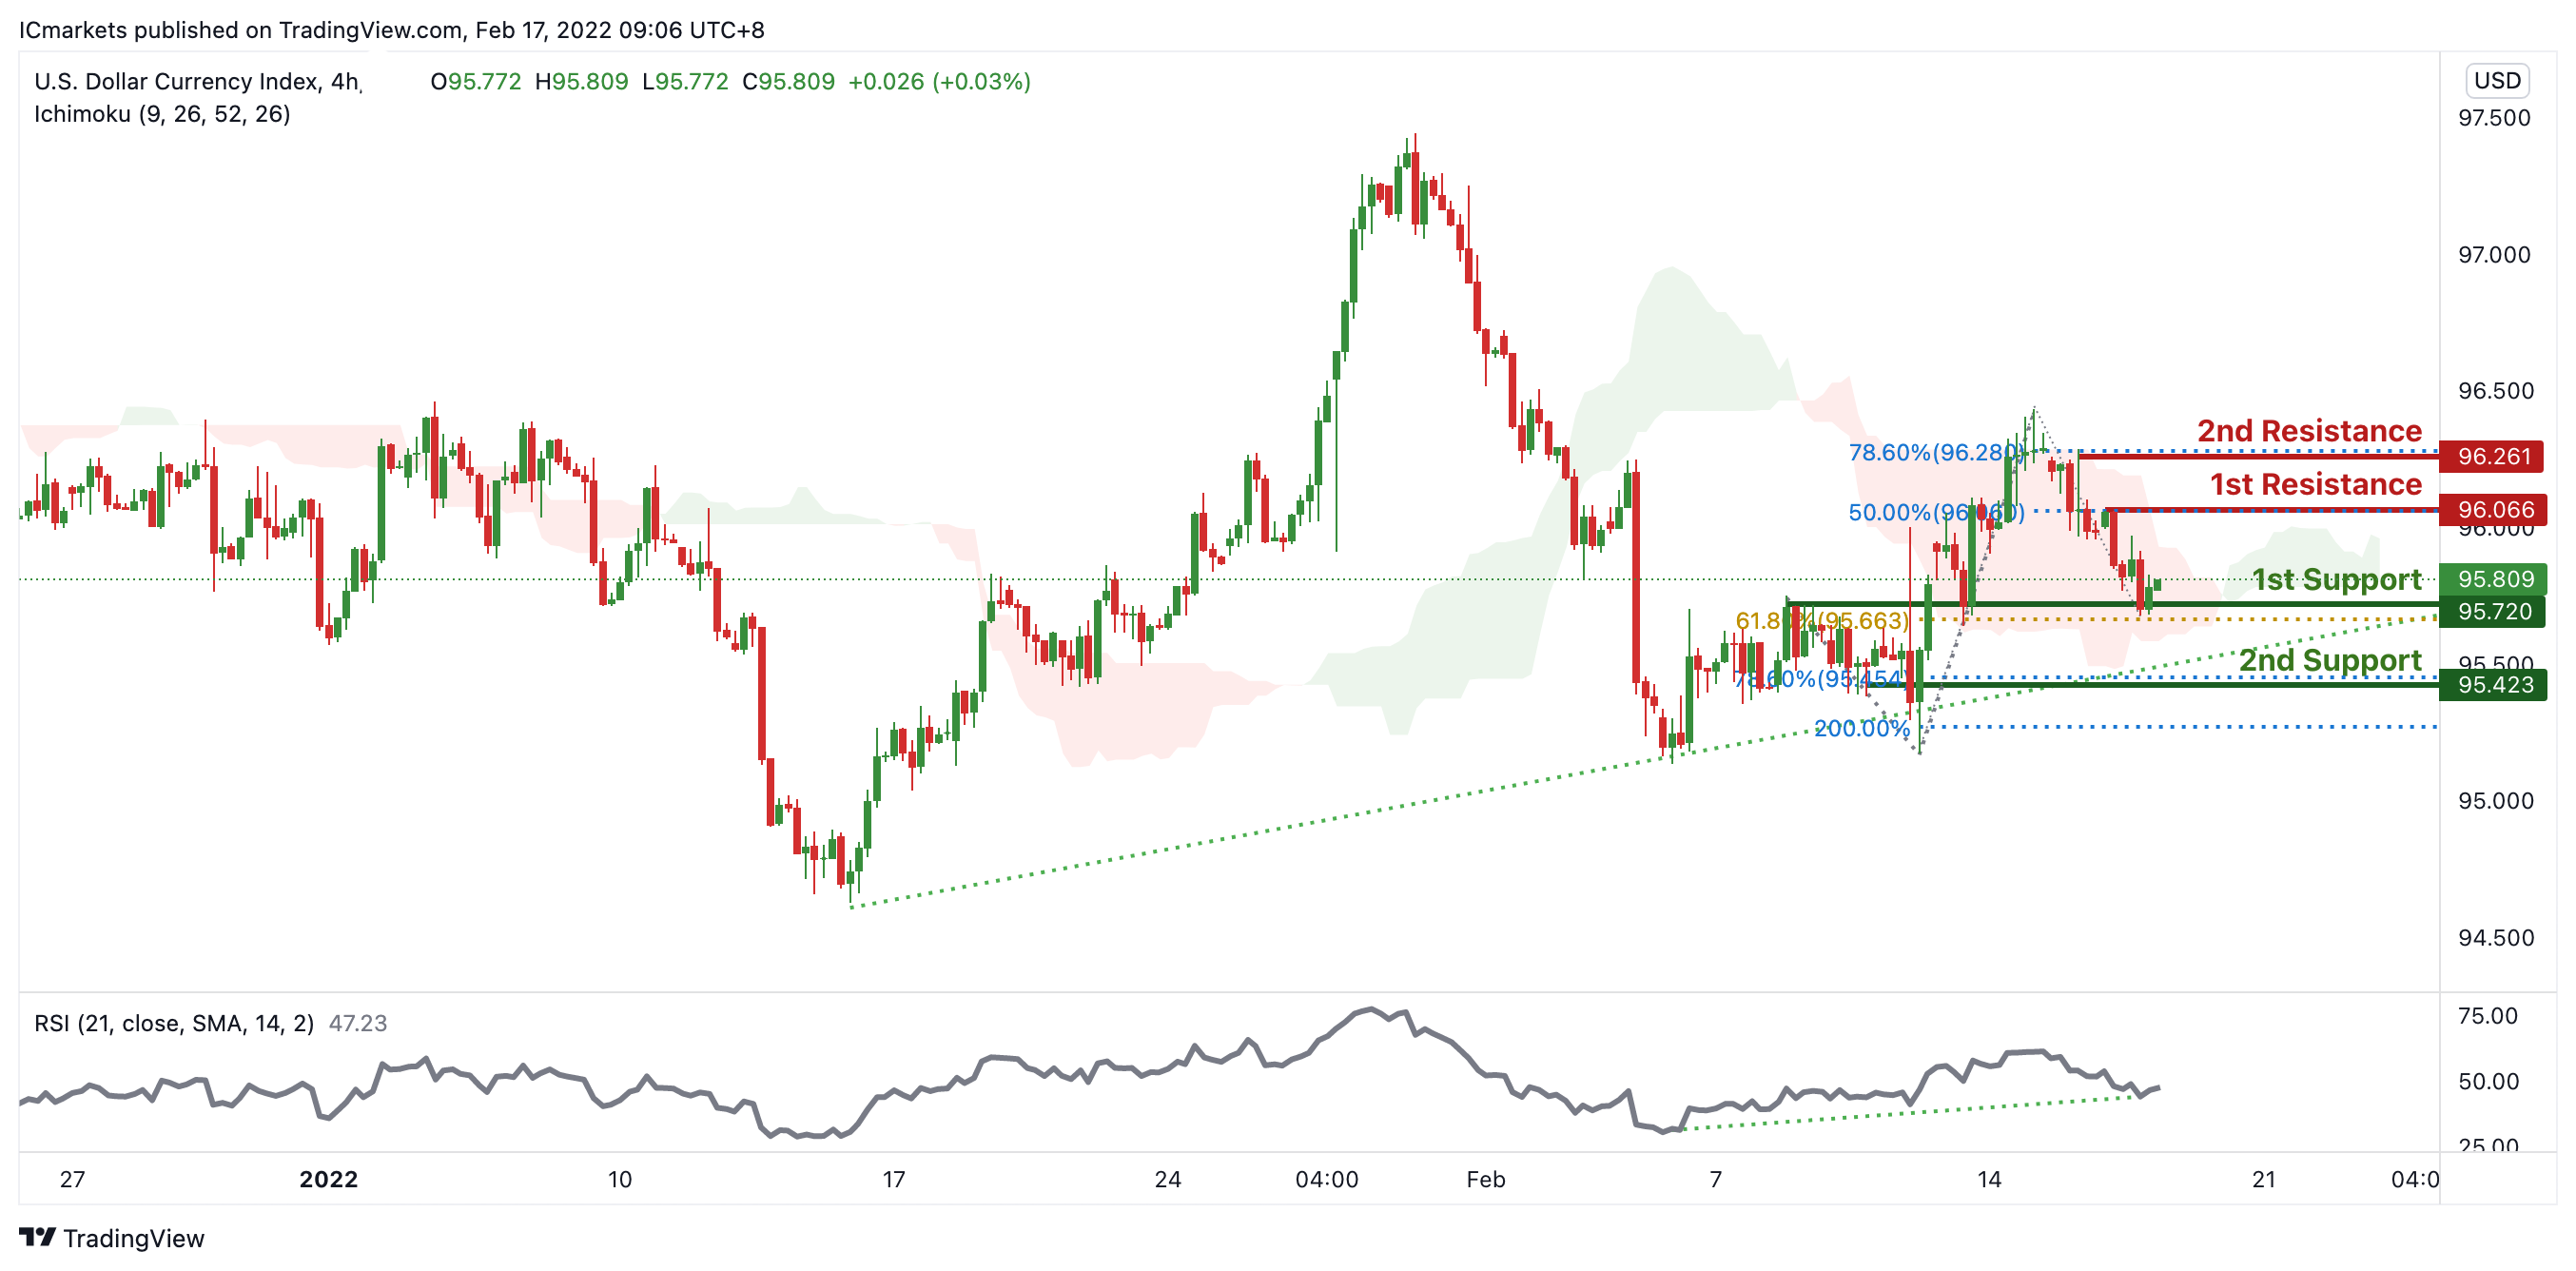
DXY:
On the H4 timeframe, prices are abiding by a daily ascending trendline and are on bullish momentum. We see the potential for a bounce from our 1st support at 95.720 in line with 61.8% Fibonacci extension and graphical overlap towards our 1st resistance at 96.066 in line with 50% Fibonacci retracement. Our bullish bias is further supported by our RSI showing bullish momentum and prices trading above our ichimoku cloud support.
Areas of consideration:
- H4 time frame, 1st resistance at 96.066
- H4 time frame, 1st support at 95.720
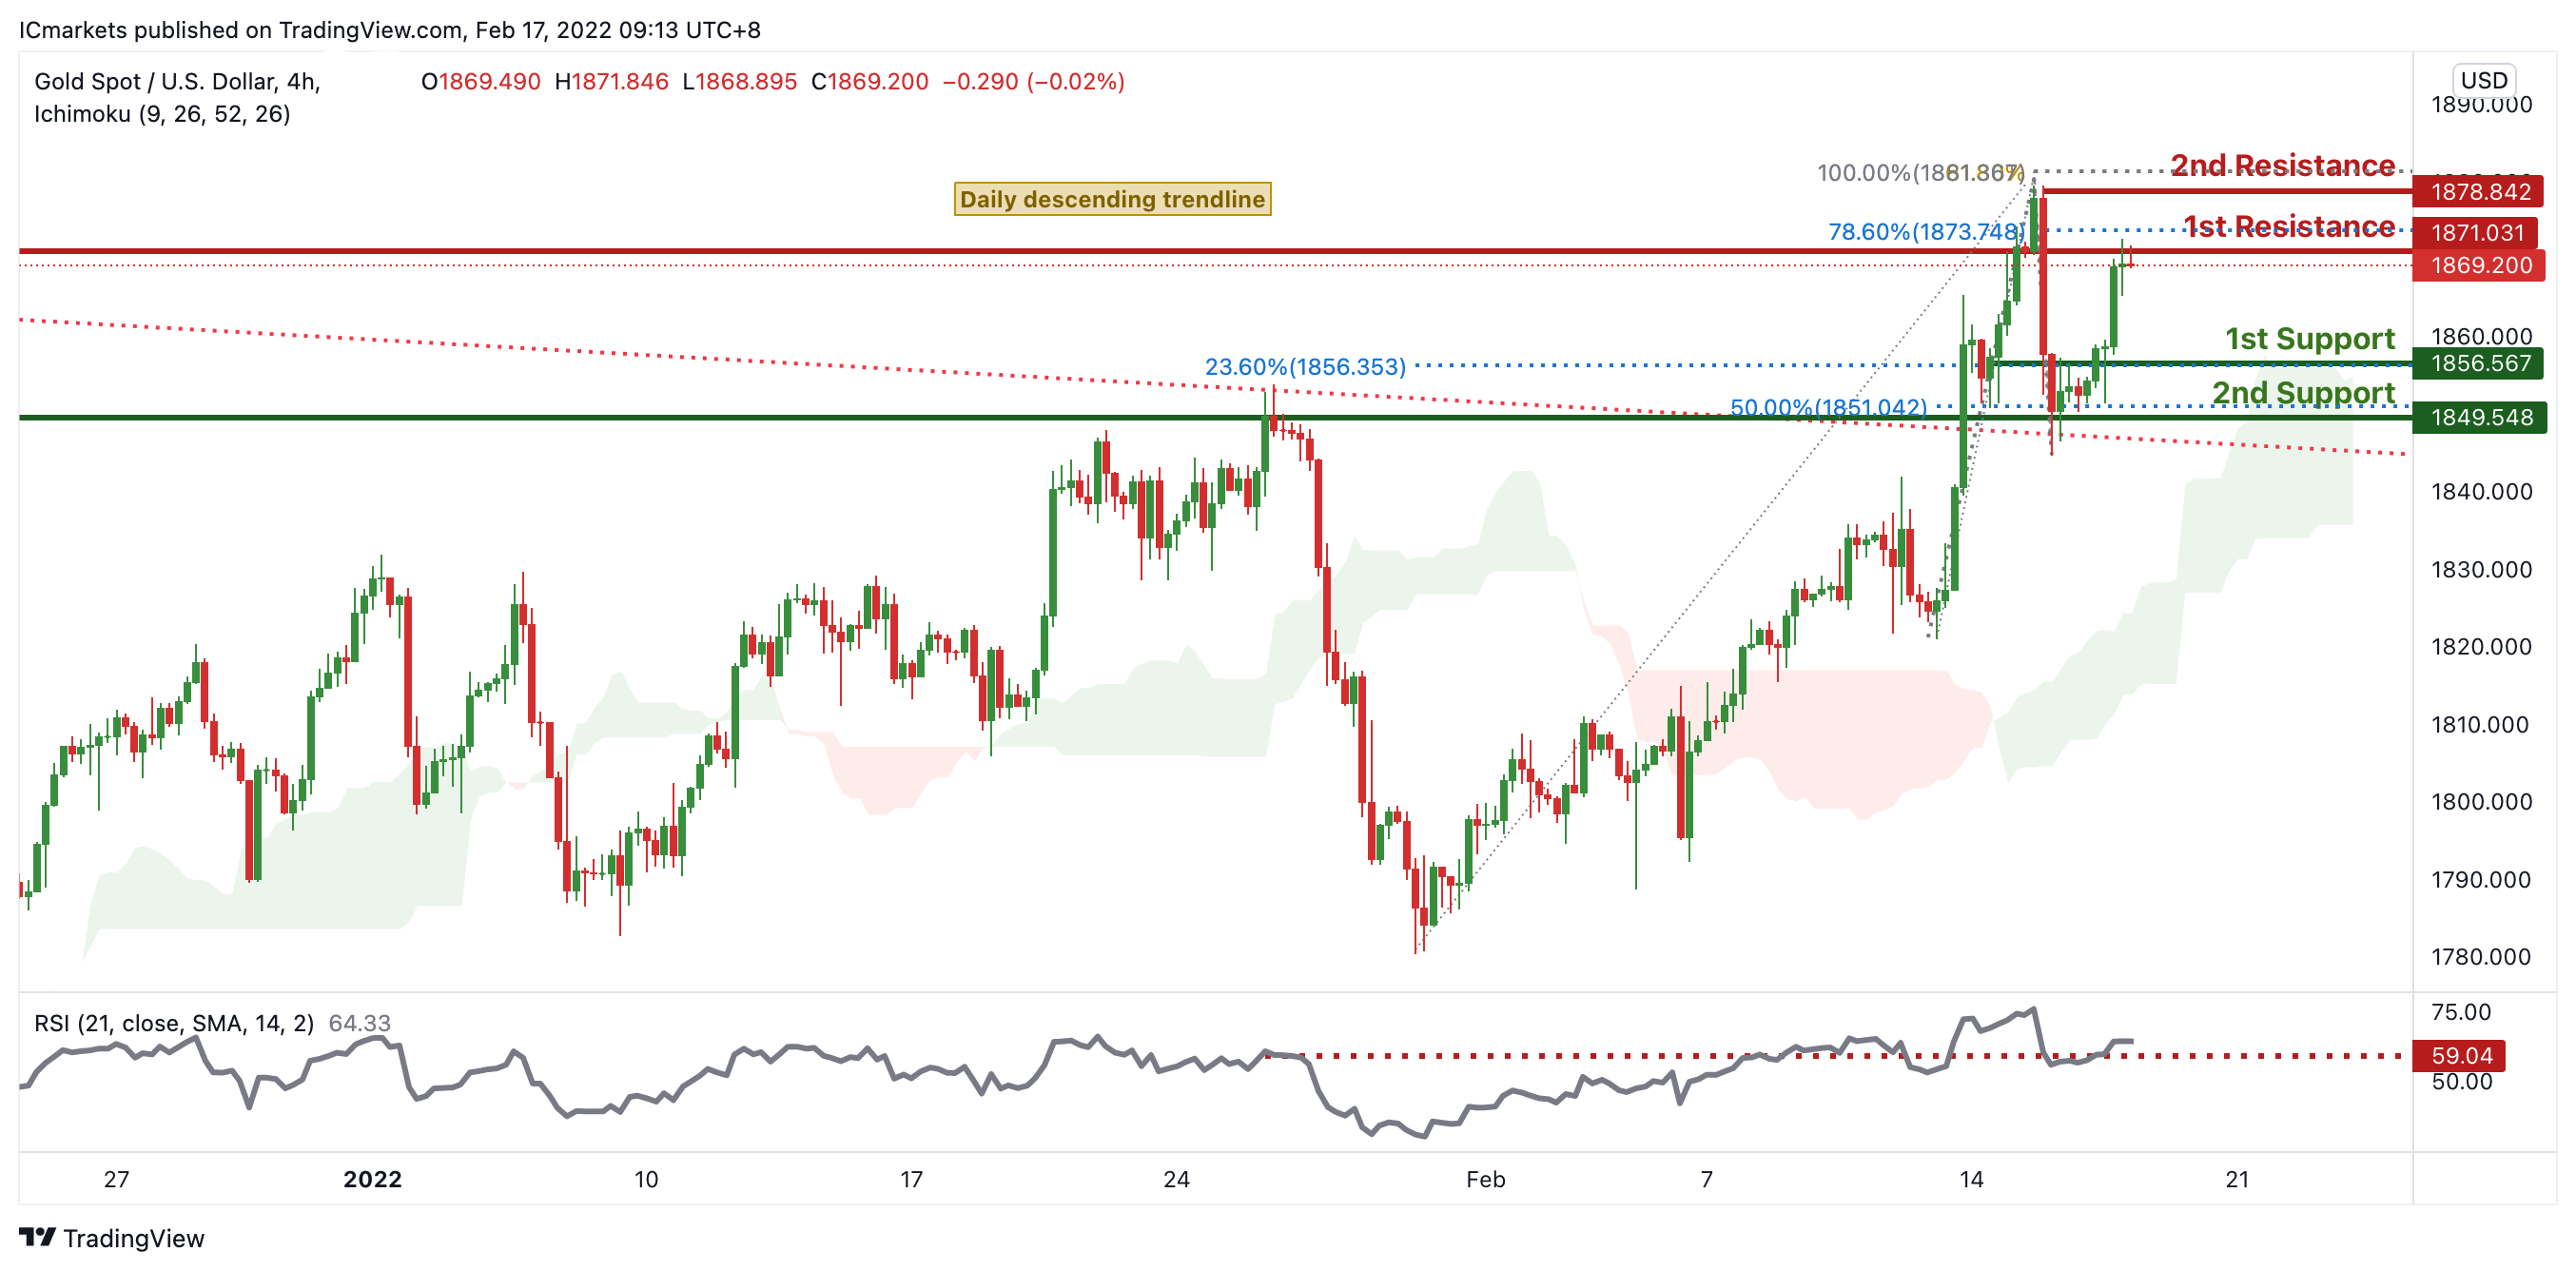
XAU/USD (GOLD):
On the H4 chart, prices have recently broken out of our daily descending trendline. We see potential for a slight pullback from our 1st resistance at 1869.220 in line with 78.6% Fibonacci retracement towards our 1st support at 1856.567 in line with 23.6% Fibonacci retracement. RSI are at levels where dips previously occurred.
Areas of consideration:
- 4h 1st support at 1856.567
- 4h 1st resistance at 1869.220
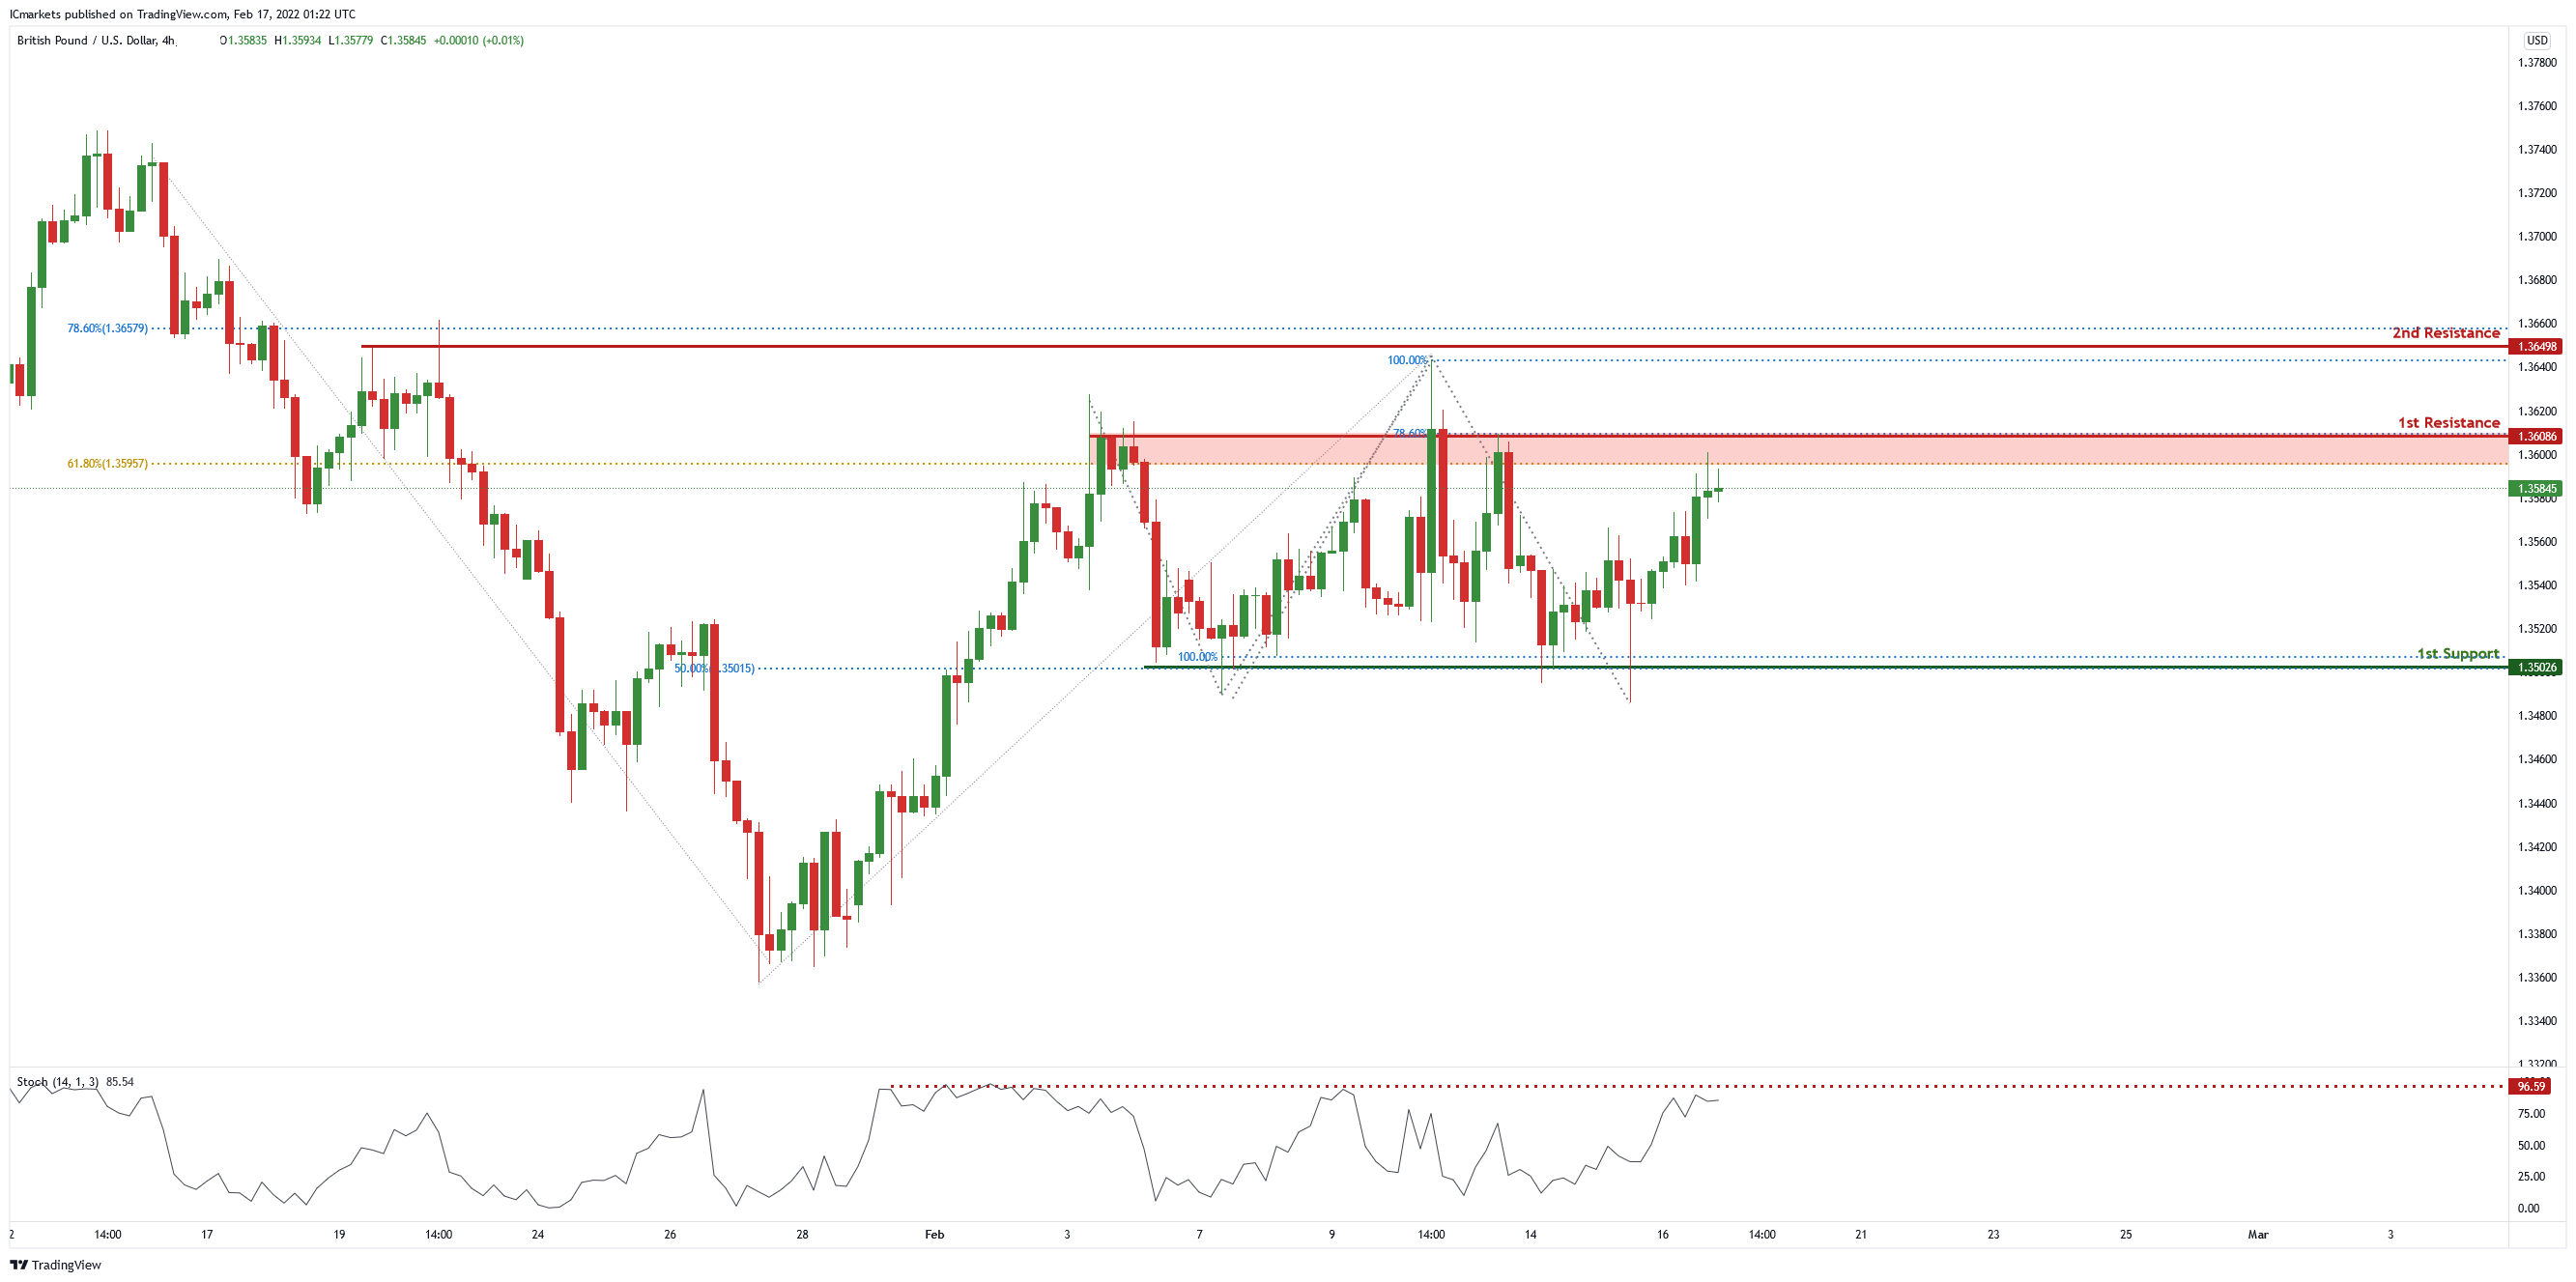
GBP/USD
On the H4 chart , price is near 1st resistance level of 1.36086 in line with 61.8% Fibonacci retracement and 78.6% Fibonacci projection. Price can potentially dip to the take profit level of 1.35026 in line with 50% Fibonacci retracement and 100% Fibonacci projection . Our bearish bias is supported by the stochastic indicator as it is near resistance level.
Areas of consideration
- H4 1st resistance at 1.36086
- H4 1st support at 1.35026
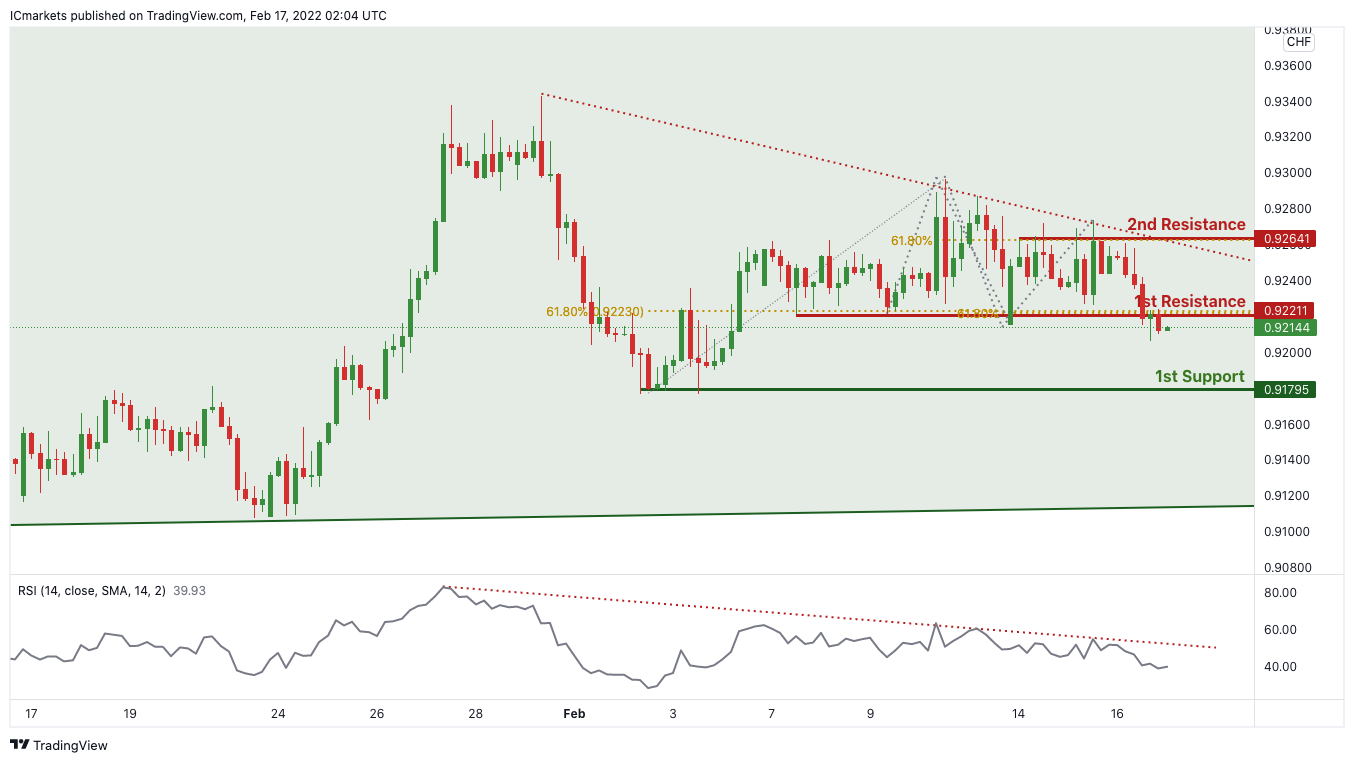
USD/CHF:
On the H4 timeframe, price is abiding to the daily ascending channel and descending trendline resistance on the H4. We can expect the price to drop from 1st Resistance in line with 61.8% Fibonacci projection towards 1st Support in line with 61.8% Fibonacci projection and 61.8% Fibonacci retracement. Our bearish bias is further supported by the RSI indicator where it is abiding to the descending trendline resistance. Traders should wait for prices to swing higher or lower before entering.
Areas of consideration:
- Watch 1st Support at 0.91795
- Watch 1st Resistance at 0.92211
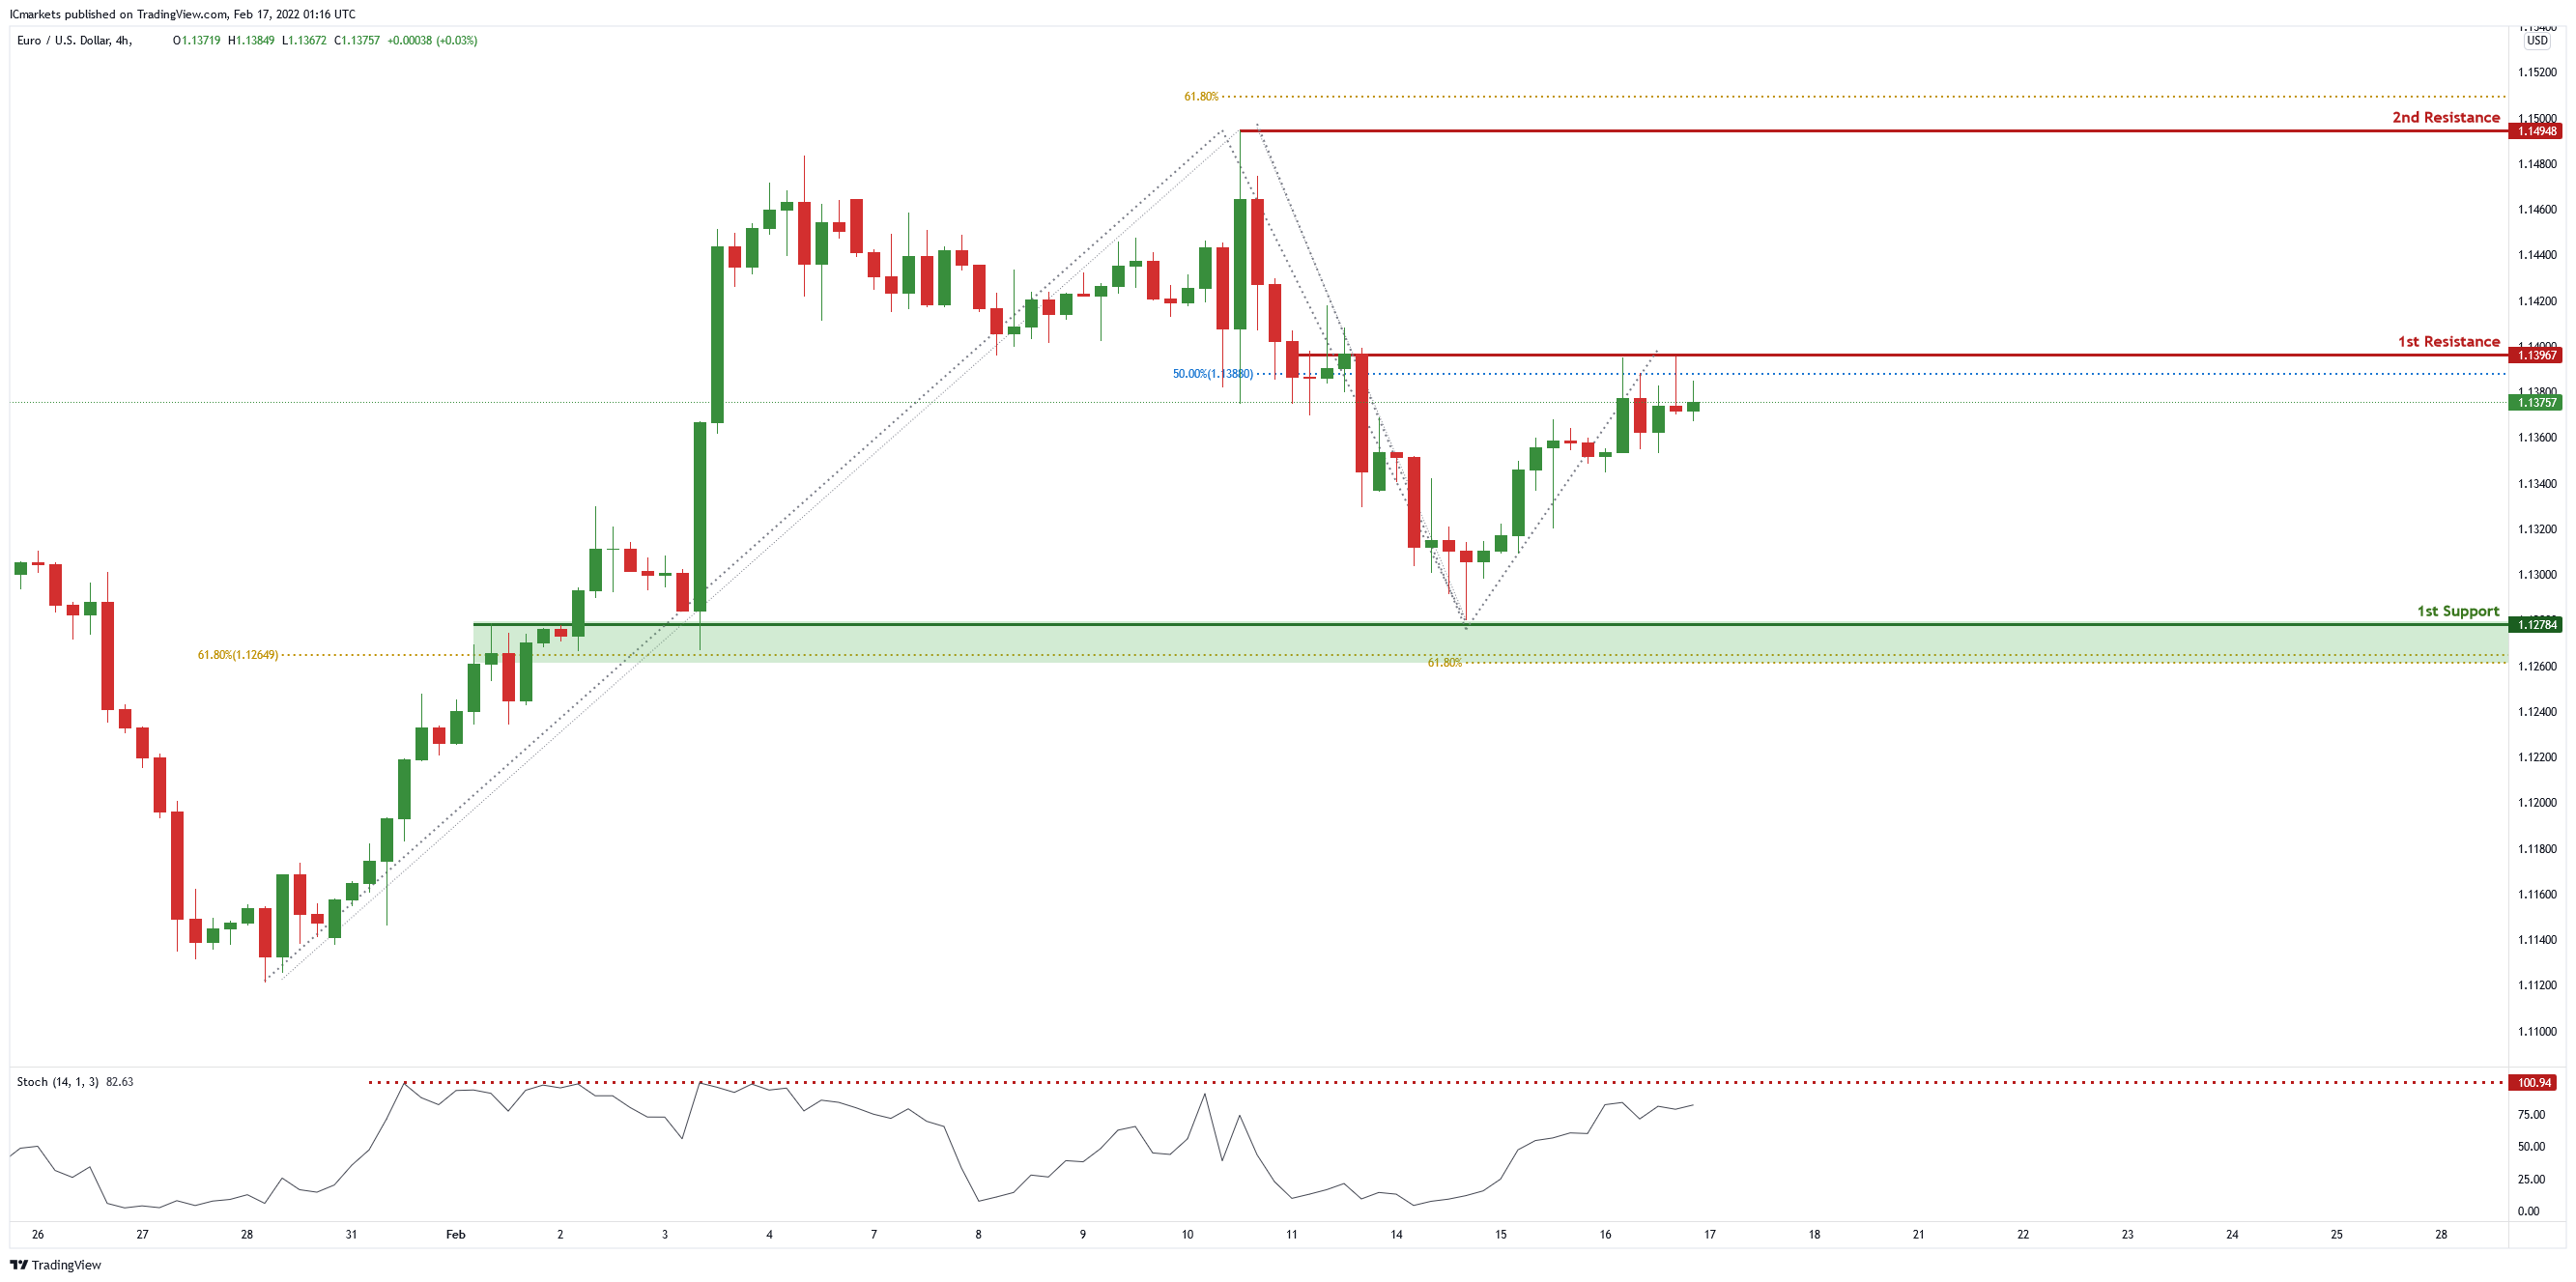
EUR/USD :
On the H4 chart, price is near 1st resistance level of 1.13967 in line with 50% Fibonacci retracement. Price can potentially dip to the 1st support level of 1.12784 in line with 61.8% Fibonacci retracement and 61.8% Fibonacci projection. Our bearish bias is supported by the stochastic indicator as it is near the resistance level.
Areas of consideration
- H4 1st resistance at 1.13967
- H4 1st support at 1.12784
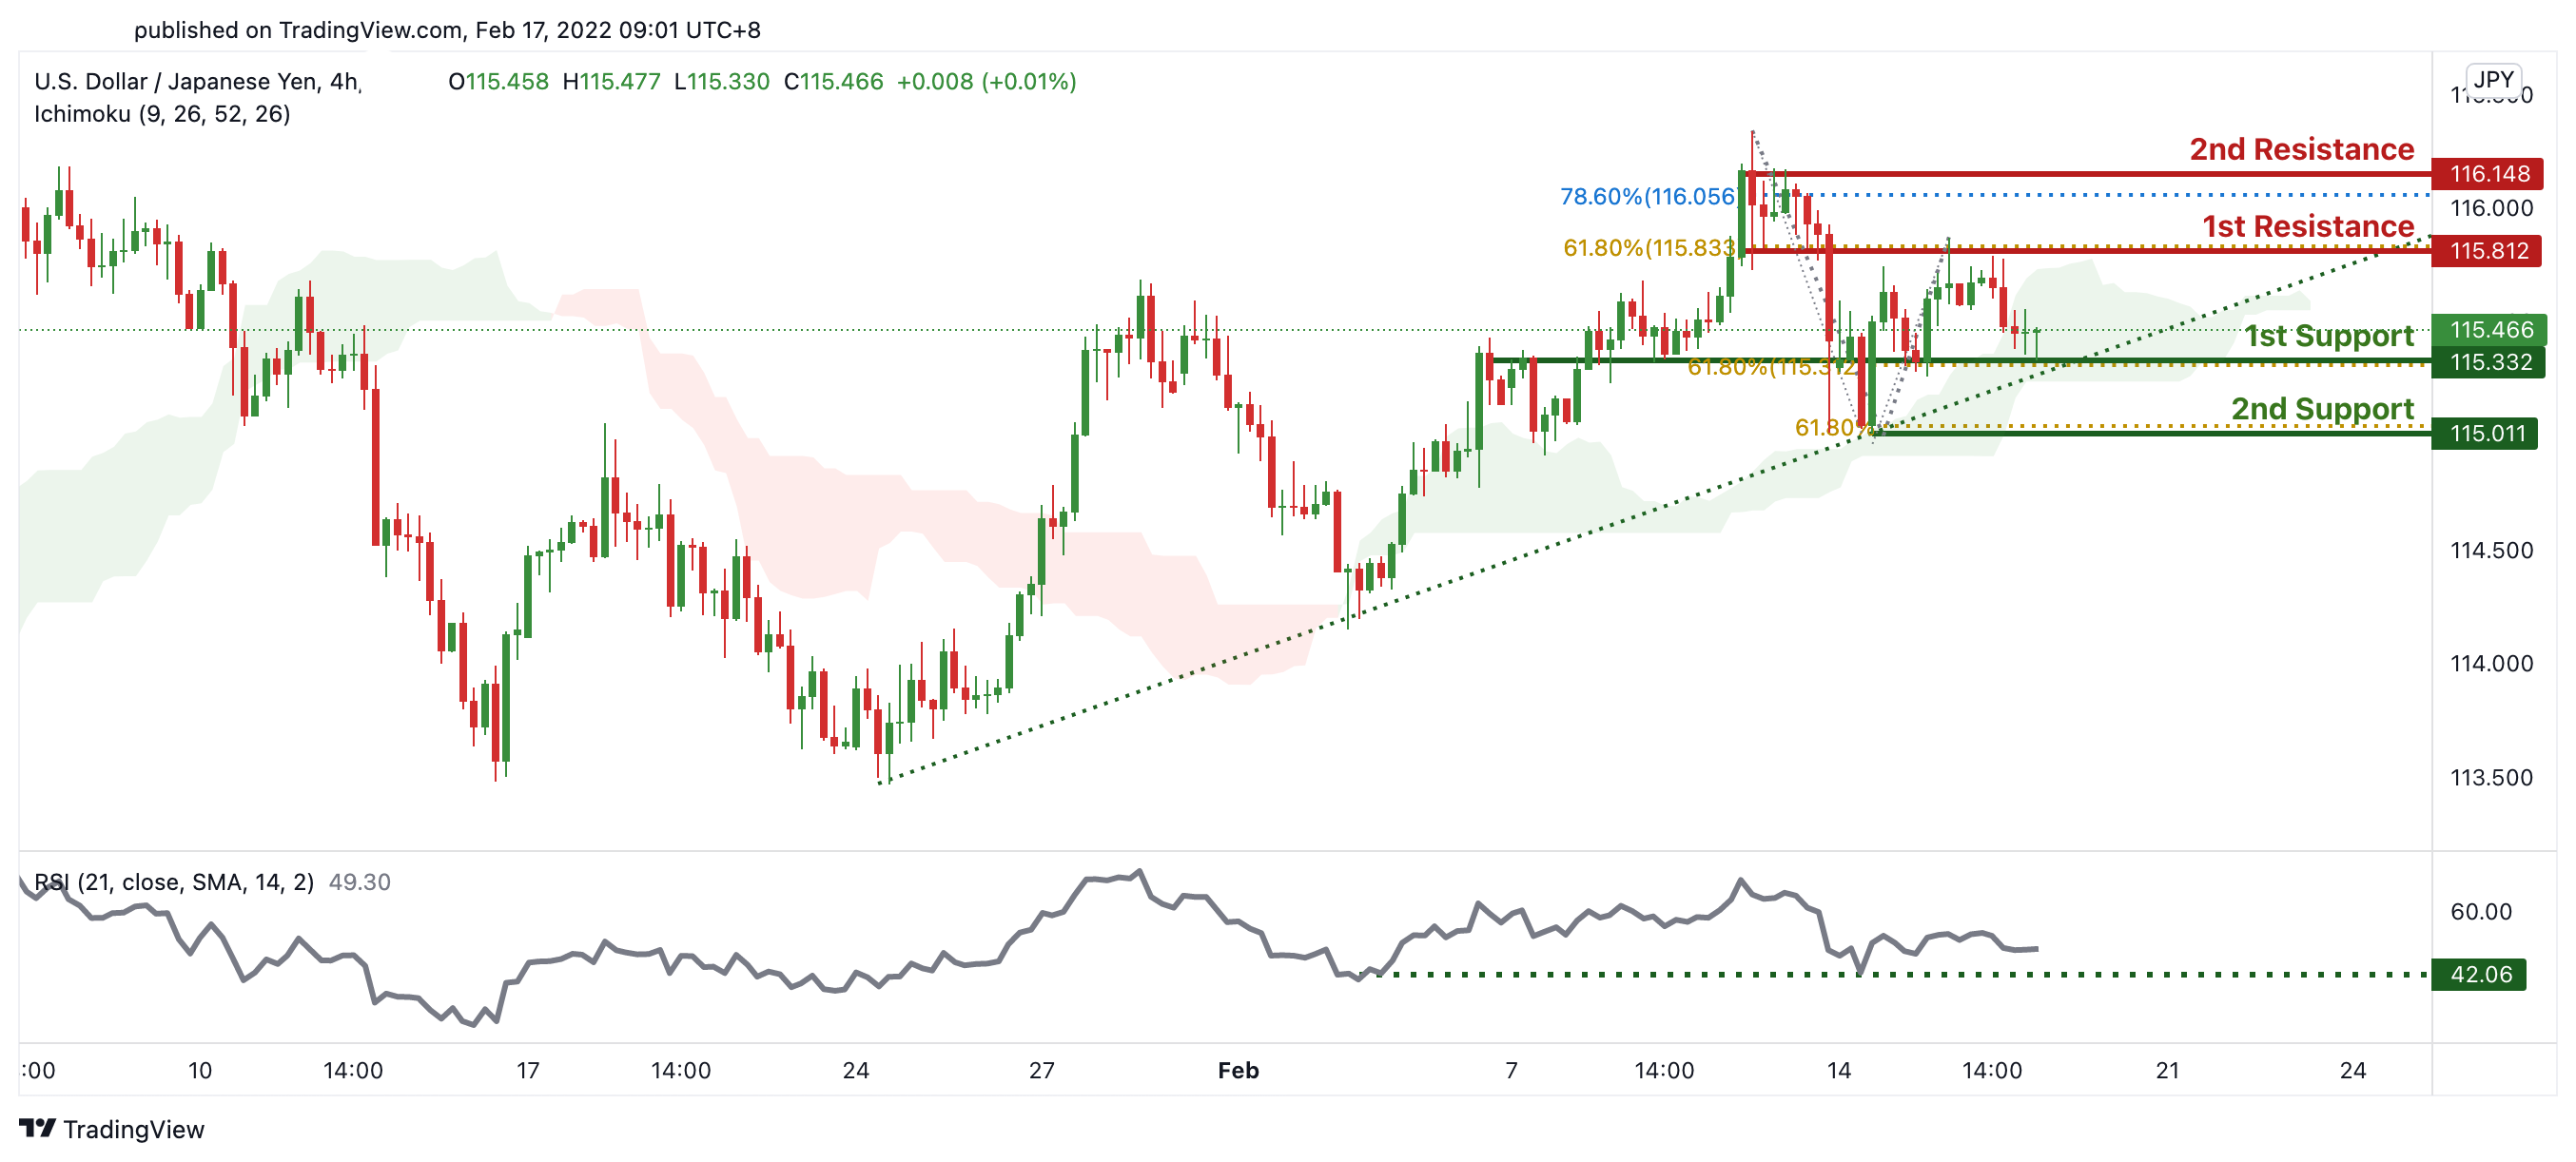
USD/JPY:
On the H4 chart, price is abiding to the ascending trendline support signifying an overall bullish momentum. We can expect price to bounce at 115.332 in line with 61.8% Fibonacci extension towards our 1st resistance at 115.812 in line with 61.8% Fibonacci retracement and 78.6% Fibonacci retracement. Our bullish bias is further supported by the Ichimoku cloud acting as a support and RSI at levels where bounces previously occurred.
Areas of consideration:
- H4 1st support at 115.332
- H4 1st resistance at 115.812
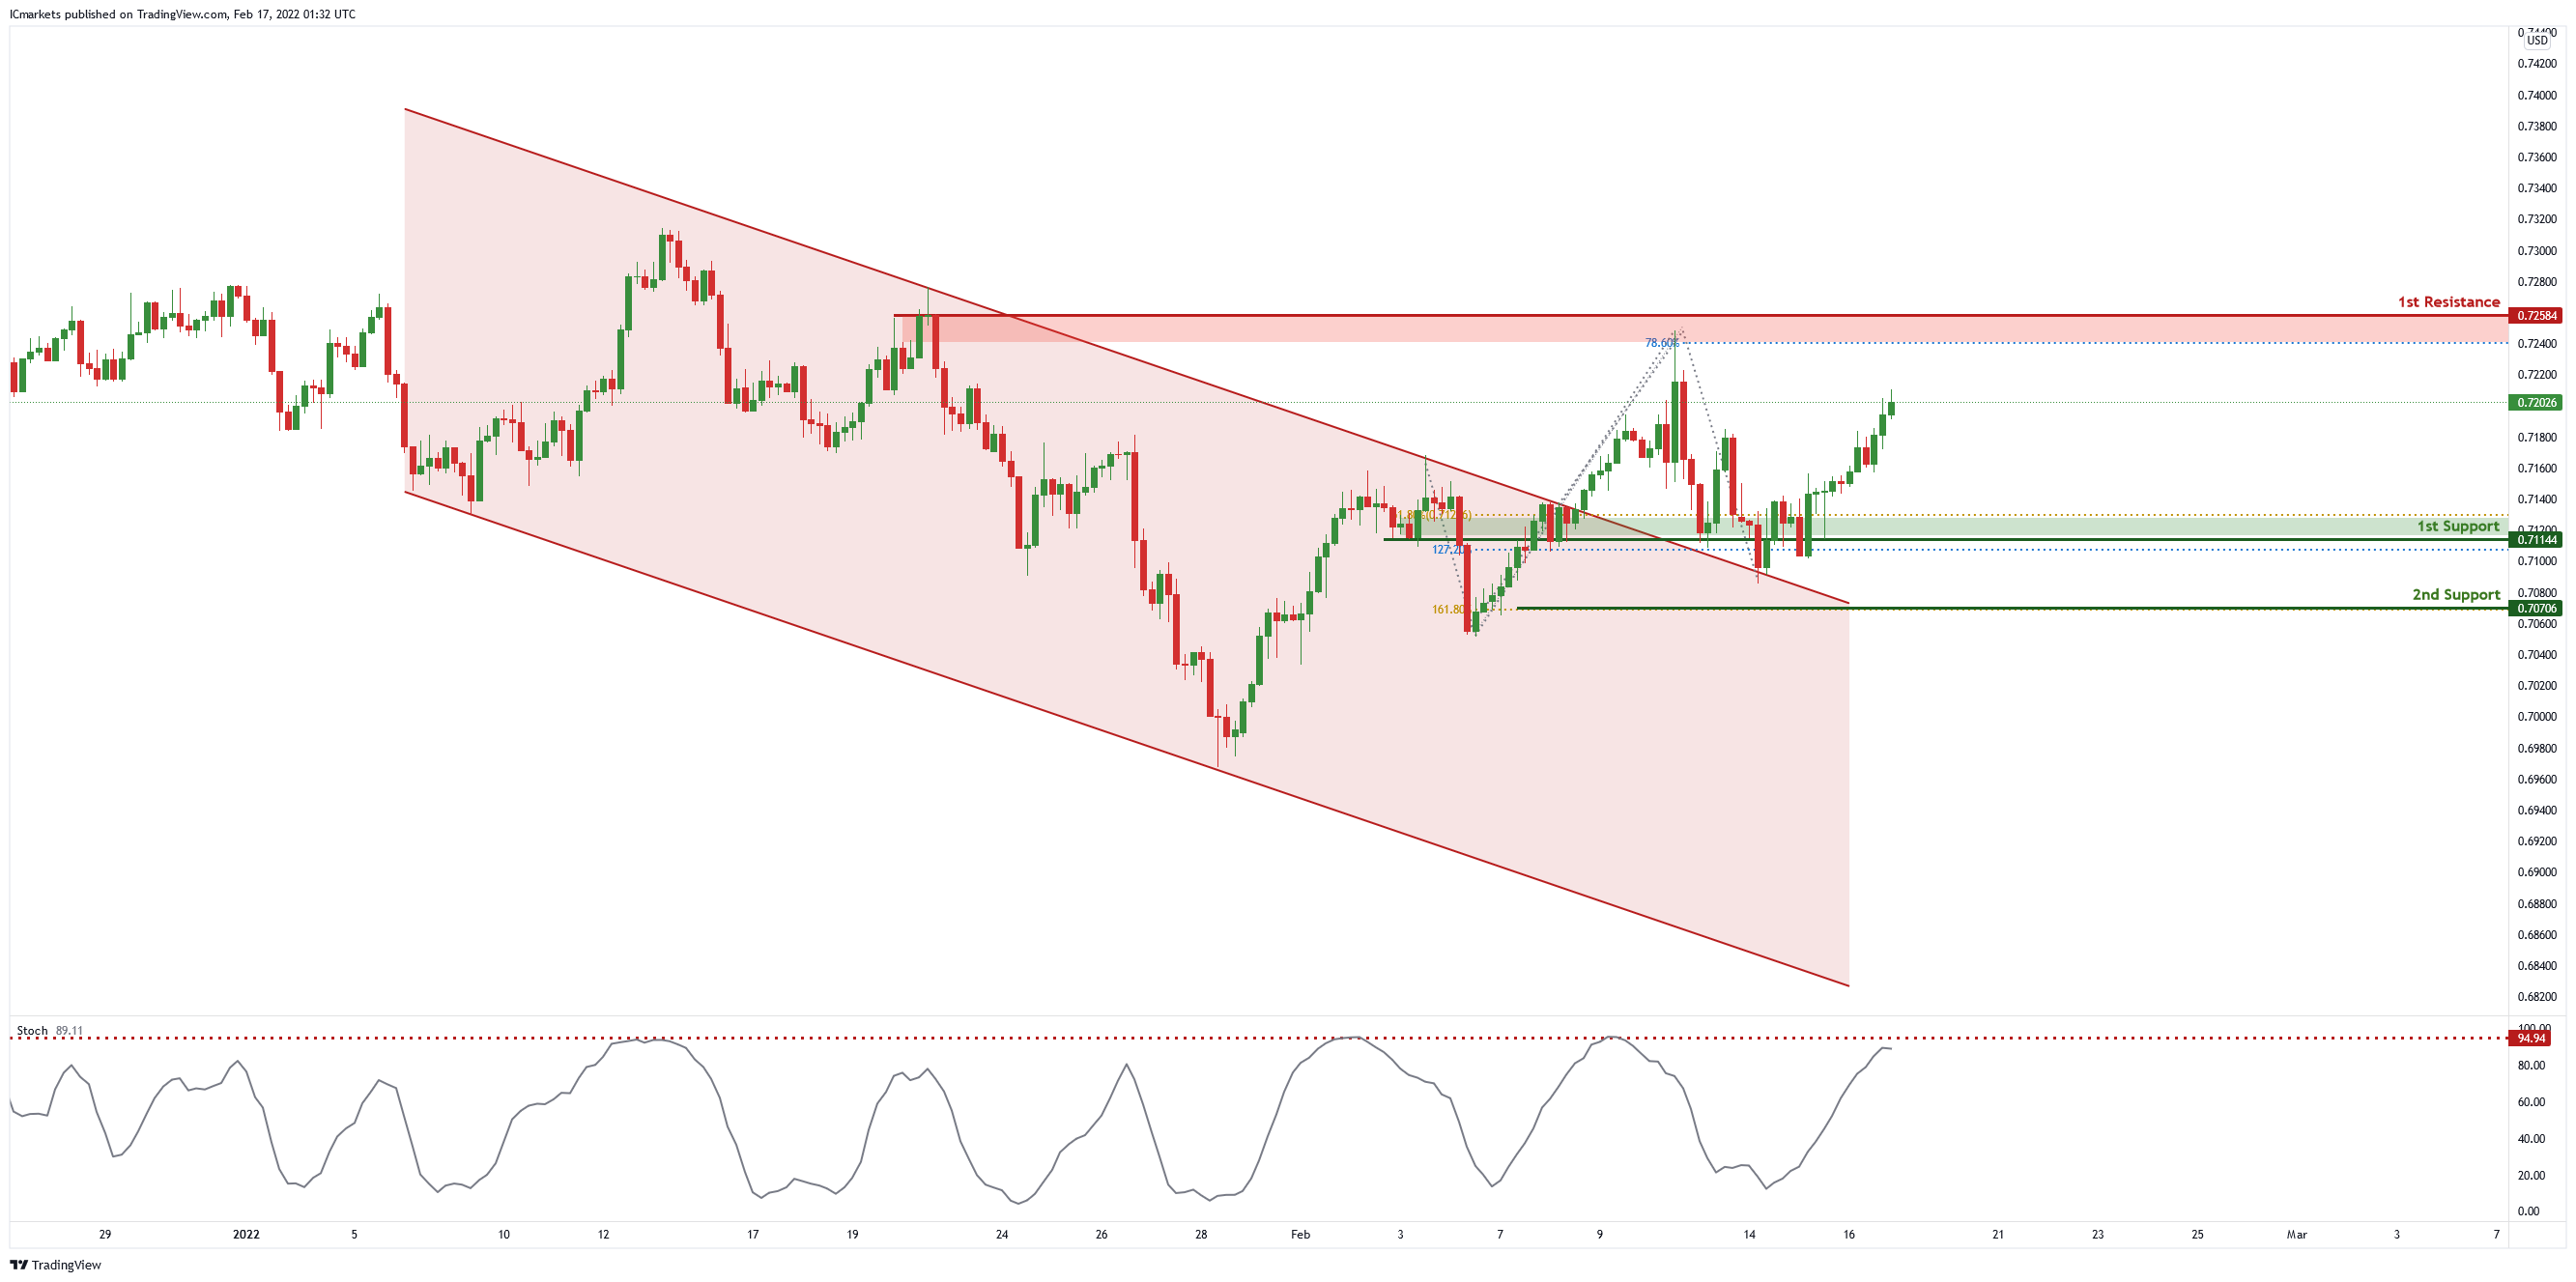
AUD/USD:
Price broke out of the descending channel. Price is near the 1st resistance level of 0.72584 in line with 78.6% Fibonacci projection. Price can potentially dip to the 1st support level of 0.71144 in line with 127.2% Fibonacci projection and 61.8% Fibonacci retracement. Our bearish bias is supported by the stochastic indicator as it is near resistance level.
Areas of consideration :
- H4 1st resistance of 0.72584
- H4 1st support of 0.71144
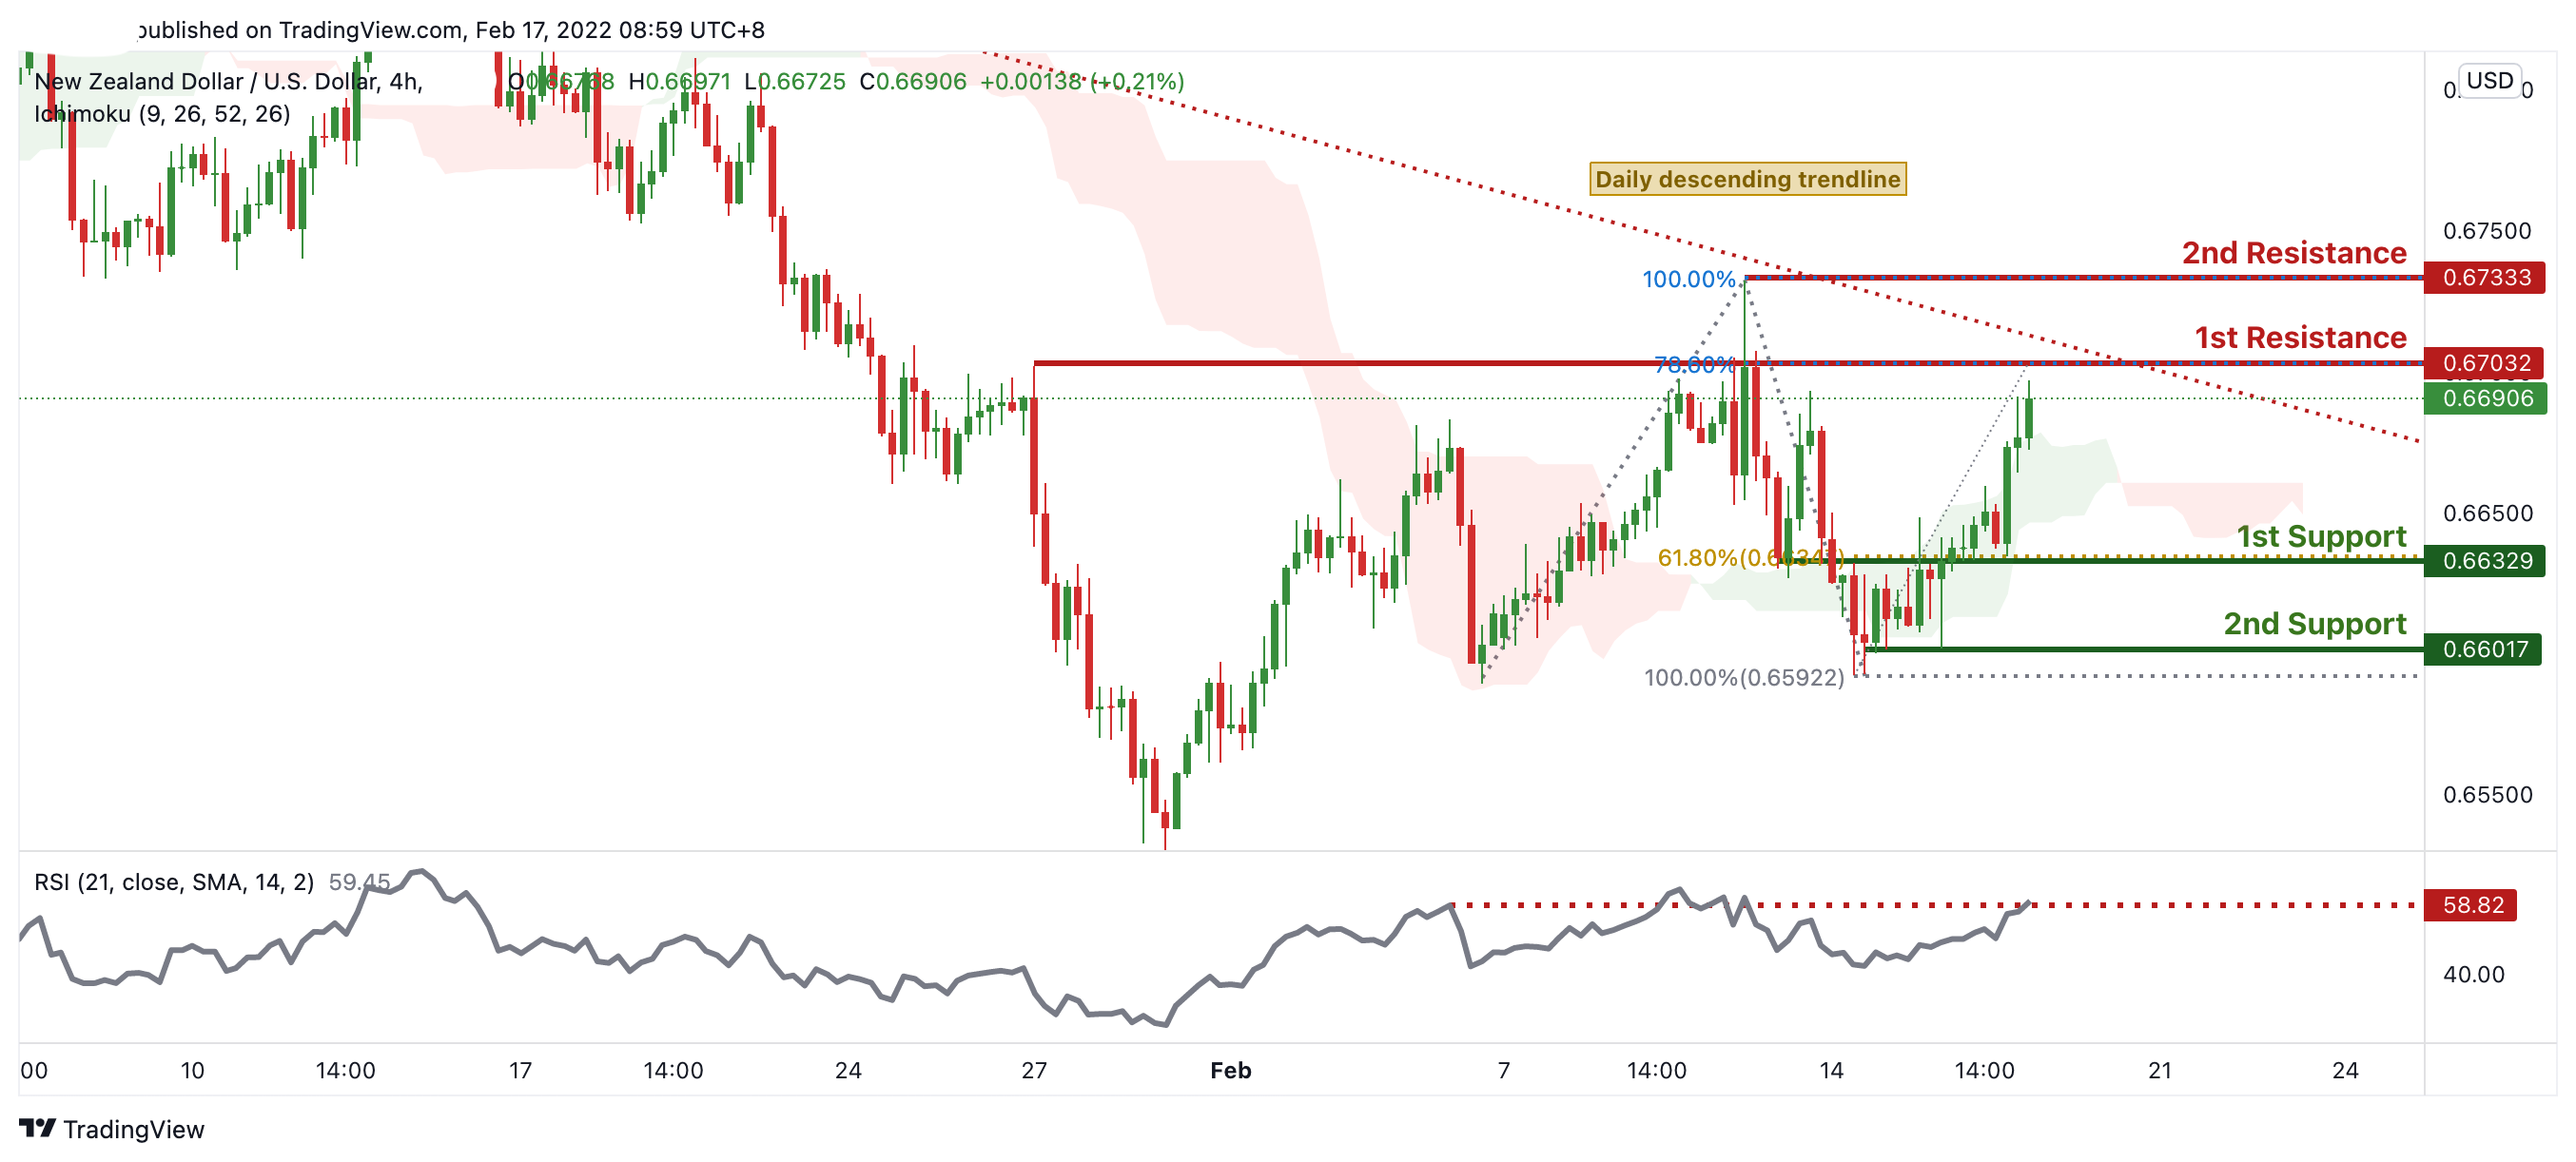
NZD/USD:
On the H4 timeframe, prices are on bearish momentum and abiding to a descending trendline. We see potential for bearish momentum from our 1st resistance at 0.67032 in line with 78.6% Fibonacci extension towards our 1st support at 0.66329 in line with 61.8% Fibonacci retracement. Our bias is further supported by RSI being at levels where dips previously occurred and also ichimoku cloud forecasting bearish momentum . Alternatively, our stop loss will be placed at 2nd resistance at 0.67333 in line 100% Fibonacci extension.
Areas of consideration:
- H4 time frame, 1st resistance at 0.67032
- H4 time frame, 1st support at 0.66329
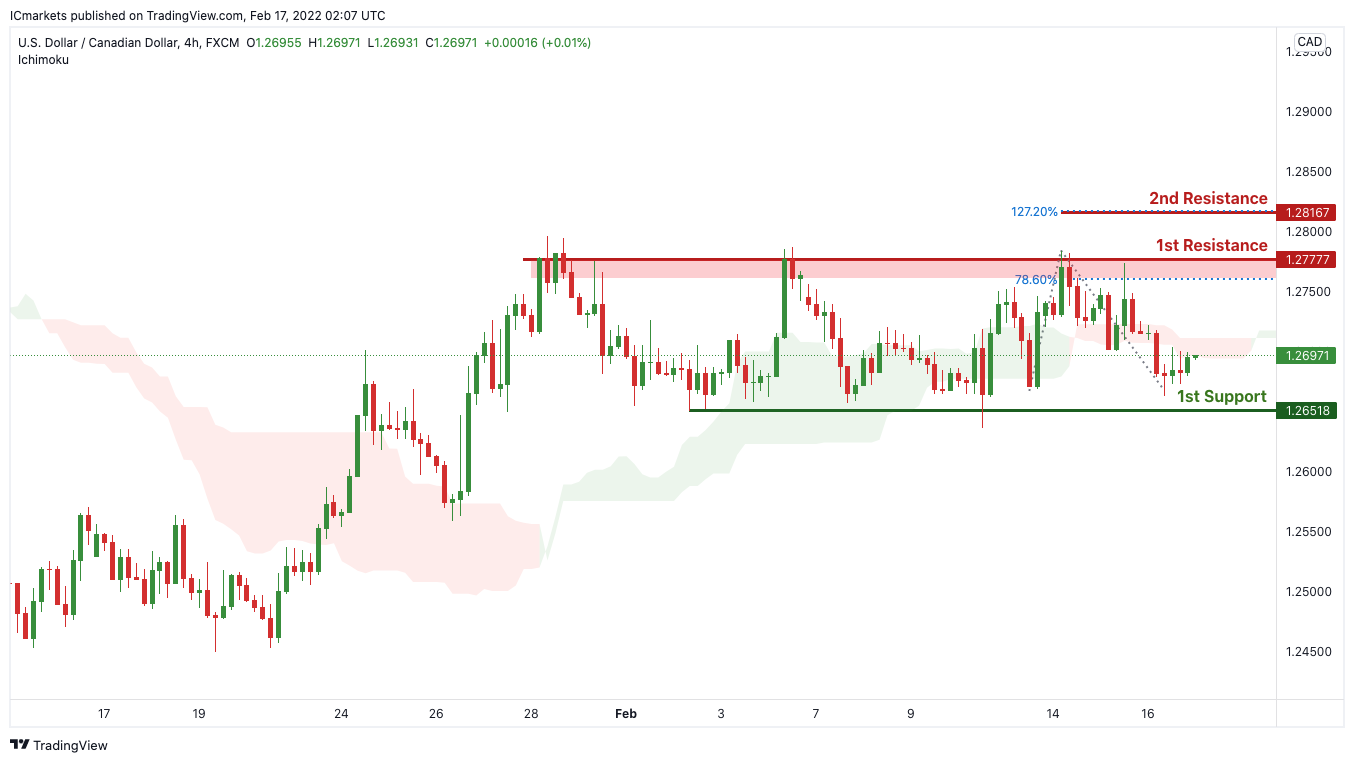
USD/CAD:
On the H4, with price moving below the ichimoku cloud, we can expect price to drop from our 1st resistance at 1.277777 in line horizontal graphical swing high resistance to our 1st support in line with horizontal overlap support and 78.6% Fibonacci retracement at 1.26518. Alternatively, price may break 1st resistance structure and head for 2nd resistance, which coincides with horizontal swing high resistance at 1.28167.
Areas of consideration:
- H4 time frame, 1st support at 1.26518
- H4 time frame, 1st resistance at 1.277777
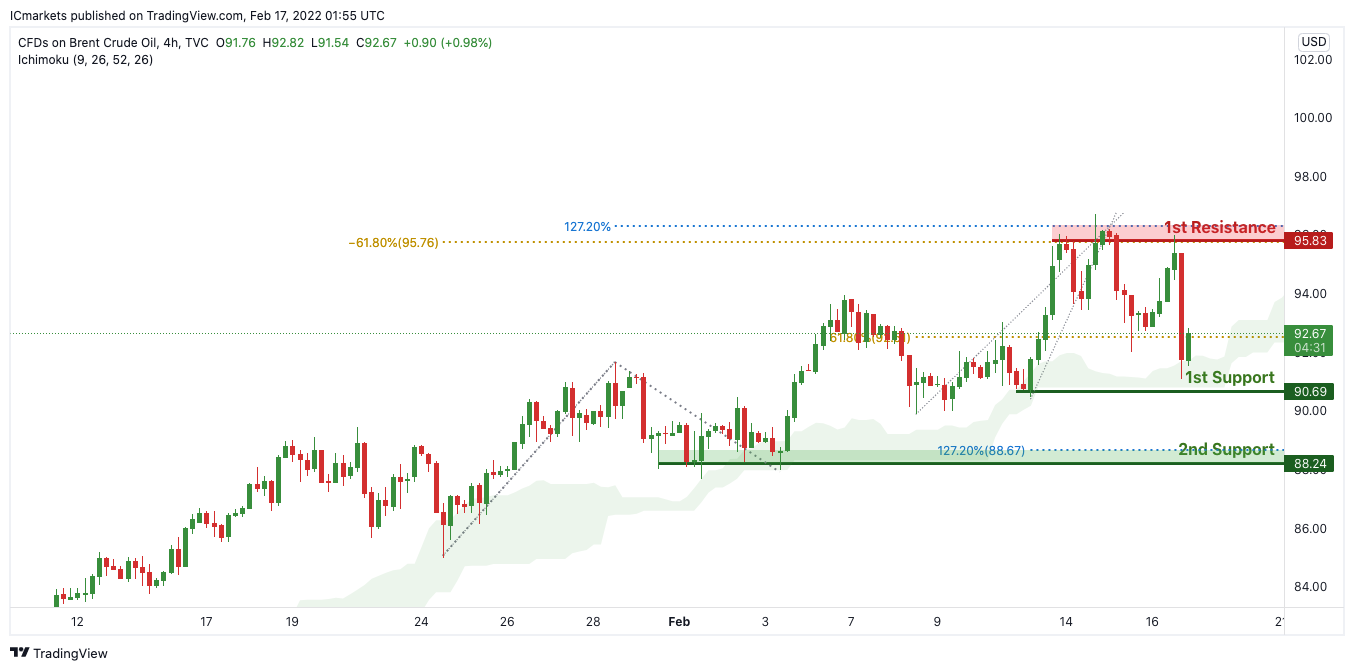
OIL:
On the H4, with price expected to bounce off the support of the ichimoku cloud, signifying an overall bullish momentum. We can expect price to rise to our 1st resistance at 95.83 in line horizontal graphical swing high resistance and -61.8% Fibonacci expansion and 127.2% Fibonacci extension level from our 1st support in line with horizontal overlap support and 61.8% Fibonacci retracement at 90.69. Alternatively, price may break 1st support structure and head for 2nd support, which coincides with horizontal swing low support and 127.2% Fibonacci extension at 88.24.
Areas of consideration:
- H4 time frame, 1st resistance of 95.83
- H4 time frame, 1st support of 90.69
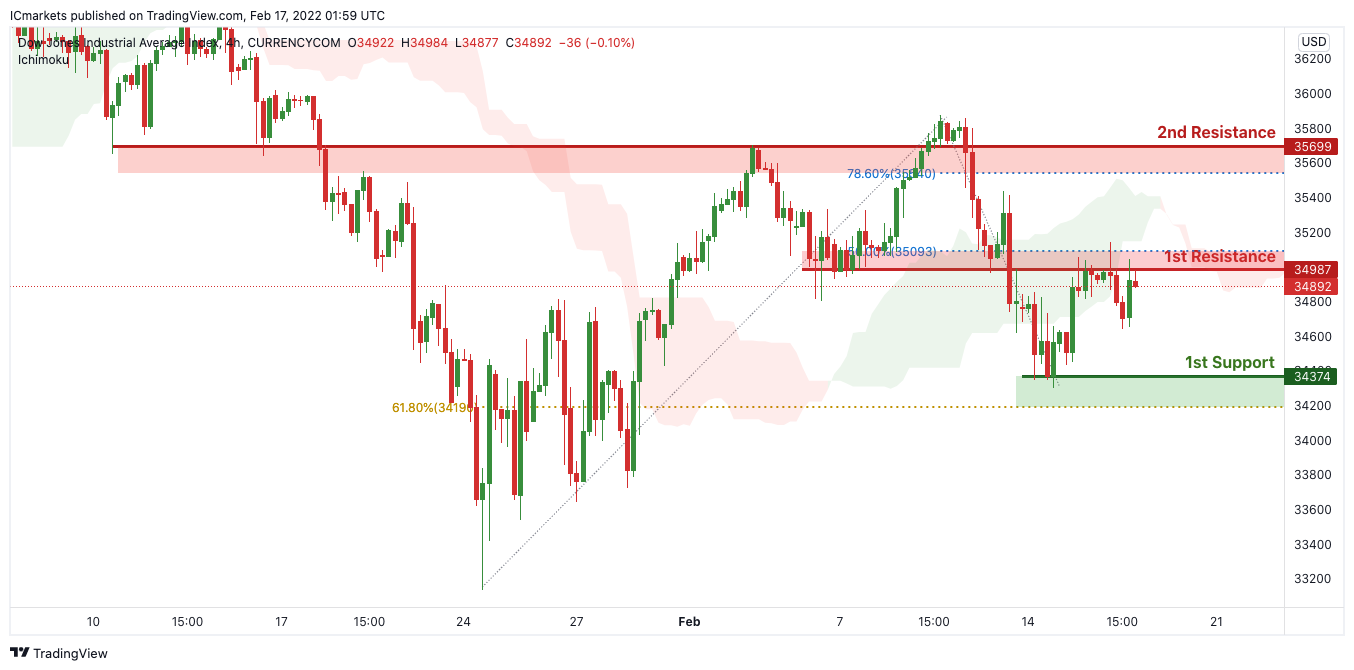
Dow Jones Industrial Average:
On the H4, with prices moving below the ichimoku cloud, we see the potential for a drop to our 1st support at 34374 in line with horizontal swing low support from our 1st resistance at 34987 in line with the 50% Fibonacci retracement. Alternatively, price may break 1st resistance structure and head for 2nd resistance at 35699, in line with the horizontal overlap resistance and 78.6% Fibonacci retracement.
Areas of consideration:
- H4 time frame, 1st resistance of 34987
- H4 time frame, 1st support of 34374
The accuracy, completeness and timeliness of the information contained on this site cannot be guaranteed. IC Markets does not warranty, guarantee or make any representations, or assume any liability regarding financial results based on the use of the information in the site.
News, views, opinions, recommendations and other information obtained from sources outside of www.icmarkets.com.au, used in this site are believed to be reliable, but we cannot guarantee their accuracy or completeness. All such information is subject to change at any time without notice. IC Markets assumes no responsibility for the content of any linked site.
The fact that such links may exist does not indicate approval or endorsement of any material contained on any linked site. IC Markets is not liable for any harm caused by the transmission, through accessing the services or information on this site, of a computer virus, or other computer code or programming device that might be used to access, delete, damage, disable, disrupt or otherwise impede in any manner, the operation of the site or of any user’s software, hardware, data or property.


