Key risk events today:
ECB Main Refinancing Rate, Monetary Policy Statement and Press Conference; US CPI m/m; US Unemployment Claims.
(Previous analysis as well as outside sources – italics).
EUR/USD:
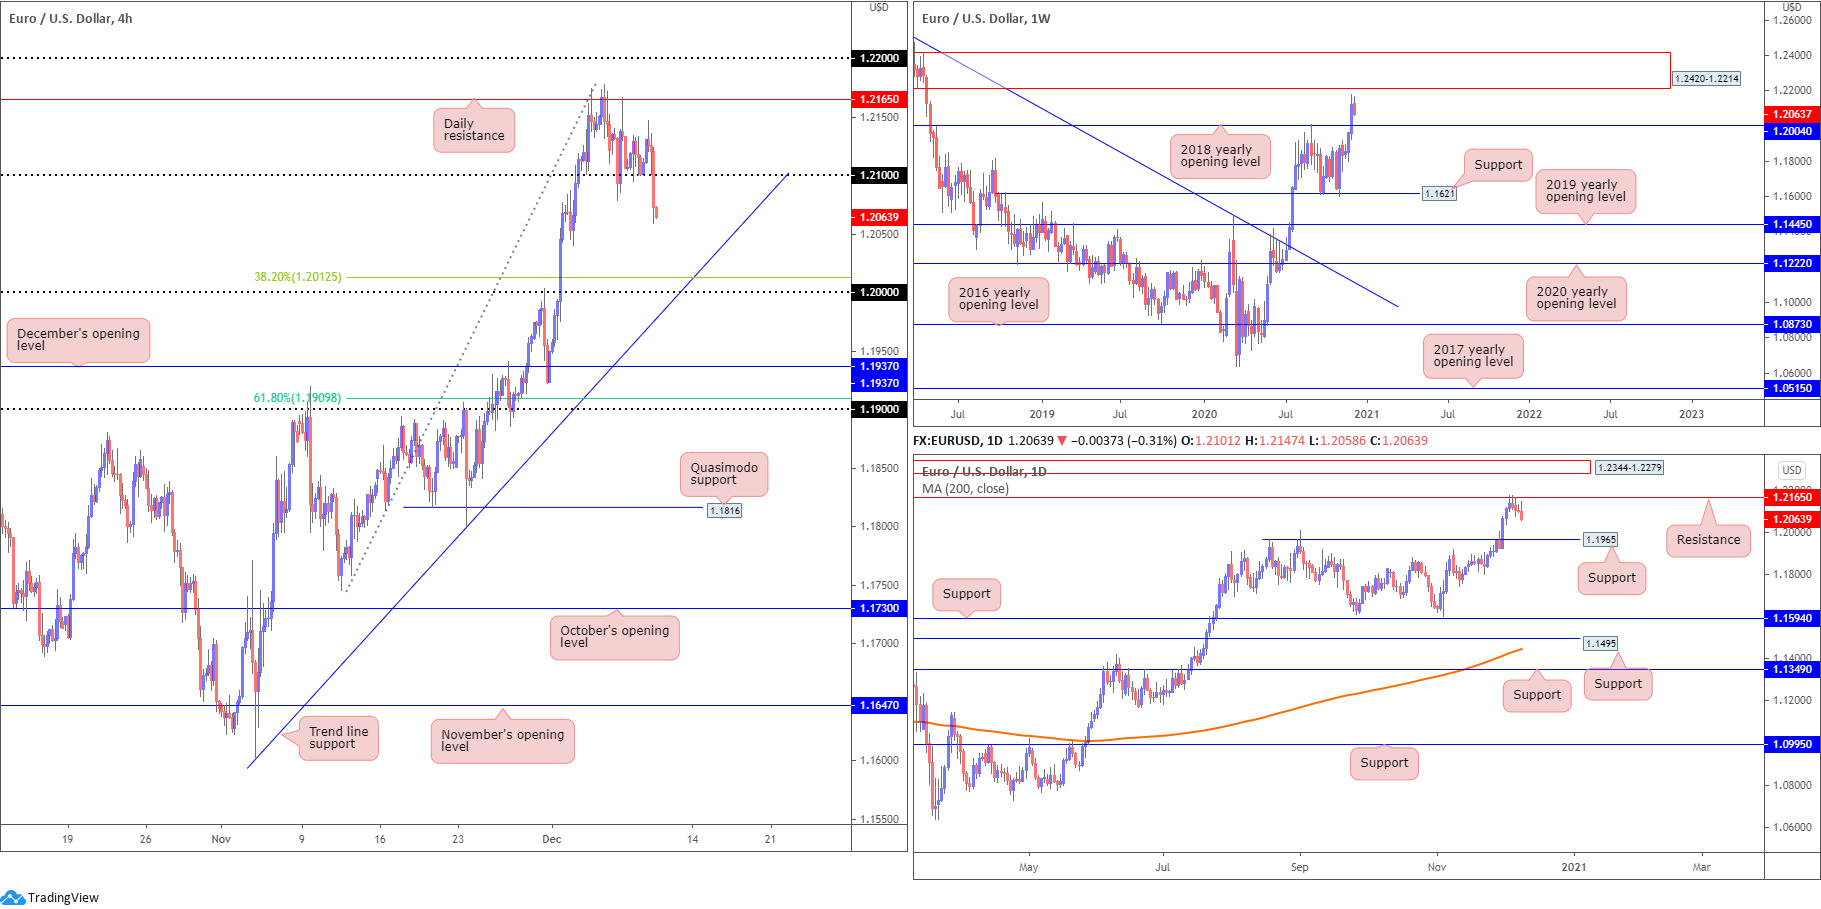
As the US dollar index climbed 91.00 amidst a deterioration in risk sentiment Wednesday, EUR/USD overthrew the 1.21 handle on the H4. With 1.21 now likely to serve as psychological resistance, along with the lack of obvious support present on the H4 chart, we could see the pair continue to weaken until reaching the key figure 1.20. This is an area of confluence many traders are likely monitoring, having seen the psychological level converge with a 38.2% Fibonacci retracement ratio at 1.2012 and a trend line support, extended from the low 1.1602.
Further out on the bigger picture, weekly flow is seen paring last week’s 150-pip advance ahead of supply at 1.2420-1.2214, threatening a retest of the 2018 yearly opening value at 1.2004. In terms of trend, it seems upside remains favoured, more so if price overthrows the 1.2555 February 12 high (2018).
On the daily timeframe, nonetheless, resistance at 1.2165 made an appearance into the second half of last week, with room for the unit to push as far south as support coming in at 1.1965, a prior Quasimodo resistance level.
Areas of consideration:
- The uptrend remains in a healthy state, seen clearly from both the weekly and daily timeframes.
- A lack of clear support on all three timeframes suggests buy-side liquidity could be weak going forward, therefore selling opportunities may be present, targeting the 1.20ish area.
- 20 is potentially key support. Not only is the round number joined by a 38.2% Fib and a H4 trend line support, weekly support is also seen at 1.2004, the 2018 yearly opening value.
GBP/USD:
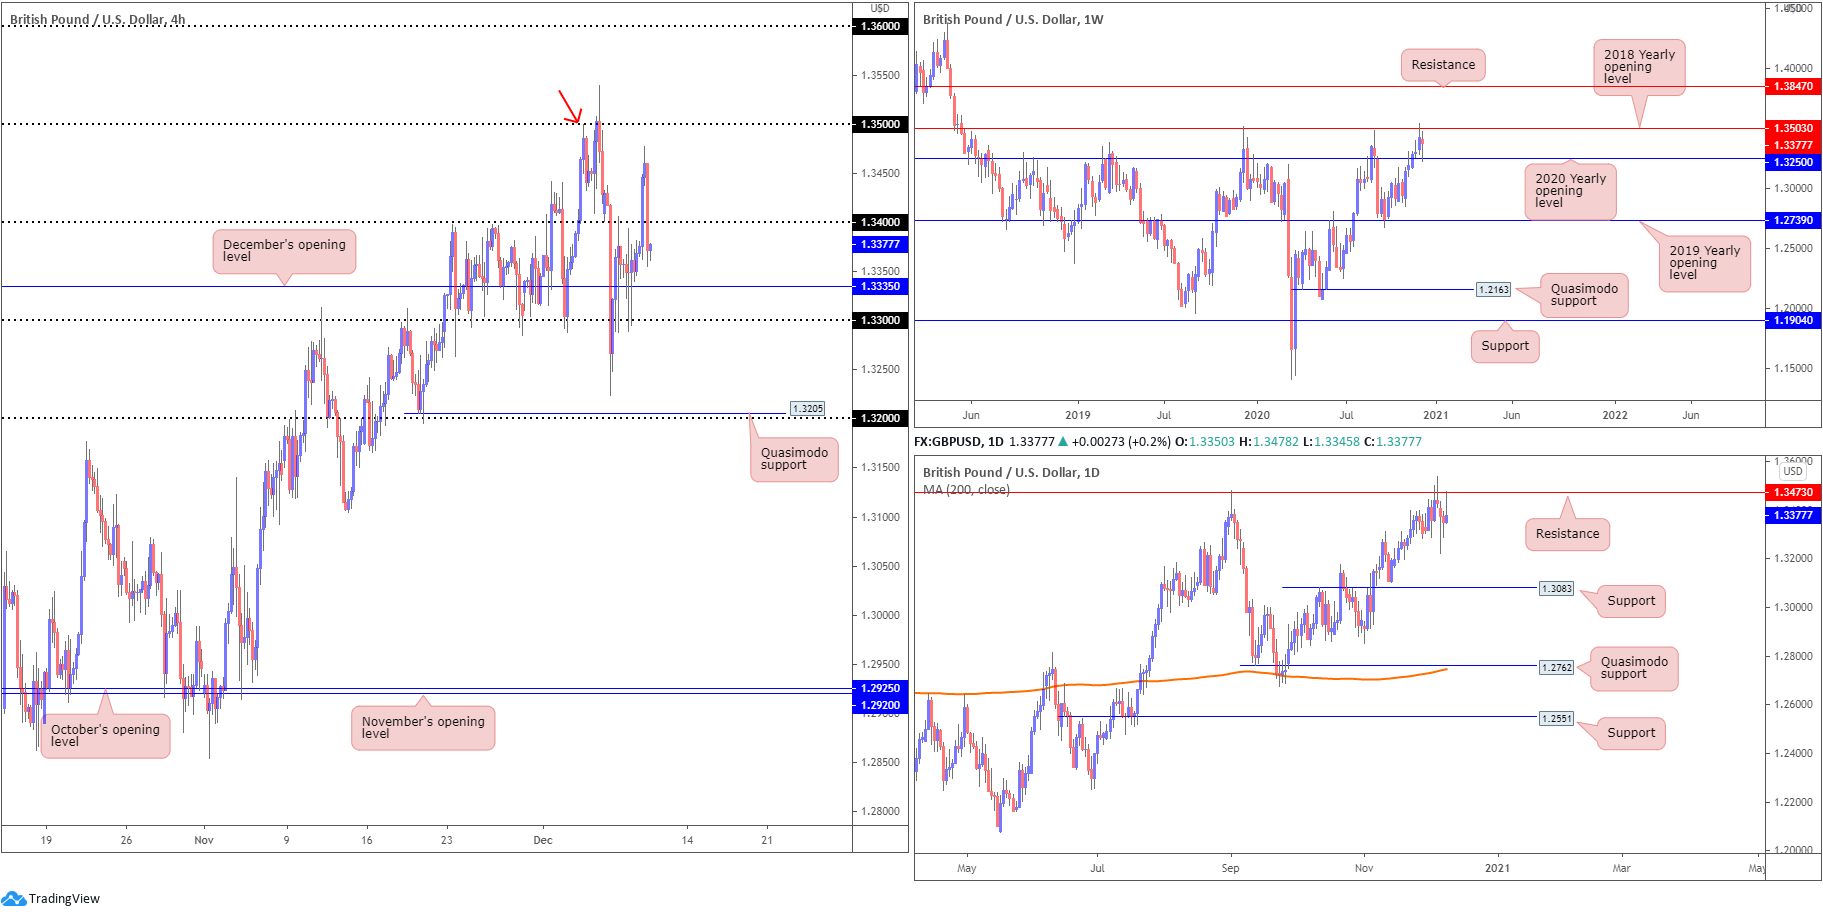
With Brexit talks set to continue, sterling swiftly reclaimed 1.34 to the downside in recent hours. Leaving the 1.35 handle on the H4 unchallenged (and merging Quasimodo resistance [red arrow]), daily resistance at 1.3473 stepped in and capped upside. H4 support can be found in the form of December’s opening value placed at 1.3335, closely followed by the 1.33 handle.
Recent movement has daily price trading off session peaks, with the current candle poised to form a shooting star pattern, a bearish candlestick signal. Interestingly, we can see a lack of daily support until reaching the 1.3083 region.
Higher up on the curve, however, the weekly timeframe is seen balancing off support derived from the 2020 yearly opening value at 1.3250, though faces resistance at 1.3503, the 2018 yearly opening value. Similar to EUR/USD, GBP/USD also managed to eke out fresh YTD highs last week, with the immediate trend pulling to the upside since March troughs at 1.1409.
Areas of consideration:
- 34 remains a resistance to be aware of, and could play a key role today should daily price close in the form of a shooting star pattern, a move that could entice sellers.
- The 1.35 region remains interesting resistance, merging closely with H4 Quasimodo resistance, weekly resistance at 1.3503 and daily resistance found at 1.3473.
- The trend remains to the upside, therefore a close forming north of 1.35 could also activate breakout bullish scenarios, targeting at least 1.36.
AUD/USD:
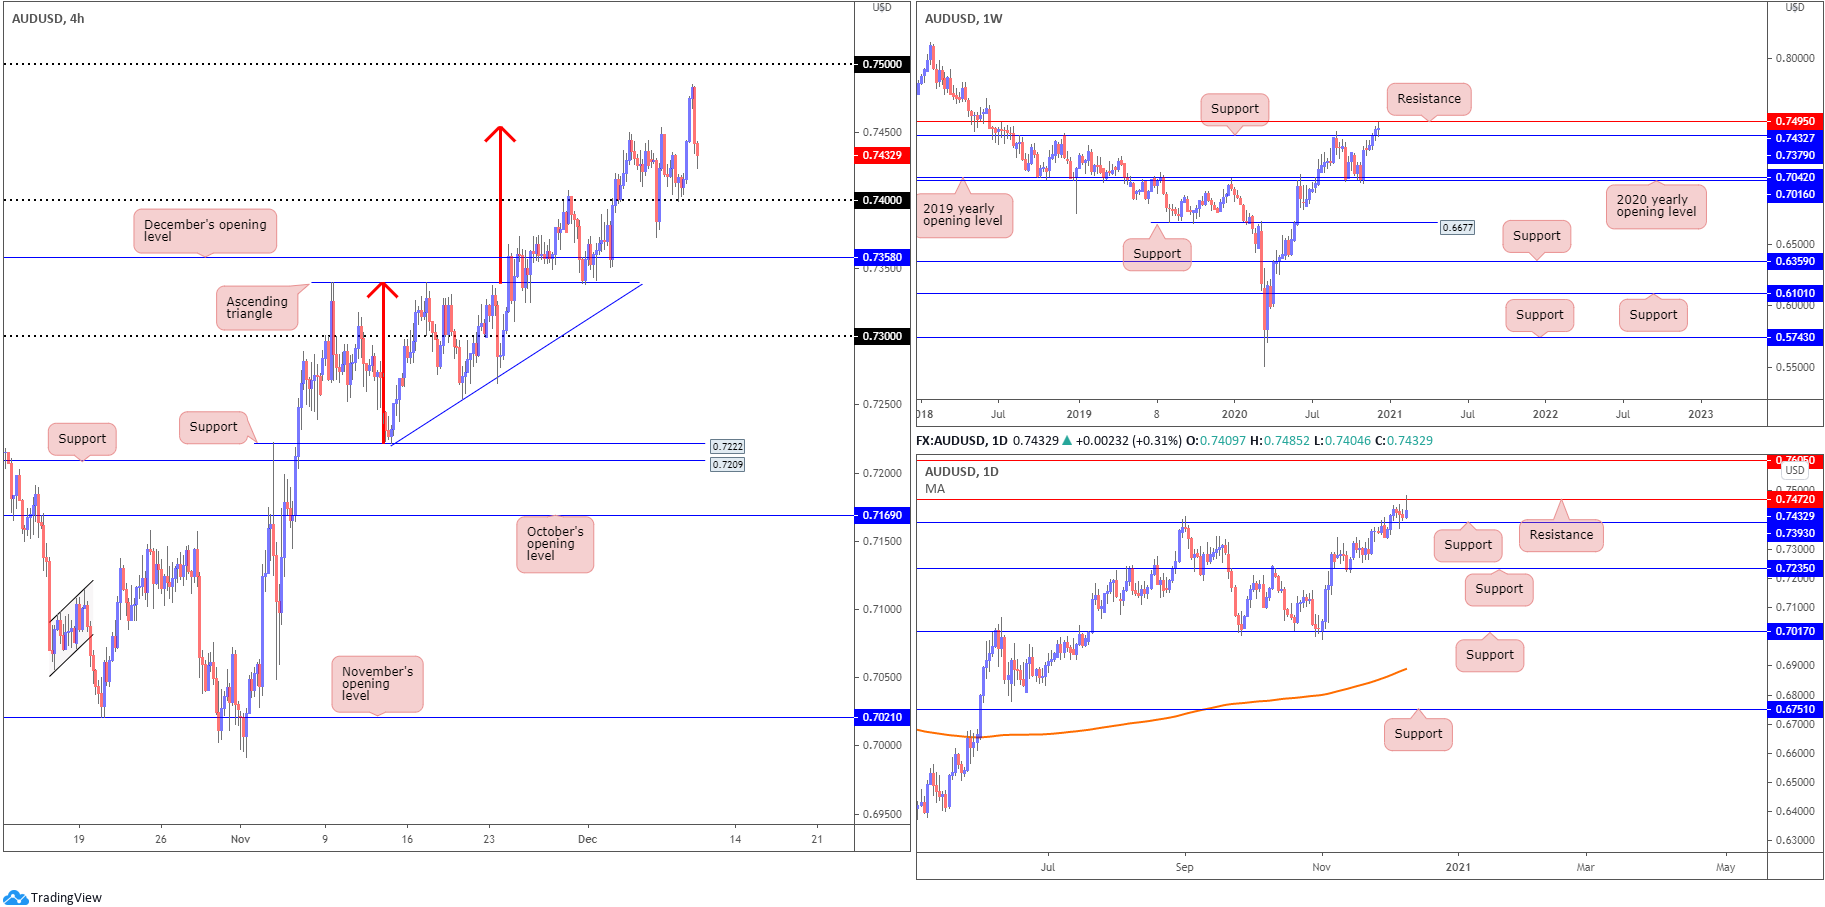
Fuelled on the back of risk aversion and the US dollar index reclaiming 91.00+ status, AUD/USD bulls were on the ropes during US trading Wednesday. Unable to test the 0.75 handle on the H4 scale, it appears, technically speaking, buying pressure could not overpower sell-side liquidity at daily resistance from 0.7472. Traders may also wish to acknowledge that just south of the round number 0.75, we also have weekly resistance plotted at 0.7495.
Lower, H4 support is seen at the 0.74 region, with a break exposing December’s opening value priced in at 0.7358. Higher timeframe supports can also be found at 0.7379 (weekly) and 0.7393 (daily).
Areas of consideration:
- 74 is an interesting barrier, converging with daily support at 0.7393.
- December’s opening value on the H4 at 0.7358 also could potentially spark interest should it enter view, having seen the level plotted just beneath weekly support at 0.7379.
USD/JPY:
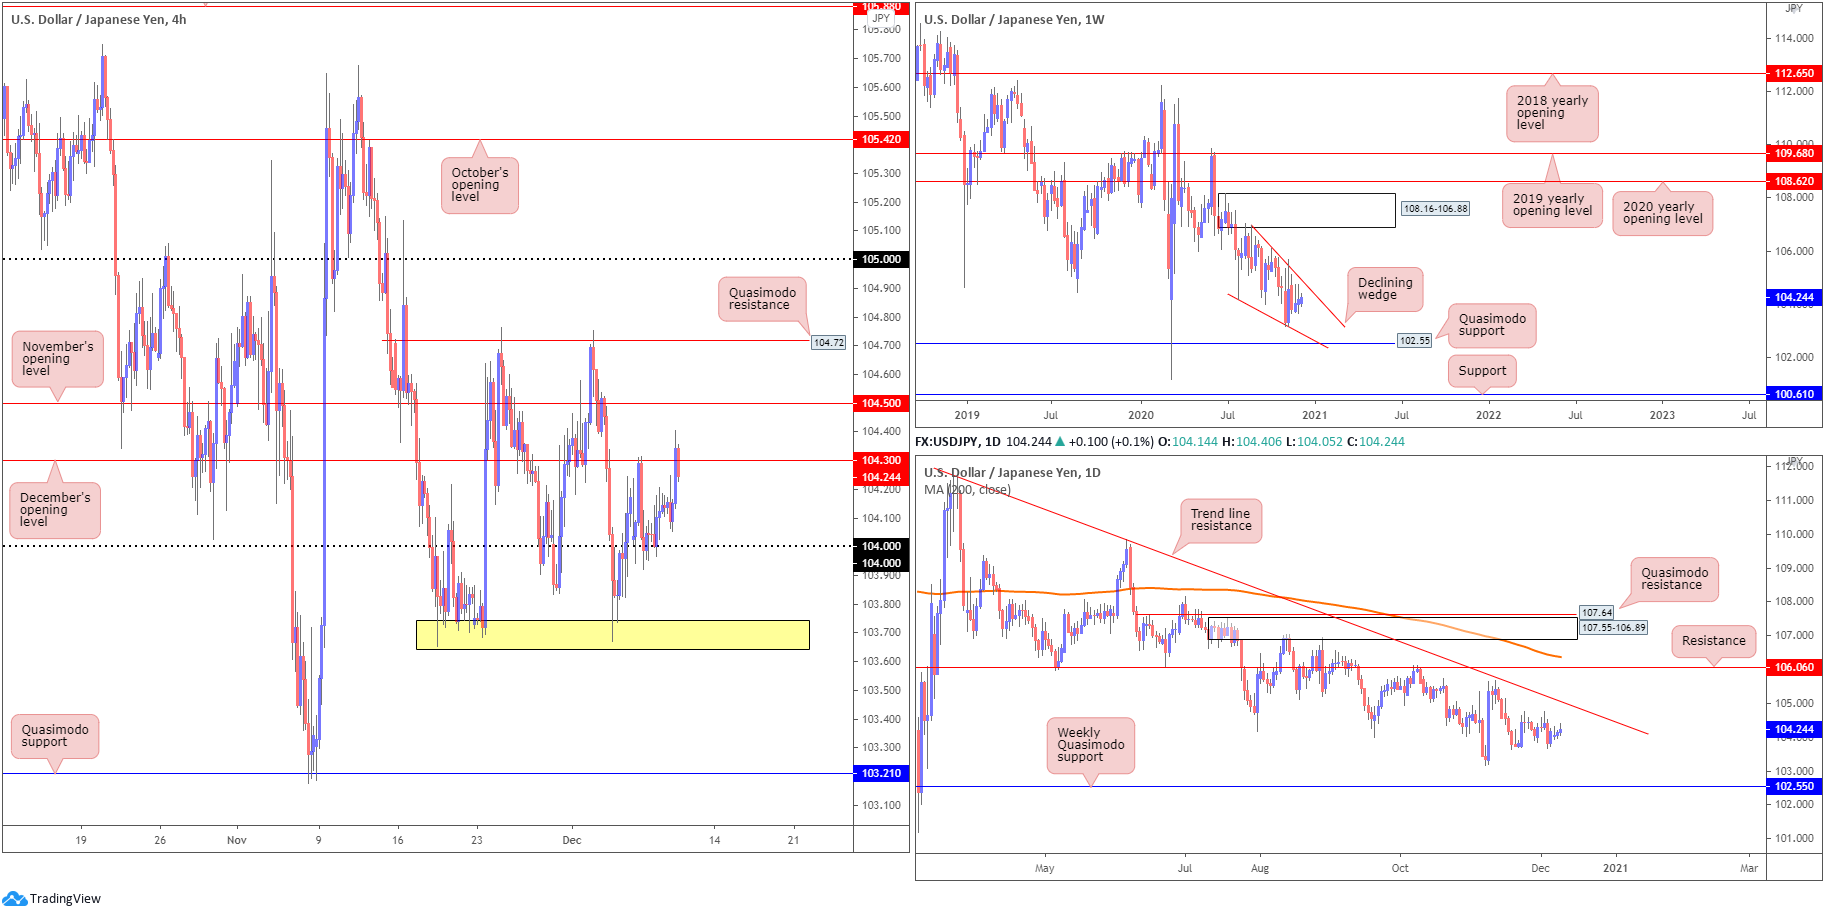
It was another somewhat muted session for USD/JPY Wednesday, concluding off session peaks at 104.40.
The technical frame remains unchanged on the weekly timeframe (italics):
Since connecting with the underside of weekly supply at 108.16-106.88 in August, price has gradually shifted lower and developed a weekly declining wedge (106.94/104.18). Weekly Quasimodo support at 102.55 is also in the picture, with a break revealing support plotted at 100.61. A strong bounce from 102.55, however, may provide enough impetus for buyers to attempt a breakout above the current declining wedge.
Daily action also remains at a standstill (italics):
The technical landscape from the daily timeframe reveals scope to close in on trend line resistance, extended from the high 111.71. Sellers taking over, nevertheless, could lead price to the 103.17 November 6 low, followed by the noted weekly Quasimodo support at 102.55.
December’s opening value at 104.30 on the H4 remains prominent resistance, receiving price action in recent hours. 104 calls to the downside, while breaking higher shines the spotlight on November’s opening value priced in at 104.50 and the Quasimodo resistance at 104.72. The plot of support below 104, around 103.70 (yellow), also remains important.
Areas of consideration:
- Detaching sellers from 104.30 may ignite intraday bullish scenarios to 104.50 and 104.72 on the H4.
- 104 may remain supportive if retested, as could support around 103.70 on the H4 scale.
- Removing H4 support around 103.70 moves H4 Quasimodo support at 103.21 on to the radar as a possible downside objective for intraday bearish scenarios.
USD/CAD:
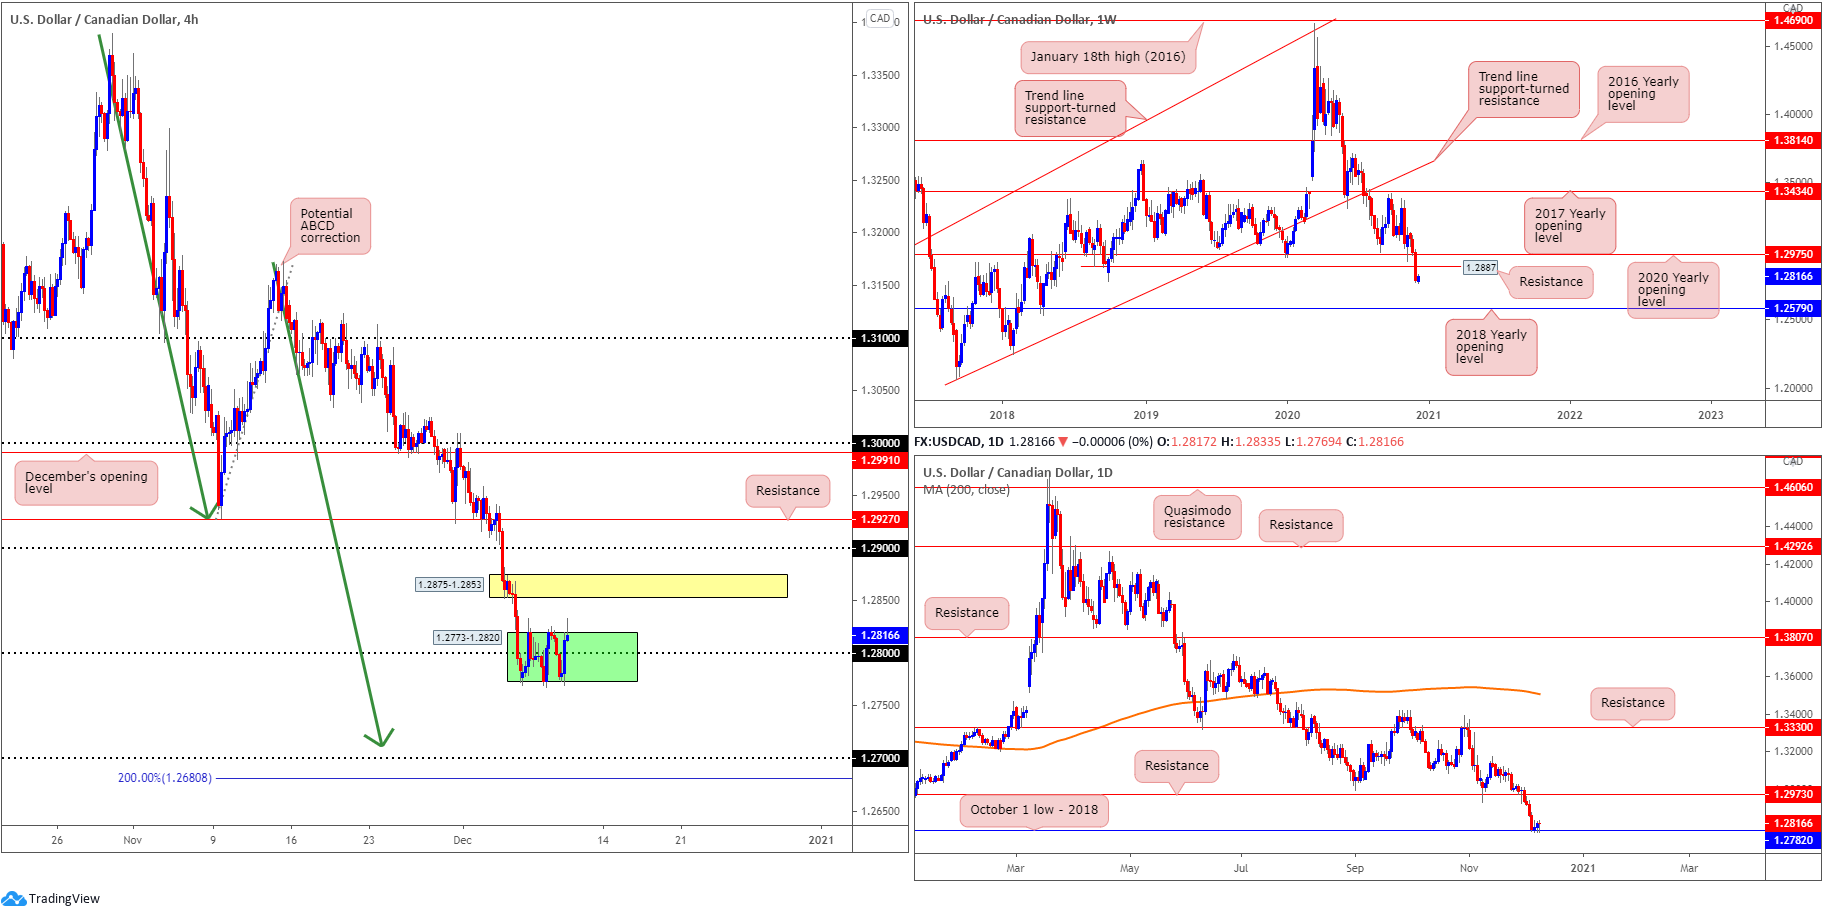
Since the beginning of the week, H4 candles have been busy carving out a consolidation around the 1.28 area between 1.2773-1.2820 (green).
The range has perhaps formed on the back of a combination of things. Last week’s 200-pip depreciation has likely caused a bout of profit-taking, particularly off daily support at 1.2782, October’s low, 2018. However, sellers are unlikely to give up without a fight, having seen room to navigate deeper water on the weekly scale after price overthrew the 2020 yearly opening value at 1.2975 and Quasimodo support coming in at 1.2887.
Should H4 remain above 1.28 today, and, assuming bulls overpower any offers residing around Monday’s high 1.2833, supply at 1.2875-1.2853 could make an appearance. Should buyers run out of gas, on the other hand, and decide to cross south of the 1.28 region, 1.27 is in view, a psychological level accompanied by an ABCD correction (green arrows) at 1.2711 and a 2.0 BC projection.
Areas of consideration:
Outlook unchanged.
- Weekly price showing a reasonably free rein to the 2018 yearly opening value at 1.2579 signals H4 buyers could be in trouble. However, assisted by daily support at 1.2782 (October’s low [2018]), buyers may still push for H4 supply at 1.2875-1.2853.
- Conservative buyers, however, may seek a retest at 1.28 before committing.
- Printing a decisive H4 close beneath 1.28 could trigger bearish scenarios, with many H4 players targeting the 1.27 neighbourhood.
USD/CHF:
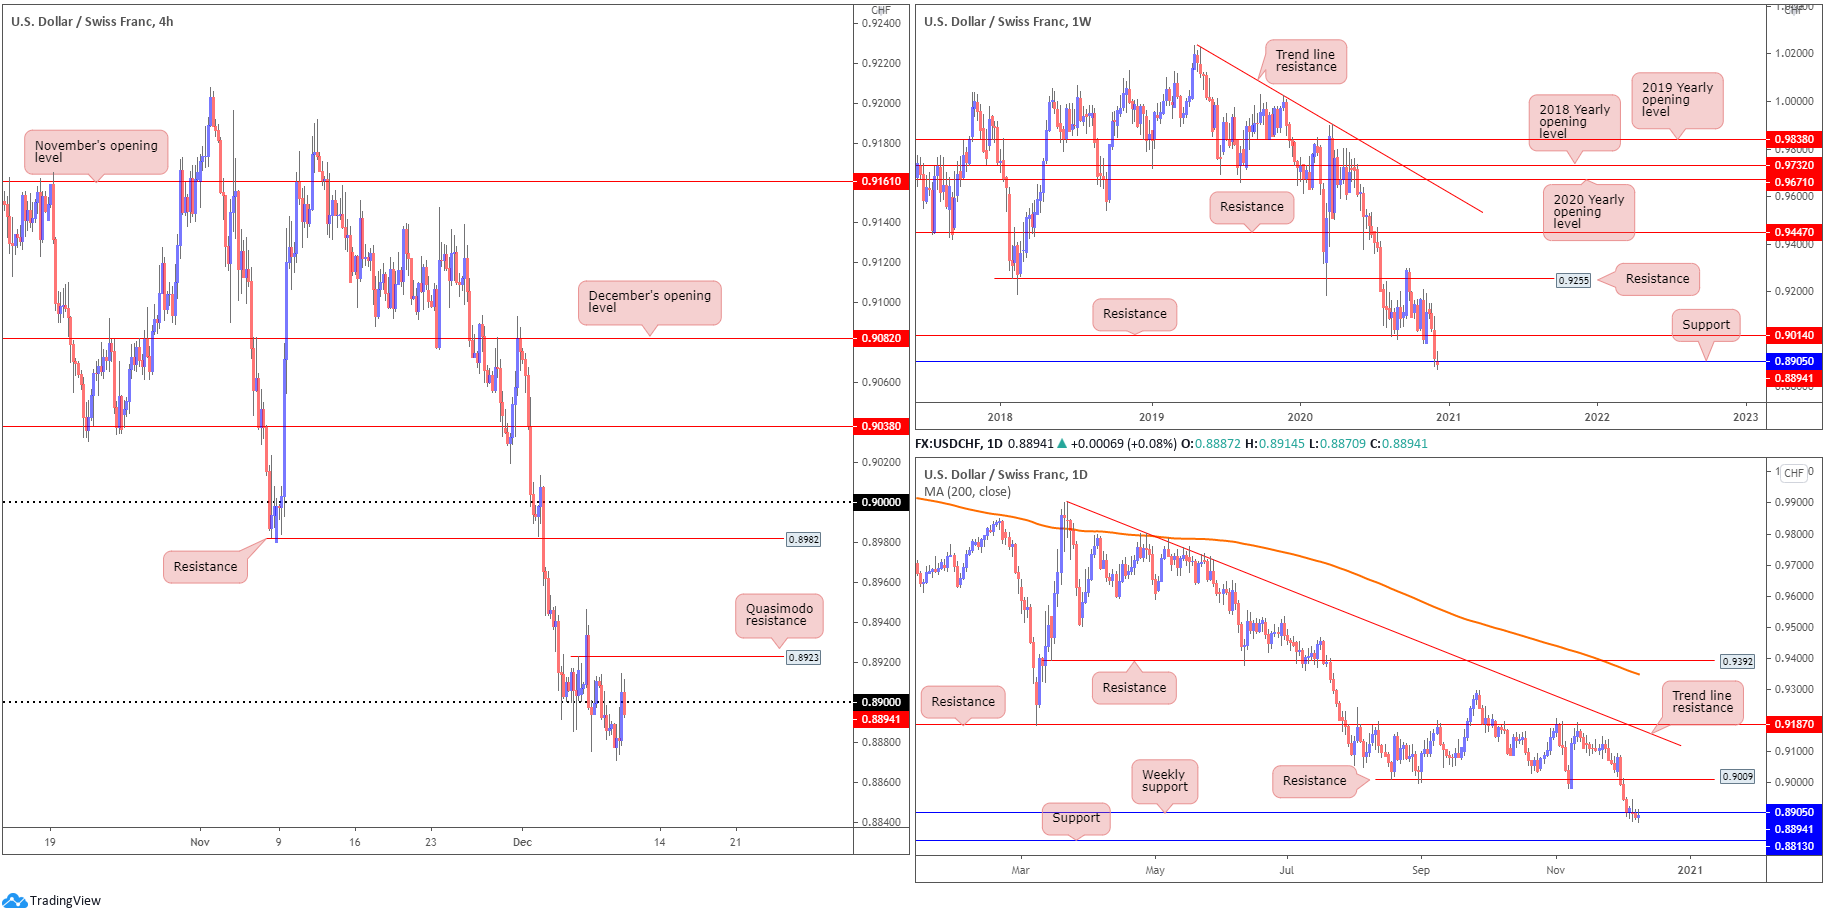
Propelled higher amid a broad USD bid Wednesday, as the DXY regained position north of 91.00, buyers and sellers on the H4 USD/CHF chart are now seen battling for position around the 0.89 handle. Leaving Quasimodo resistance at 0.8923 somewhat isolated, sellers appear to be making an appearance off 0.89, as we write. Below 0.89, daily support is seen as the next downside target at 0.8813, fixed just north of the 0.88 handle.
Further afield on the higher timeframes, little change has been observed. Therefore, the following will echo similar thoughts aired in previous technical briefings (italics):
Last week’s 120-pip decline, detailing a third consecutive weekly loss, brought weekly flow into support coming in at 0.8905. While buyers could still attempt a recovery off 0.8905, traders are urged to pencil in the possibility of refreshing multi-year lows and shining the limelight on support at 0.8696. Interestingly, the trend in this market has been lower since early 2019.
A similar picture is evident on the daily timeframe. The difference, however, is below weekly support at 0.8905 on the daily scale, support is seen at 0.8813, and a 0.8905 rejection could reignite interest in daily resistance at 0.9009.
Areas of consideration:
- The retest at 0.89 has clearly interested sellers, given the lack of supportive flow evident on the bigger picture at the moment.
- A test of H4 Quasimodo resistance at 0.8923 is not out of the question today, and could, similar to the above, draw interest due to the position of price action on the higher timeframes.
Dow Jones Industrial Average:
US equities nudged lower Wednesday as investors digested stimulus negotiations. The Dow Jones Industrial Average shed 105.07 points, or 0.35%; the S&P 500 dropped 29.43 points, or 0.79% and the Nasdaq declined by 243.82 points, or 1.94%.
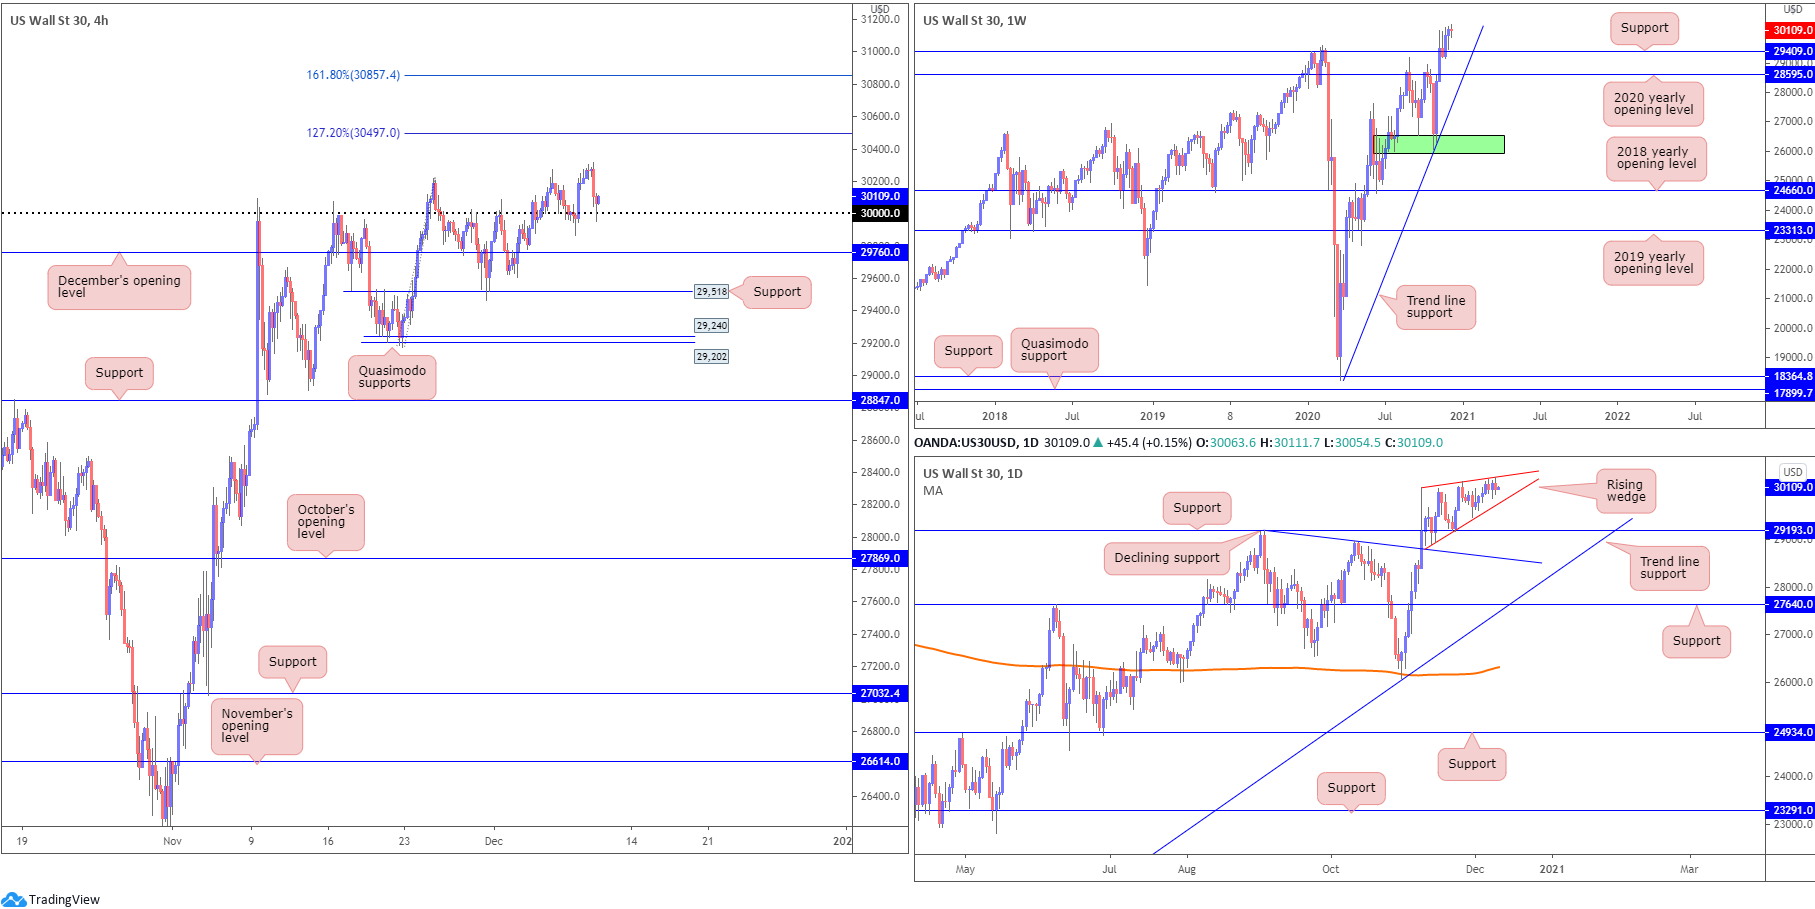
Despite the Dow Jones chalking up fresh all-time highs at 30,314 on Wednesday, H4 candles withdrew back to the widely watched 30,000 figure. With buyers currently showing a liking to the level, subsequent buying may reach for the 127.2% Fibonacci projection point at 30,497, followed by the 161.8% Fibonacci projection point at 30,857. Failure to hold 30,000 could see December’s opening value at 29,760 make an appearance, aligning closely with the lower edge of the daily rising wedge.
From the weekly timeframe, we can see that in the event a correction materialises, support at 29,409 (prior Quasimodo resistance) could be an area dip-buyers find interest in. According to the daily timeframe, support is seen at 29,193. Pattern traders may also acknowledge the rising wedge forming between 30,097 and 28,908.
Areas of consideration:
- 30,000 represents key support on the H4 scale, with upside targets resting at 30,497 and 30,857. December’s opening value at 29,760 is next on tap in terms of support, converging with daily structure (the lower limit of the rising wedge).
- The rising wedge seen on the daily timeframe, should its lower edge be engulfed, sellers could force a retest of daily support at 29,193.
XAU/USD (GOLD):
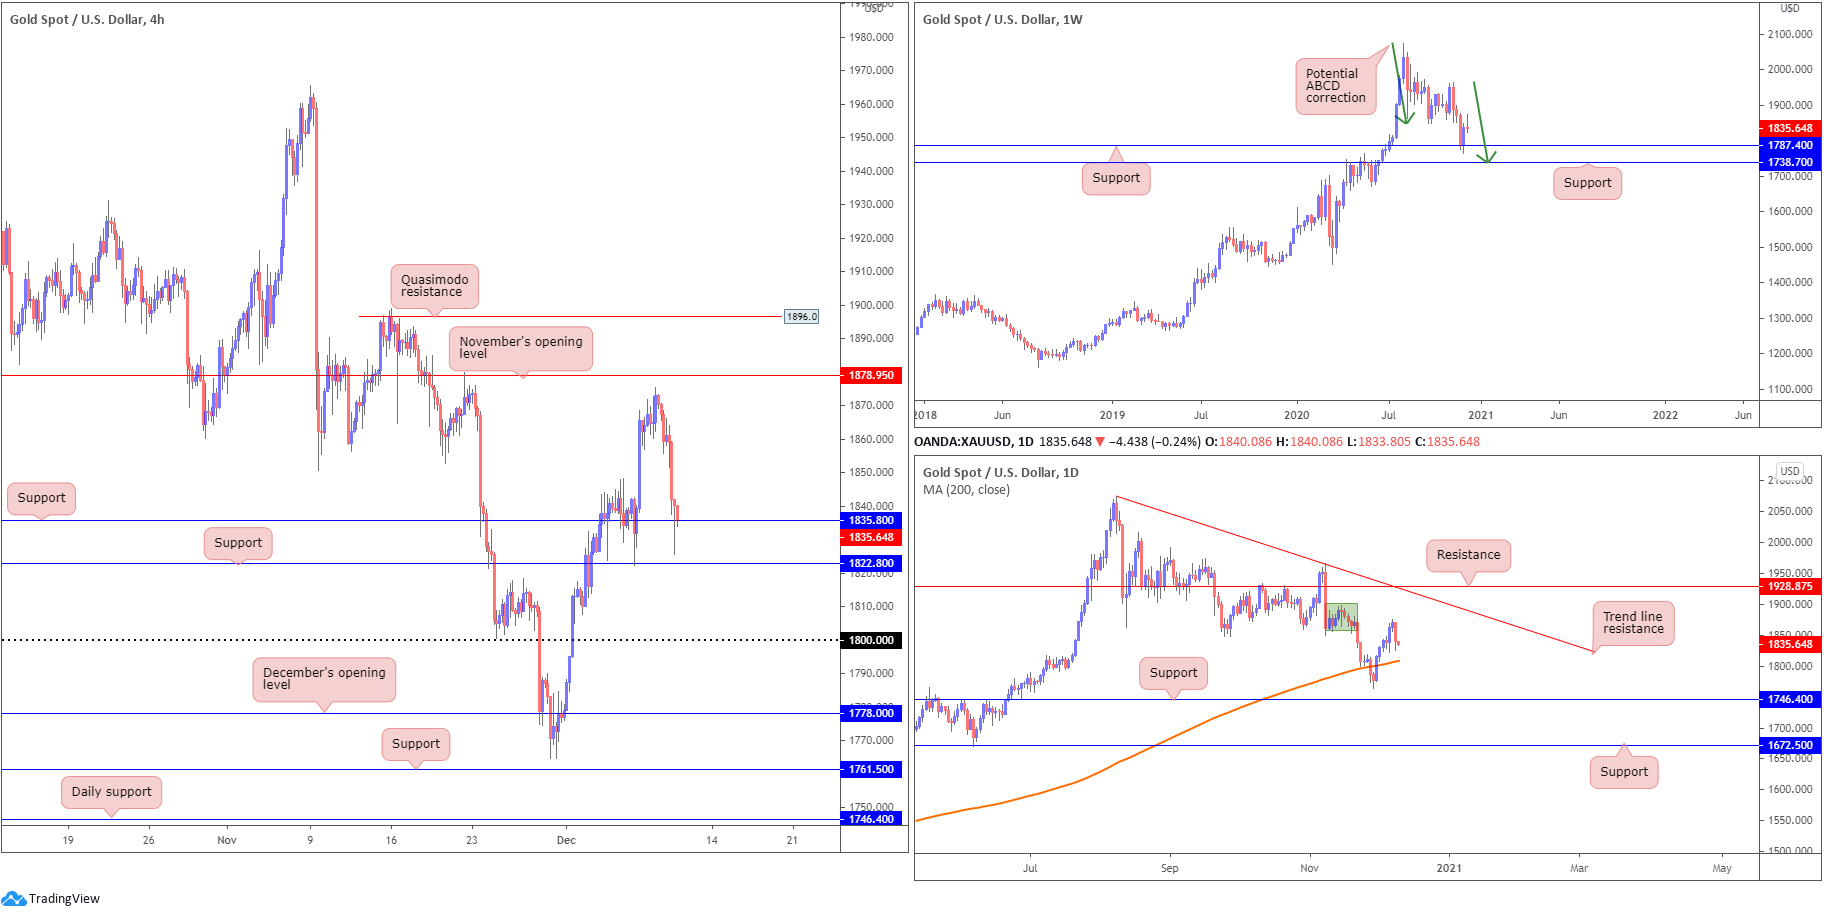
As the US dollar index found grip above 91.00 on Wednesday, spot gold tumbled just south of November’s opening value at $1,878 and shook hands with H4 support priced in at $1,835. Although H4 action formed a hammer candle off the aforementioned support, buyers appear unwilling to commit at the moment.
From the weekly timeframe, despite Wednesday’s correction, we remain in a favourable position off support at $1,787 (sited ahead of another support at $1,738 and a potential ABCD correction [green arrows]). The fact the yellow metal has been decisively trending higher since the beginning of 2016 adds to the bullish narrative off $1,787.
Meanwhile, on the daily chart, supply around 1,878ish (green zone) held upside yesterday. With this, the 200-day SMA (orange – $1,808) could be retested sometime today.
Areas of consideration:
- Buyers appear free to take things higher, according to the weekly trend and weekly support at $1,787.
- Retesting H4 support at $1,835 could still entice buyers, though traders are urged to prepare for the possibility of a break to another nearby H4 support at $1,822.
- Below the aforementioned H4 supports, the 200-day SMA is seen as possible support, hovering ahead of $1,800.
The accuracy, completeness and timeliness of the information contained on this site cannot be guaranteed. IC Markets does not warranty, guarantee or make any representations, or assume any liability regarding financial results based on the use of the information in the site.
News, views, opinions, recommendations and other information obtained from sources outside of www.icmarkets.com.au, used in this site are believed to be reliable, but we cannot guarantee their accuracy or completeness. All such information is subject to change at any time without notice. IC Markets assumes no responsibility for the content of any linked site.
The fact that such links may exist does not indicate approval or endorsement of any material contained on any linked site. IC Markets is not liable for any harm caused by the transmission, through accessing the services or information on this site, of a computer virus, or other computer code or programming device that might be used to access, delete, damage, disable, disrupt or otherwise impede in any manner, the operation of the site or of any user’s software, hardware, data or property


