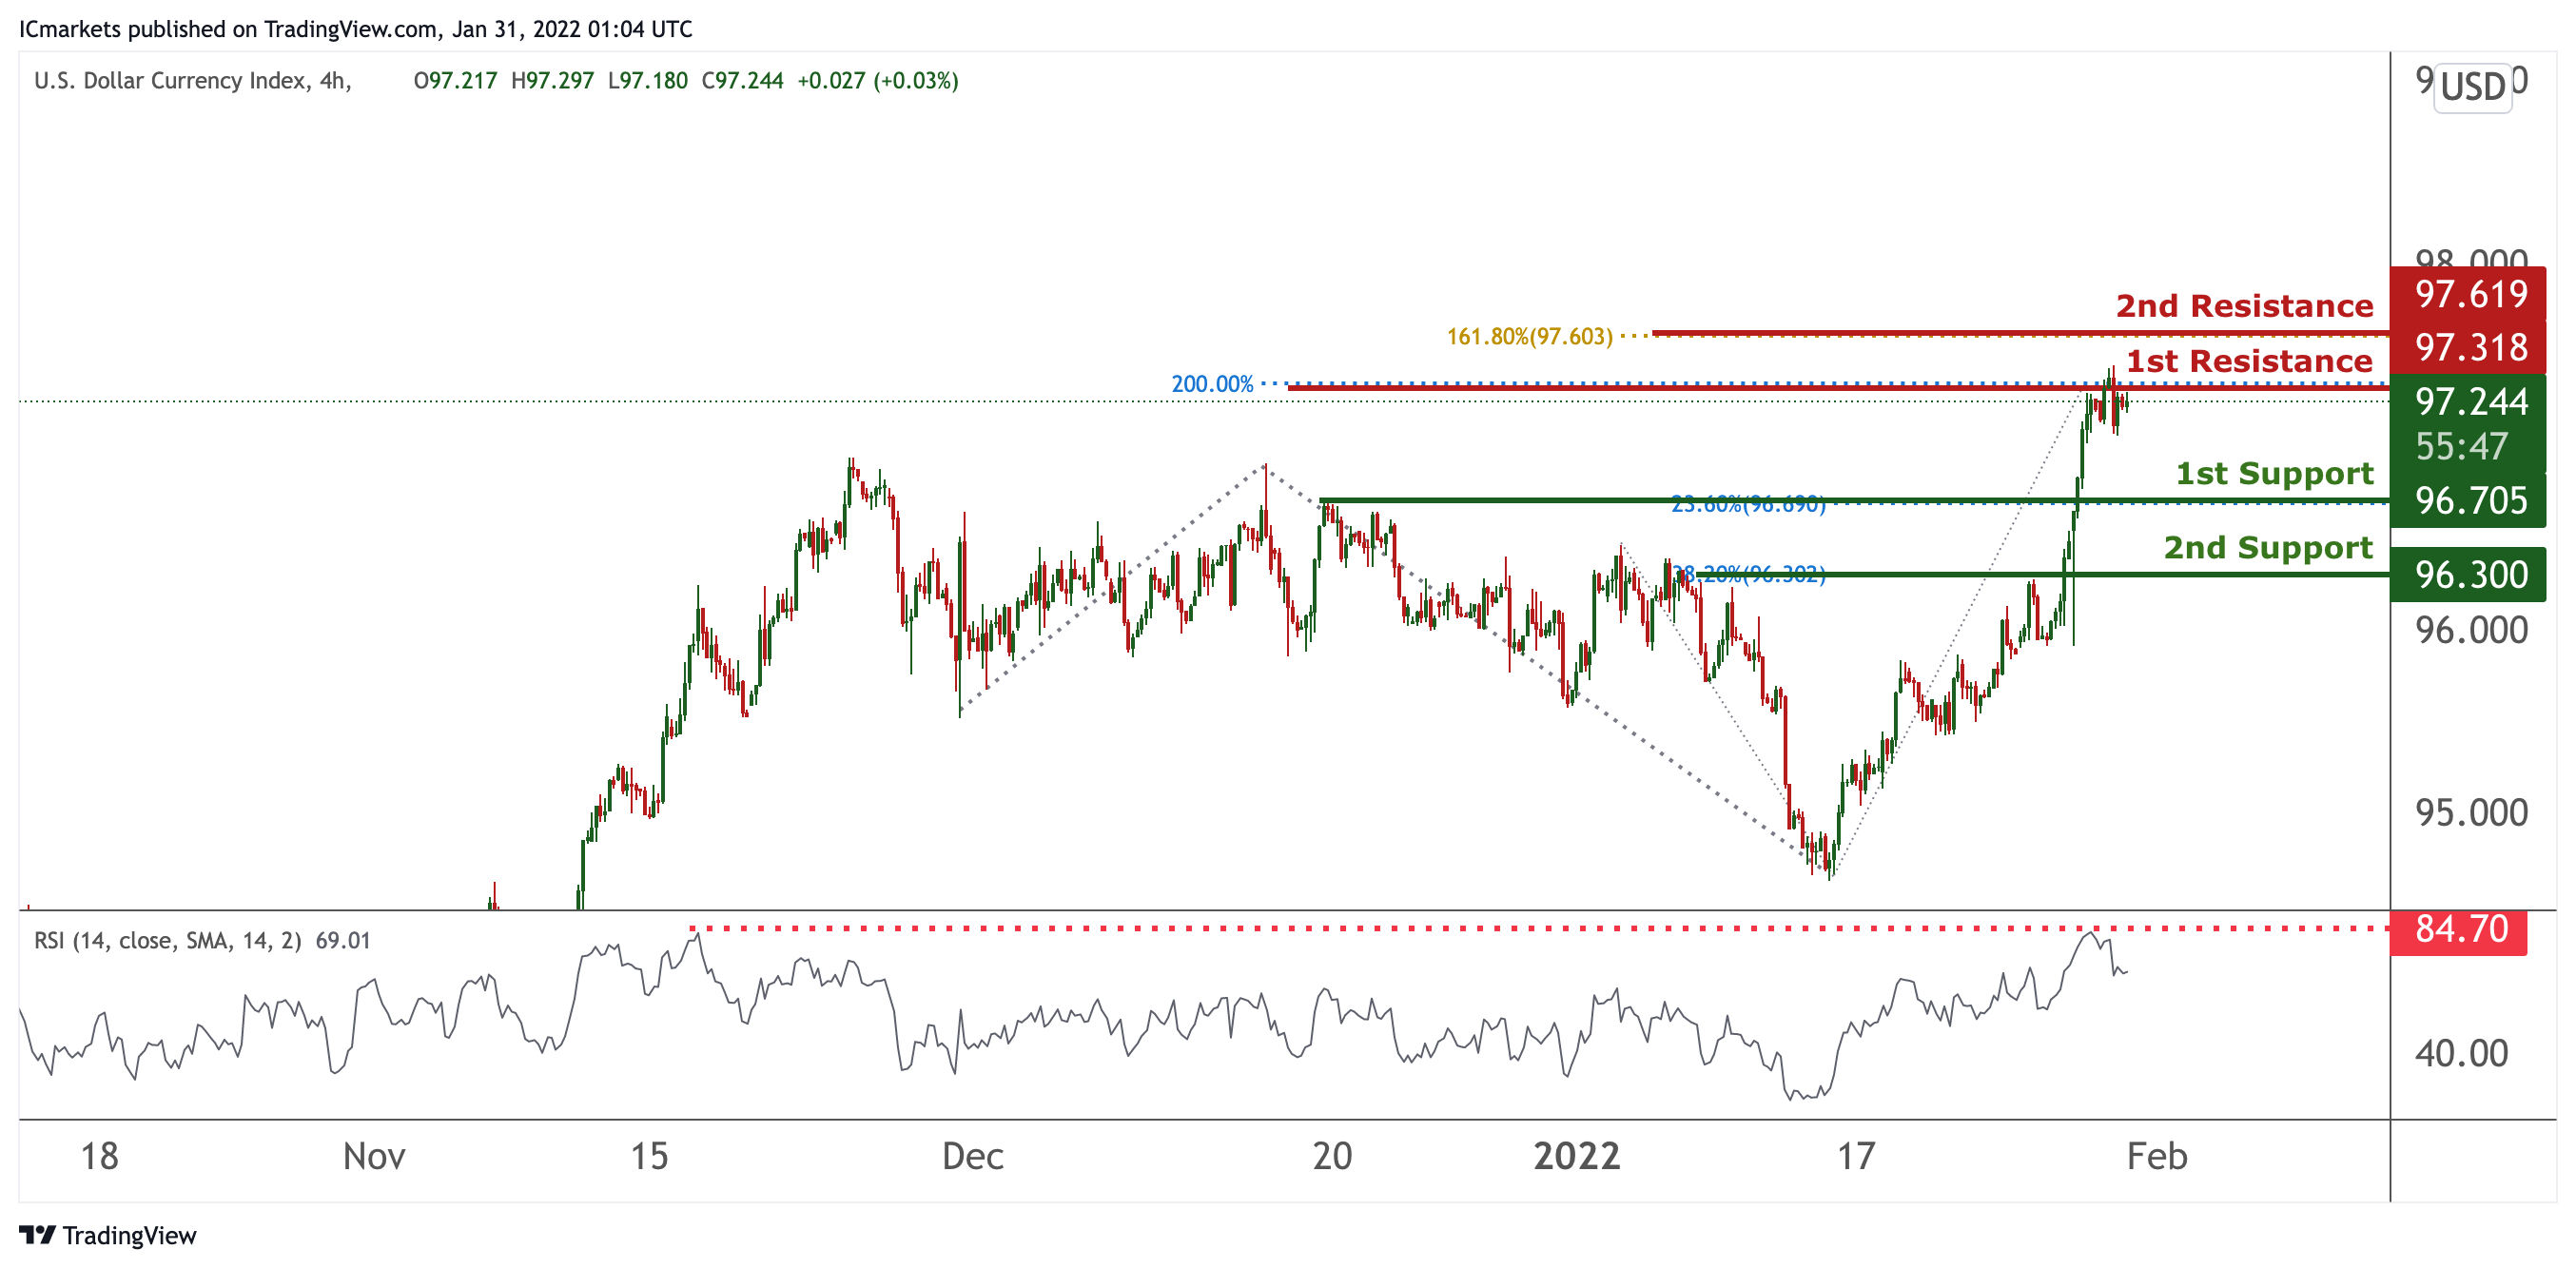
DXY:
On the H4 timeframe, prices are on bullish momentum and have reached an all time high. We would expect potentially a dip from our 1st resistance at 97.319 in line with 200% Fibonacci projection towards our 1st support at 96.705 in line with 23.6% Fibonacci retracement. RSI are at oversold extremes, further supporting our bearish bias.
Areas of consideration:
H4 time frame, 1st resistance at 97.318
H4 time frame, 1st support at 96.705
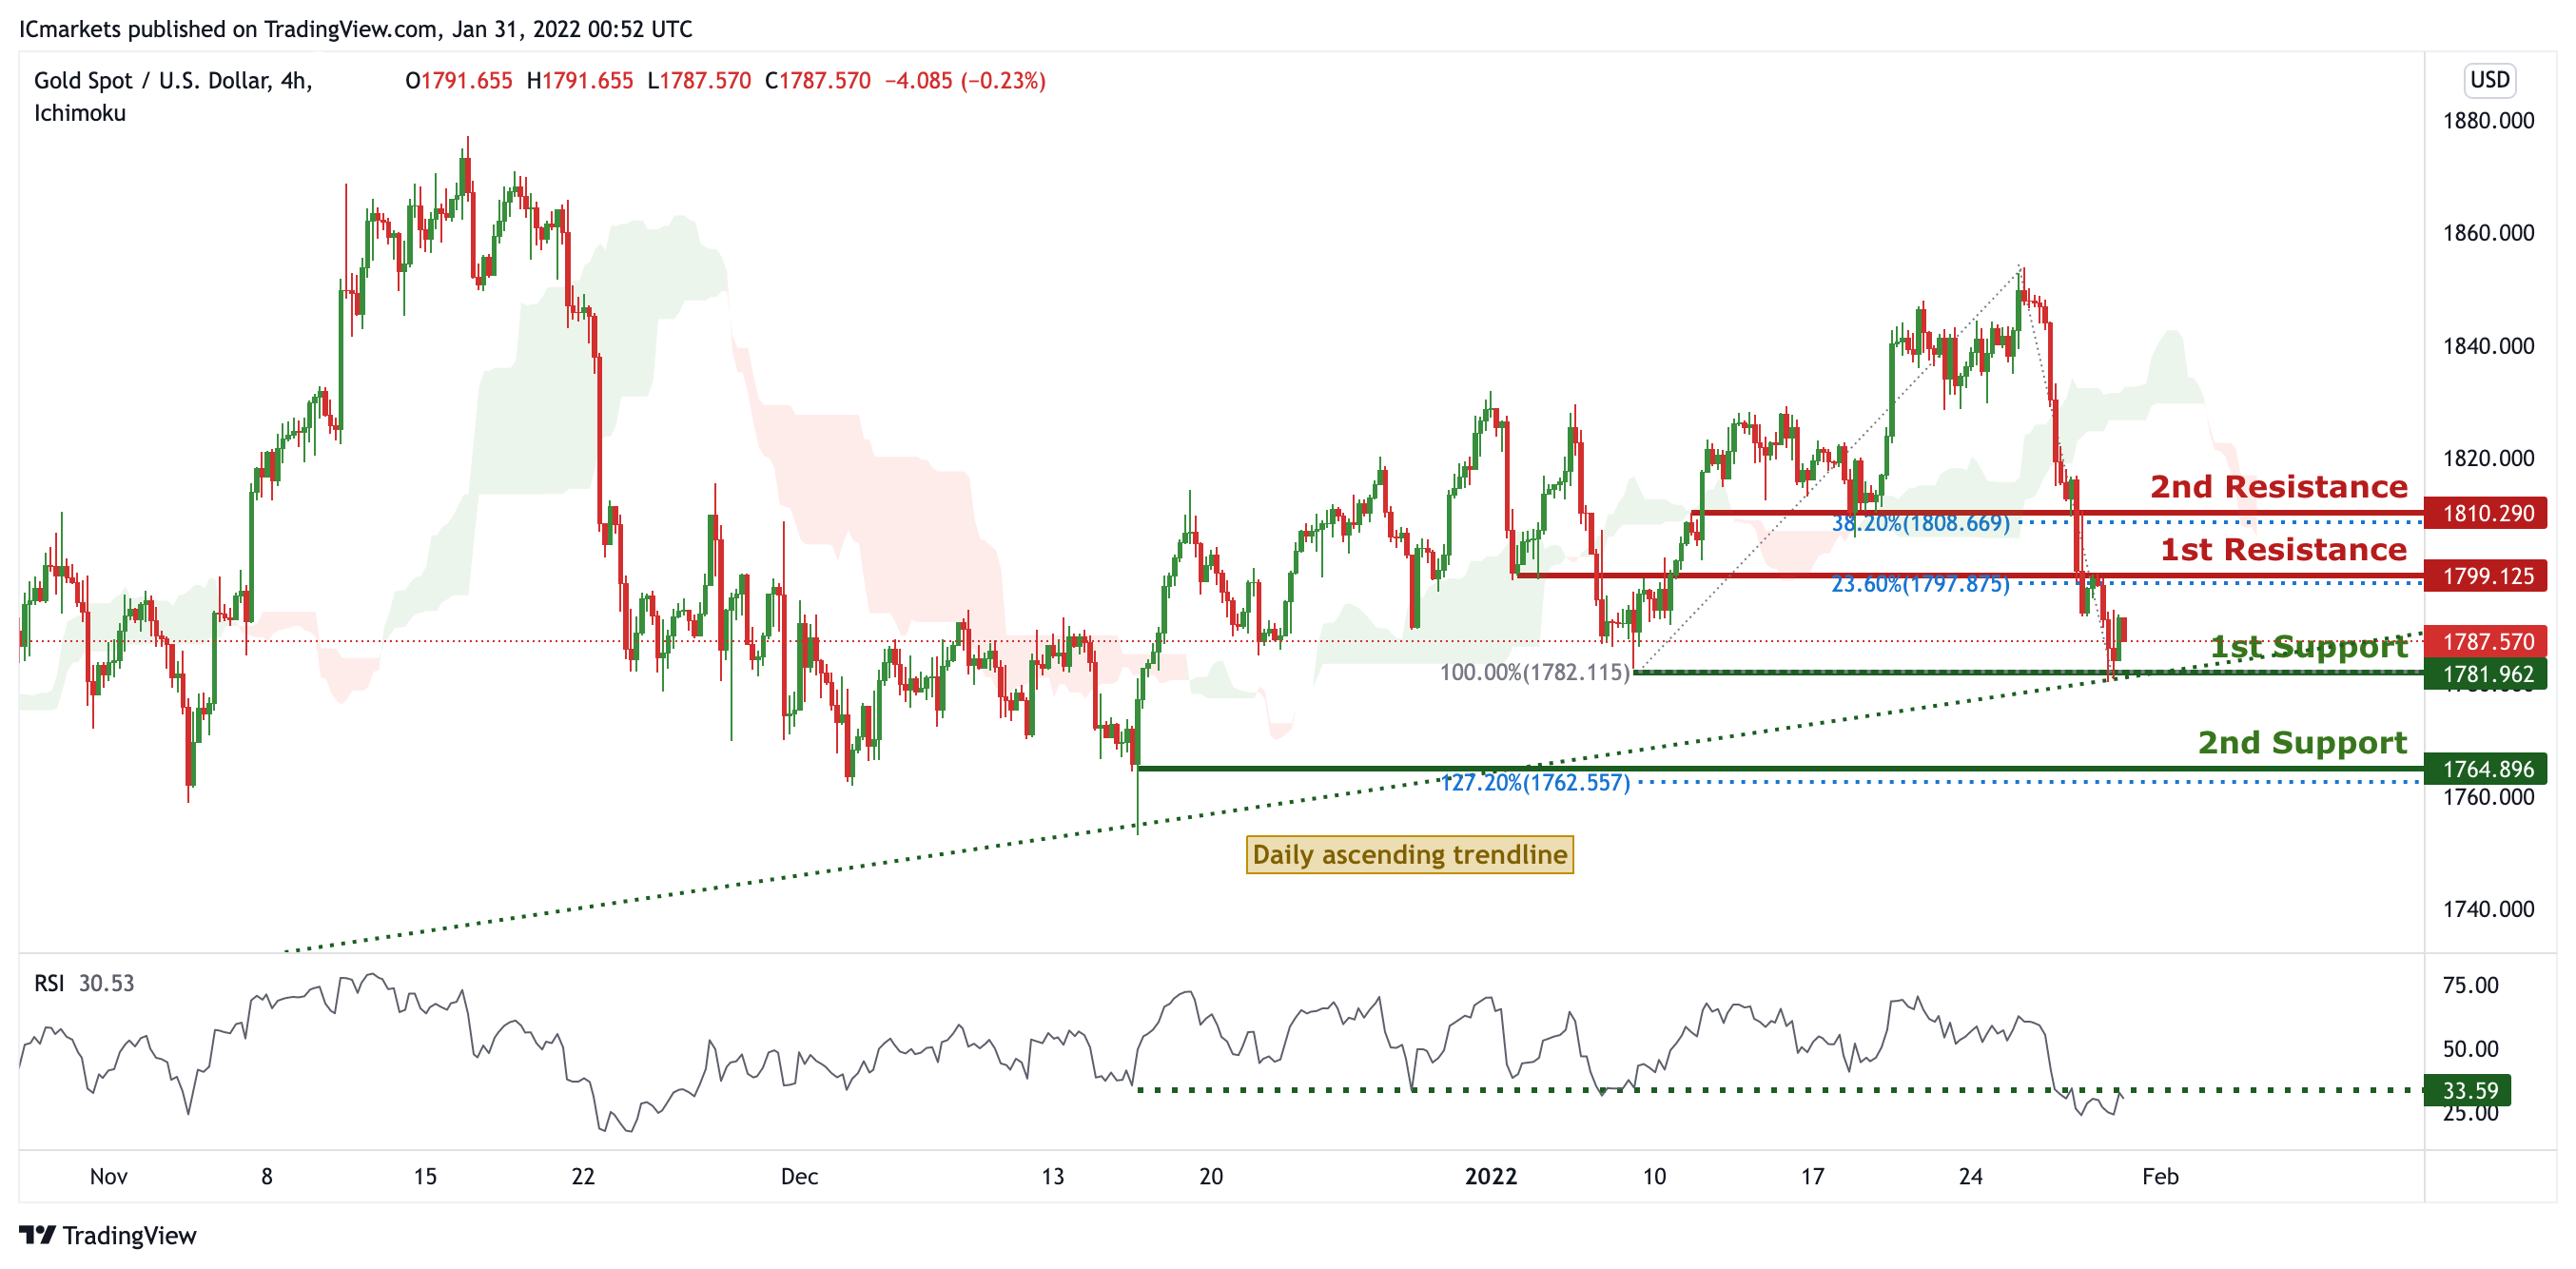
XAU/USD (GOLD):
On the H4 chart, prices are on bullish momentum and are testing our daily ascending trendline. We see a potential for a bounce from our 1st support at 1781.962 in line with 100% Fibonacci retracement towards our 1st resistance at 1799.125 which is a graphical overlap. RSI are at overbought extremes, further supporting our bullish bias.
Areas of consideration:
4h 1st support at 1781.962
4h 1st resistance at 1799.125
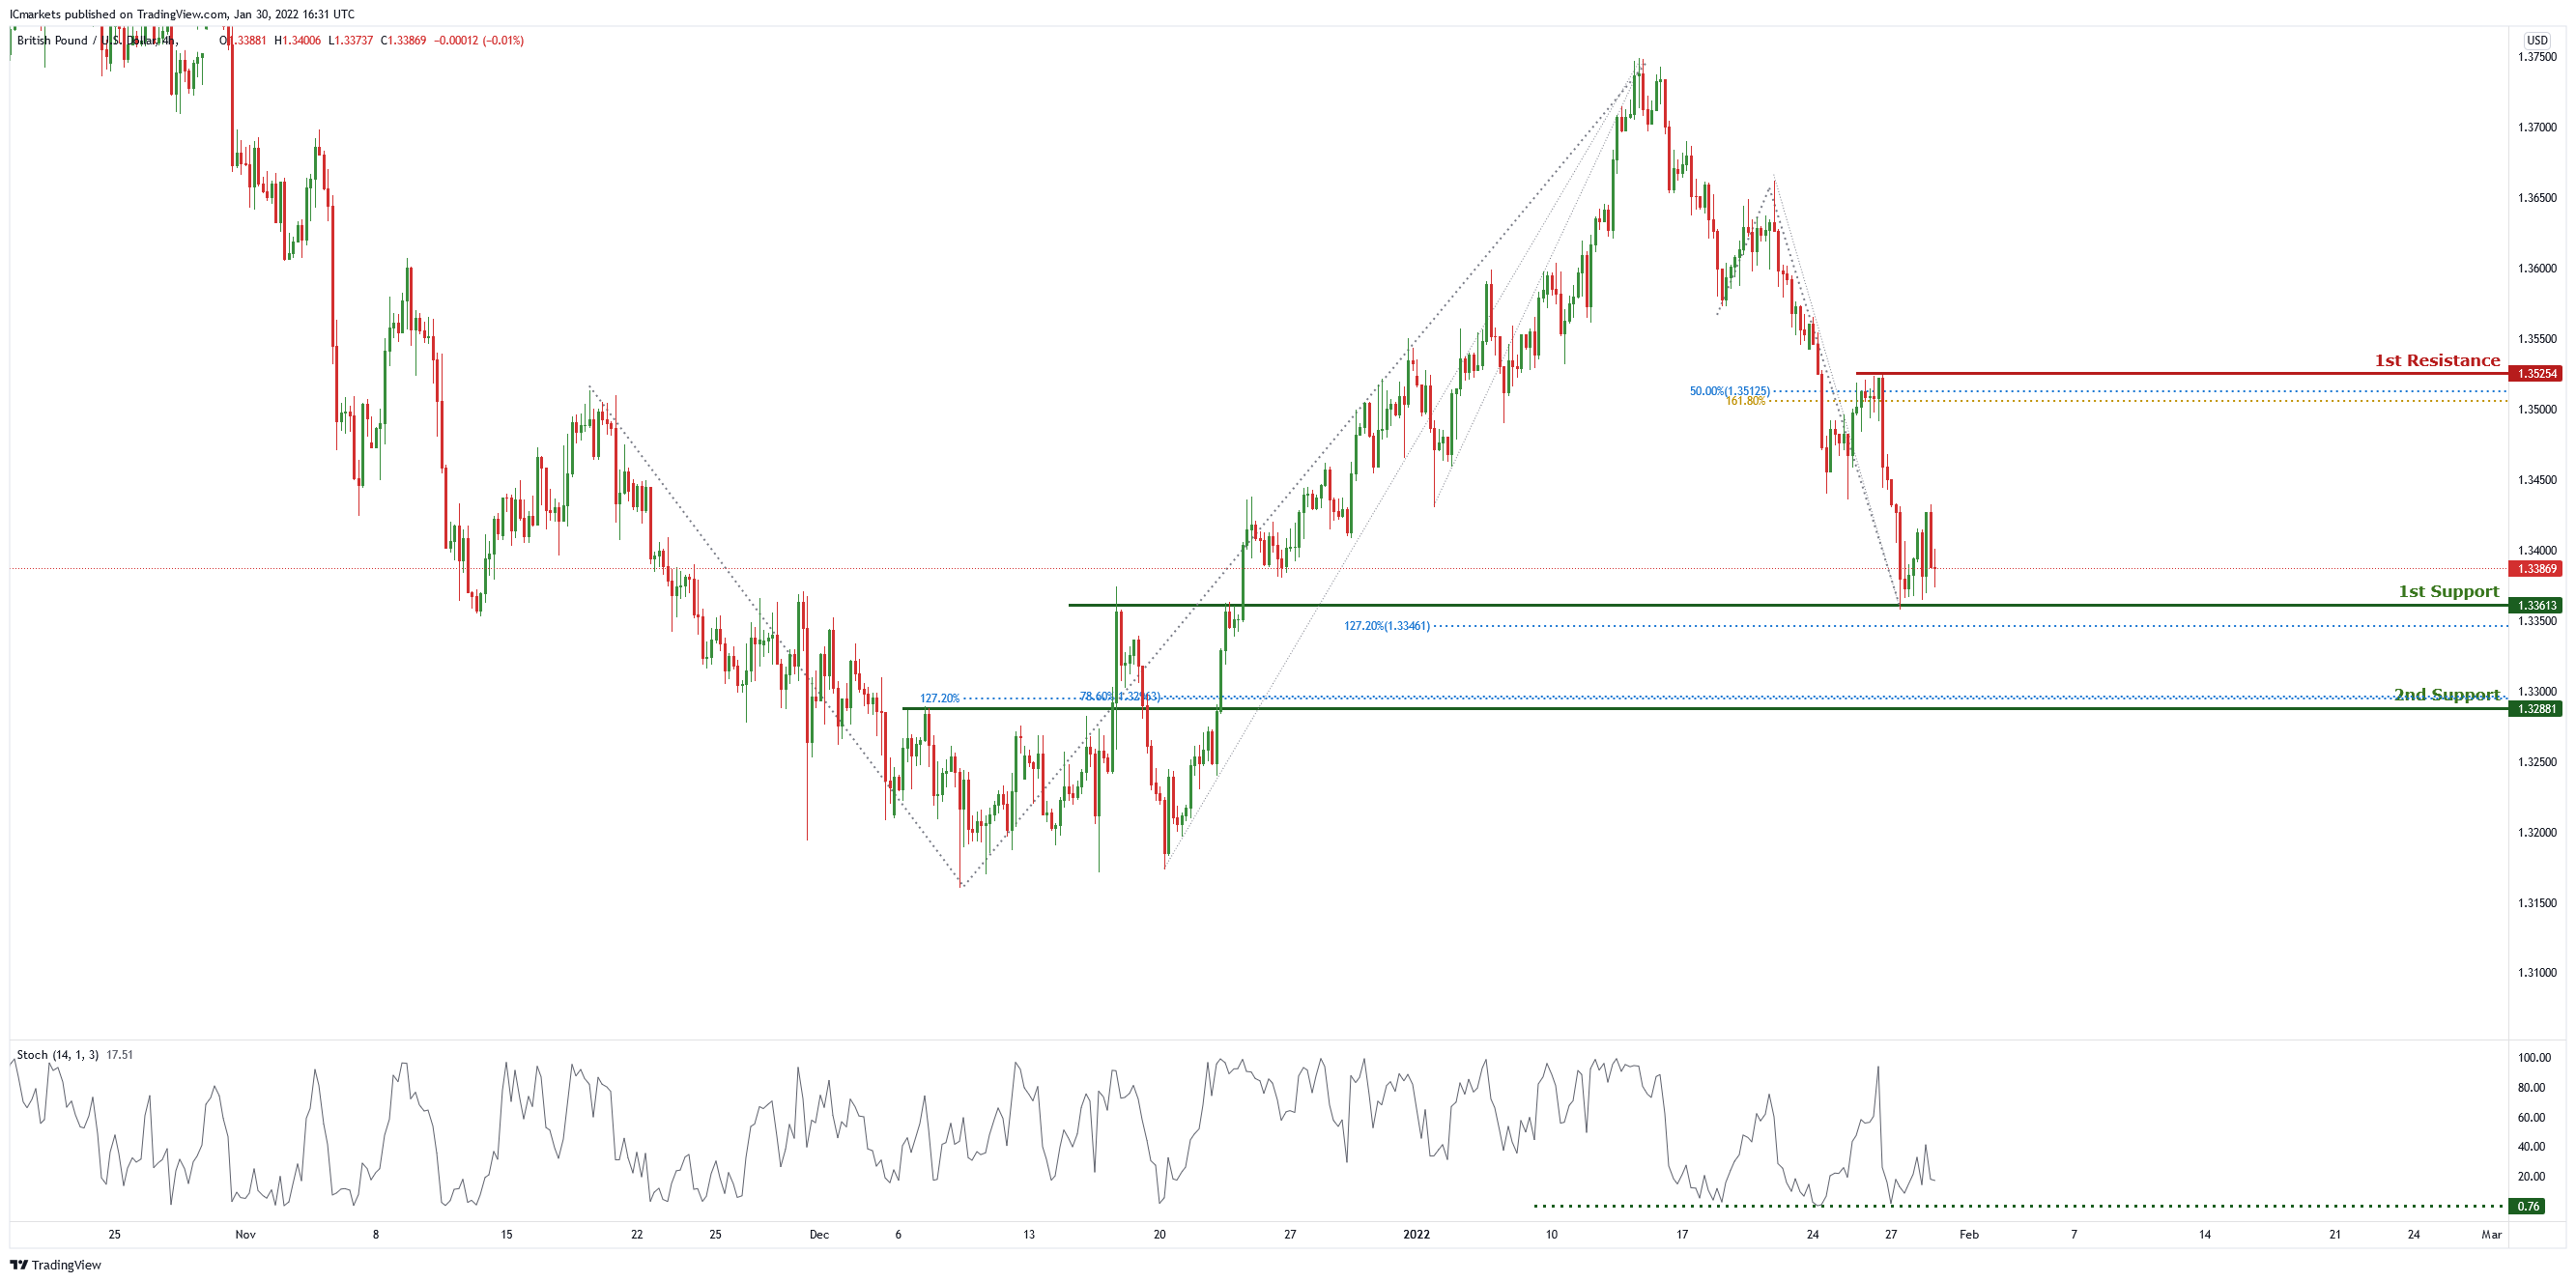
GBP/USD
On the H4 chart price is near 1st support level of 1.33613 which is also 127.2% Fibonacci retracement. Price can potentially bounce to the 1st resistance level of 1.35254 which is also 50% Fibonacci retracement and 161.8% Fibonacci projection. Our bullish bias is supported by the stochastic indicator as it is at support level.
Areas of consideration:
- H4 1st resistance 1.35254
- H4 1st support 1.33613
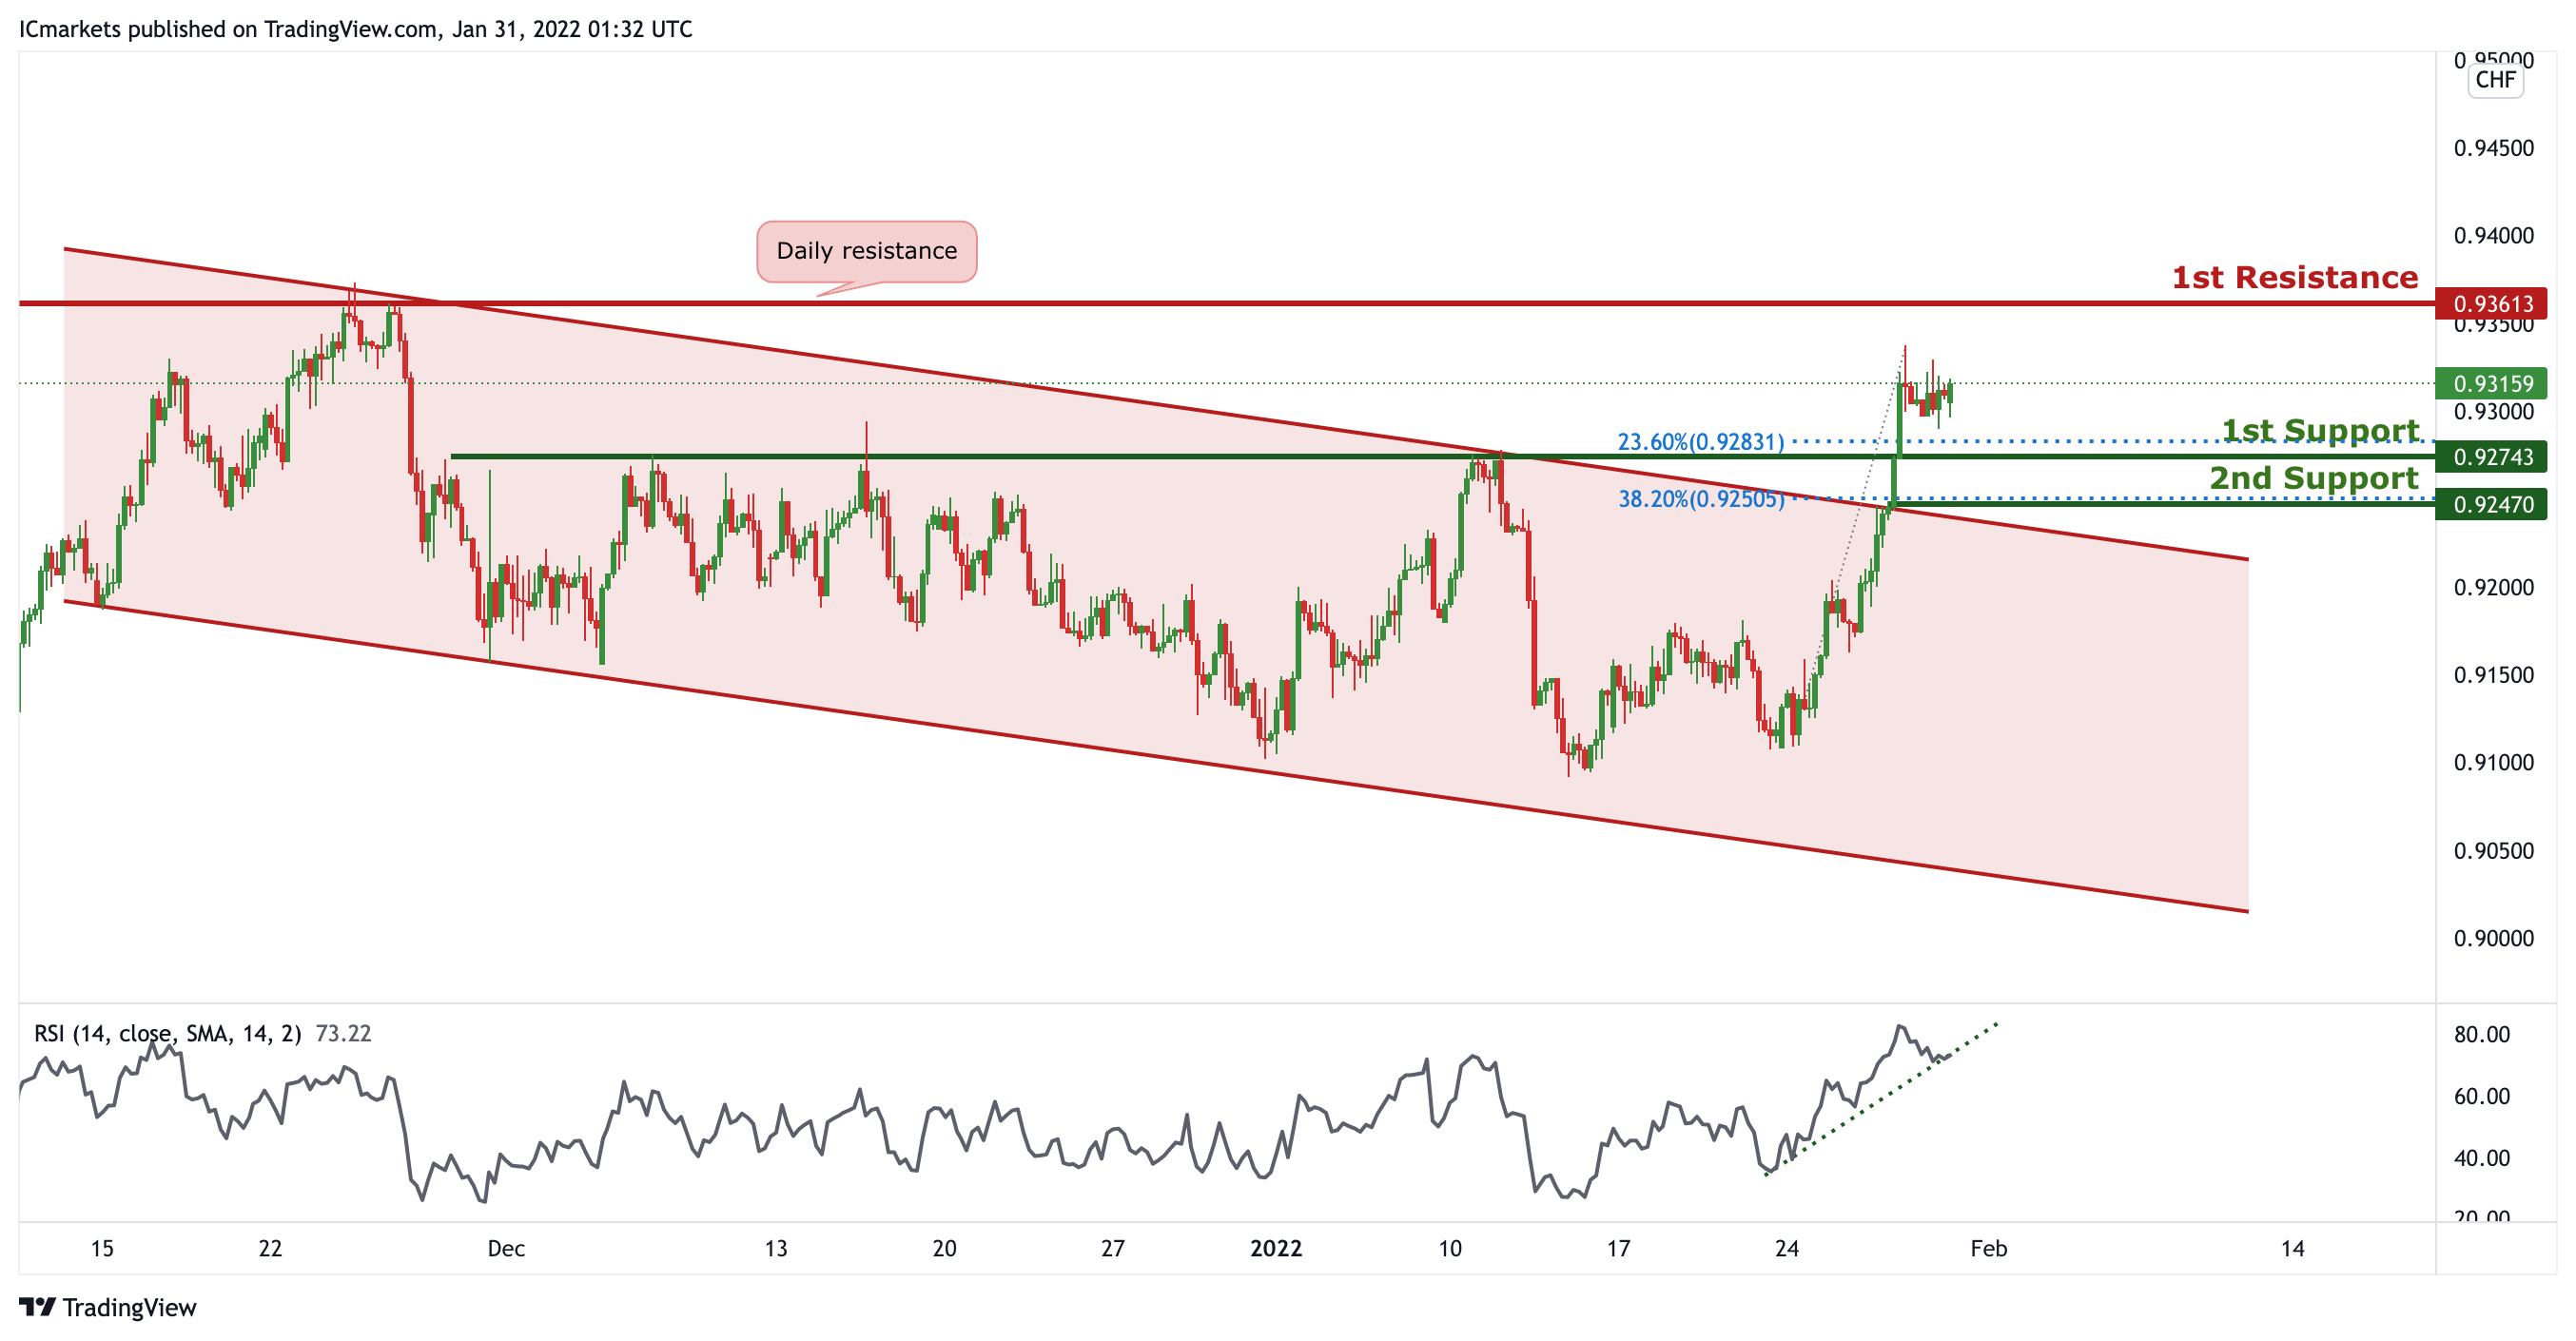
USD/CHF:
On the H4 timeframe, prices broke out of the descending channel resistance, signifying an overall bearish momentum. We can expect price to bounce at 1st Support in line with 23.6 % Fibonacci retracement towards 1st Resistance in line with daily resistance and previous swing high. Our bullish bias is further supported by the RSI indicator where it is abiding to the ascending trendline support.
Areas of consideration:
- Watch 1st Support at 0.92743
- Watch 1st Resistance at 0.93613
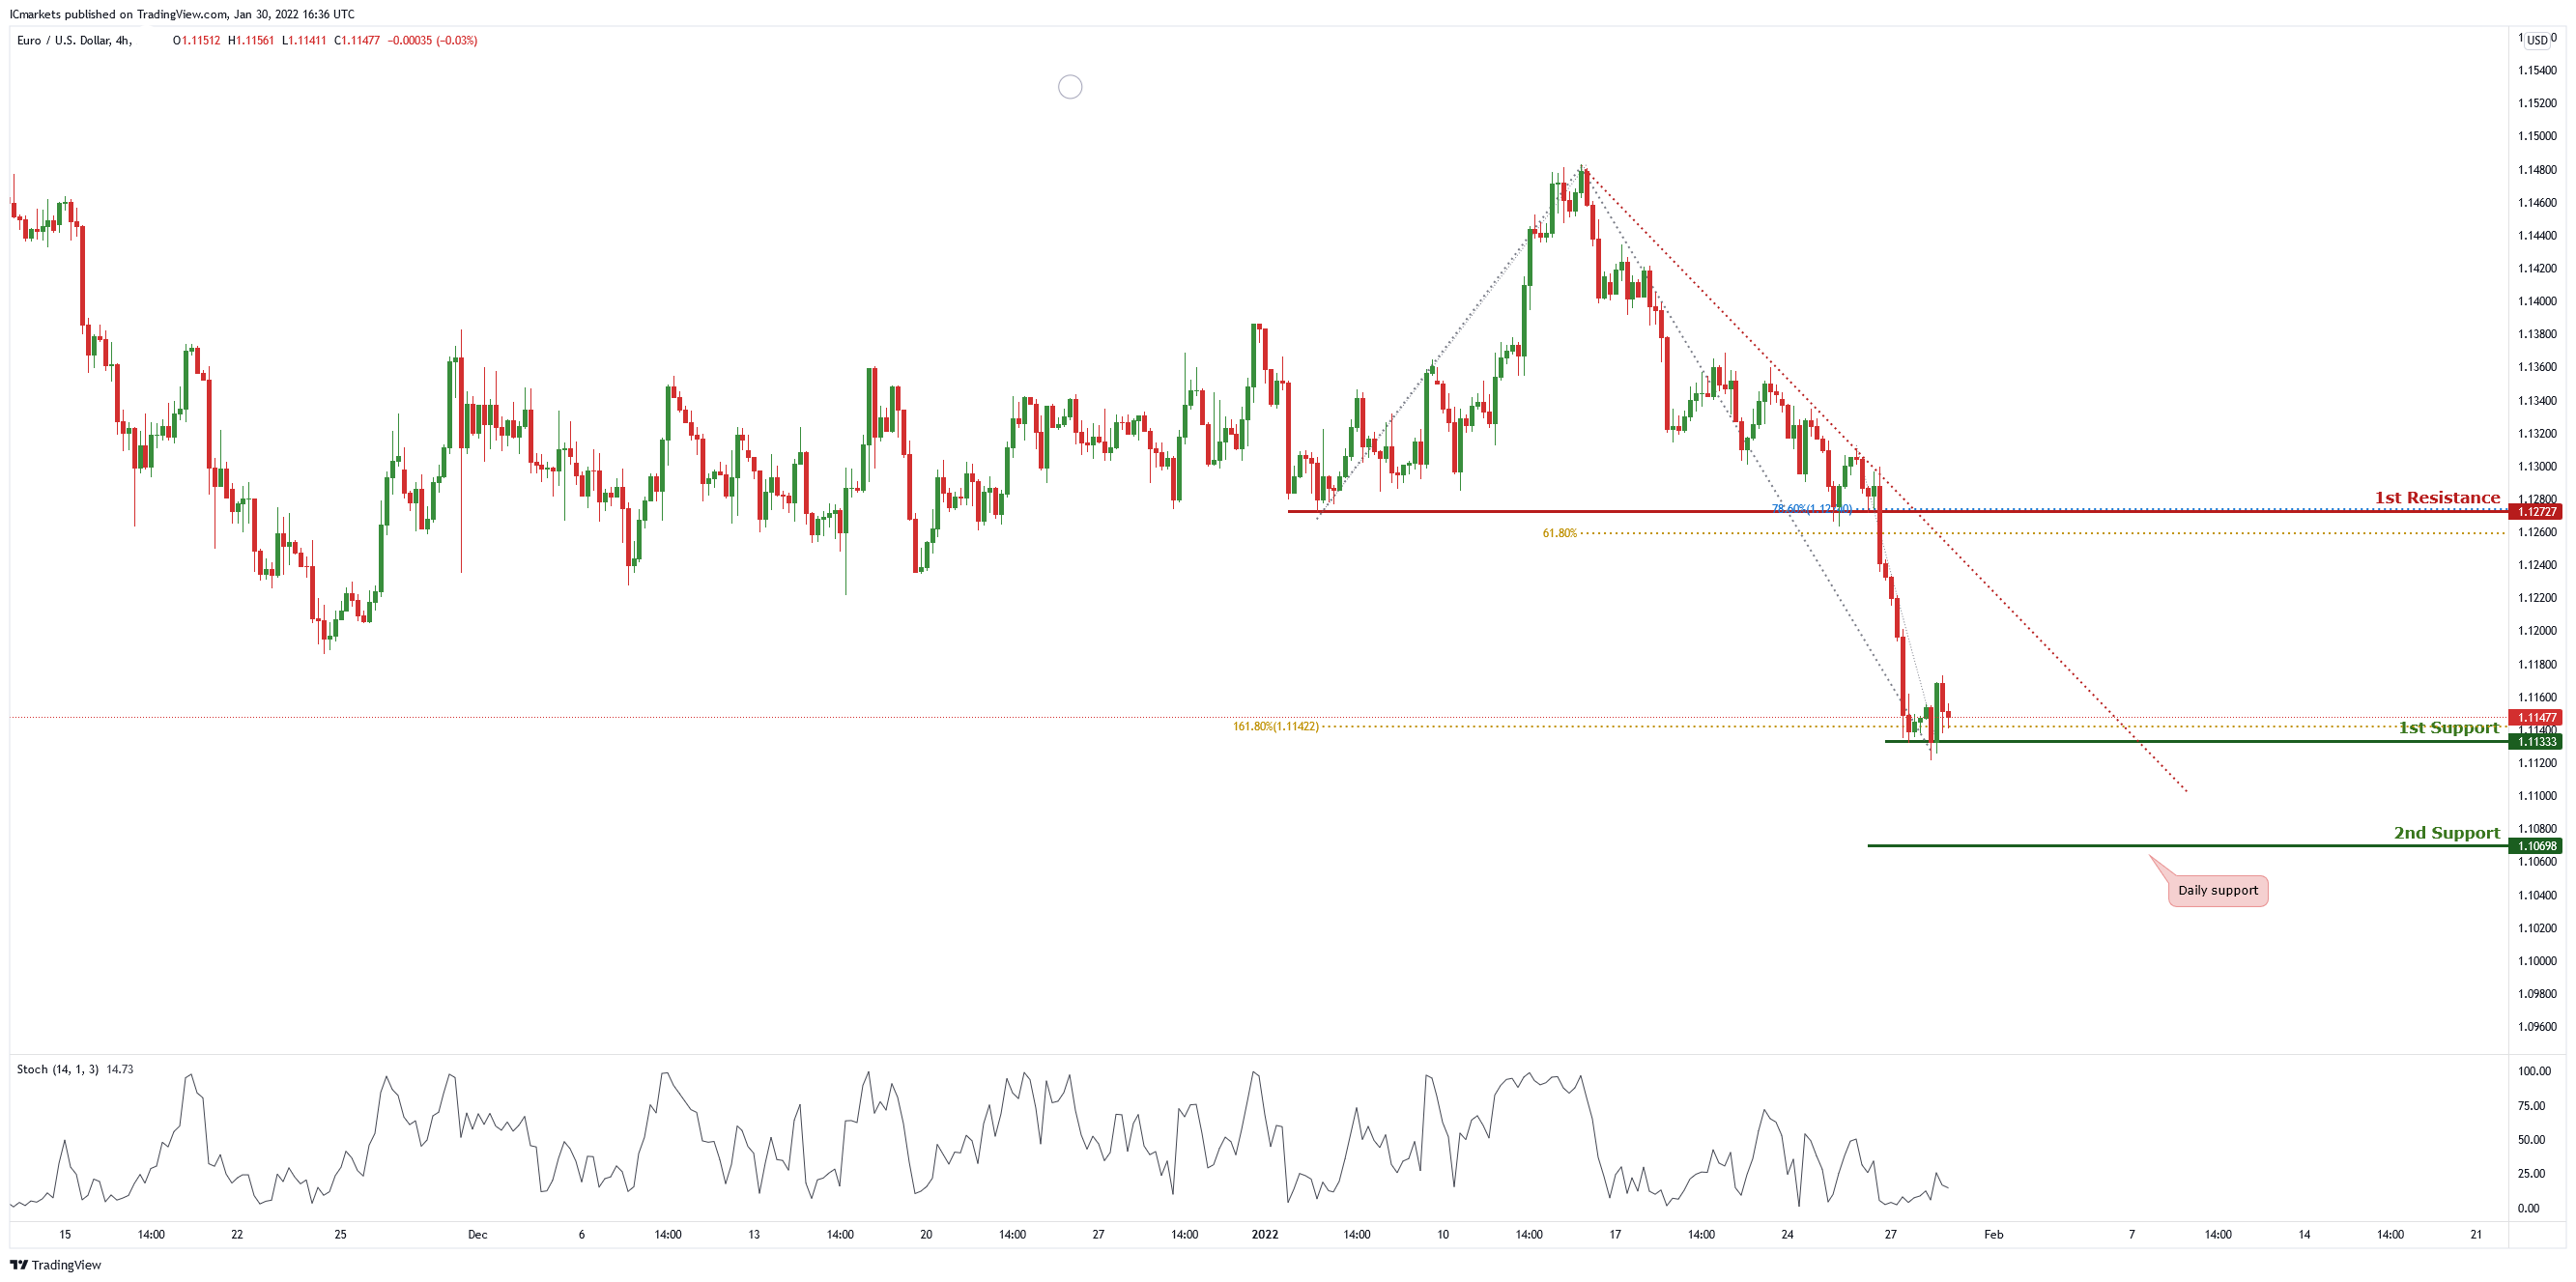
EUR/USD :
On the H4 chart, price is abiding by a descending trendline and near 1st support level of 1.11333 which is also 161.8% Fibonacci retracement. Price can potentially bounce to the 1st resistance of 1.12727 which is also 61.8% Fibonacci projection and 78.6% Fibonacci retracement. Our bullish bias is supported by the stochastic indicator as it is at support level.
Areas of consideration
- H4 1st support at 1.11333
- H4 1st resistance 1.12727
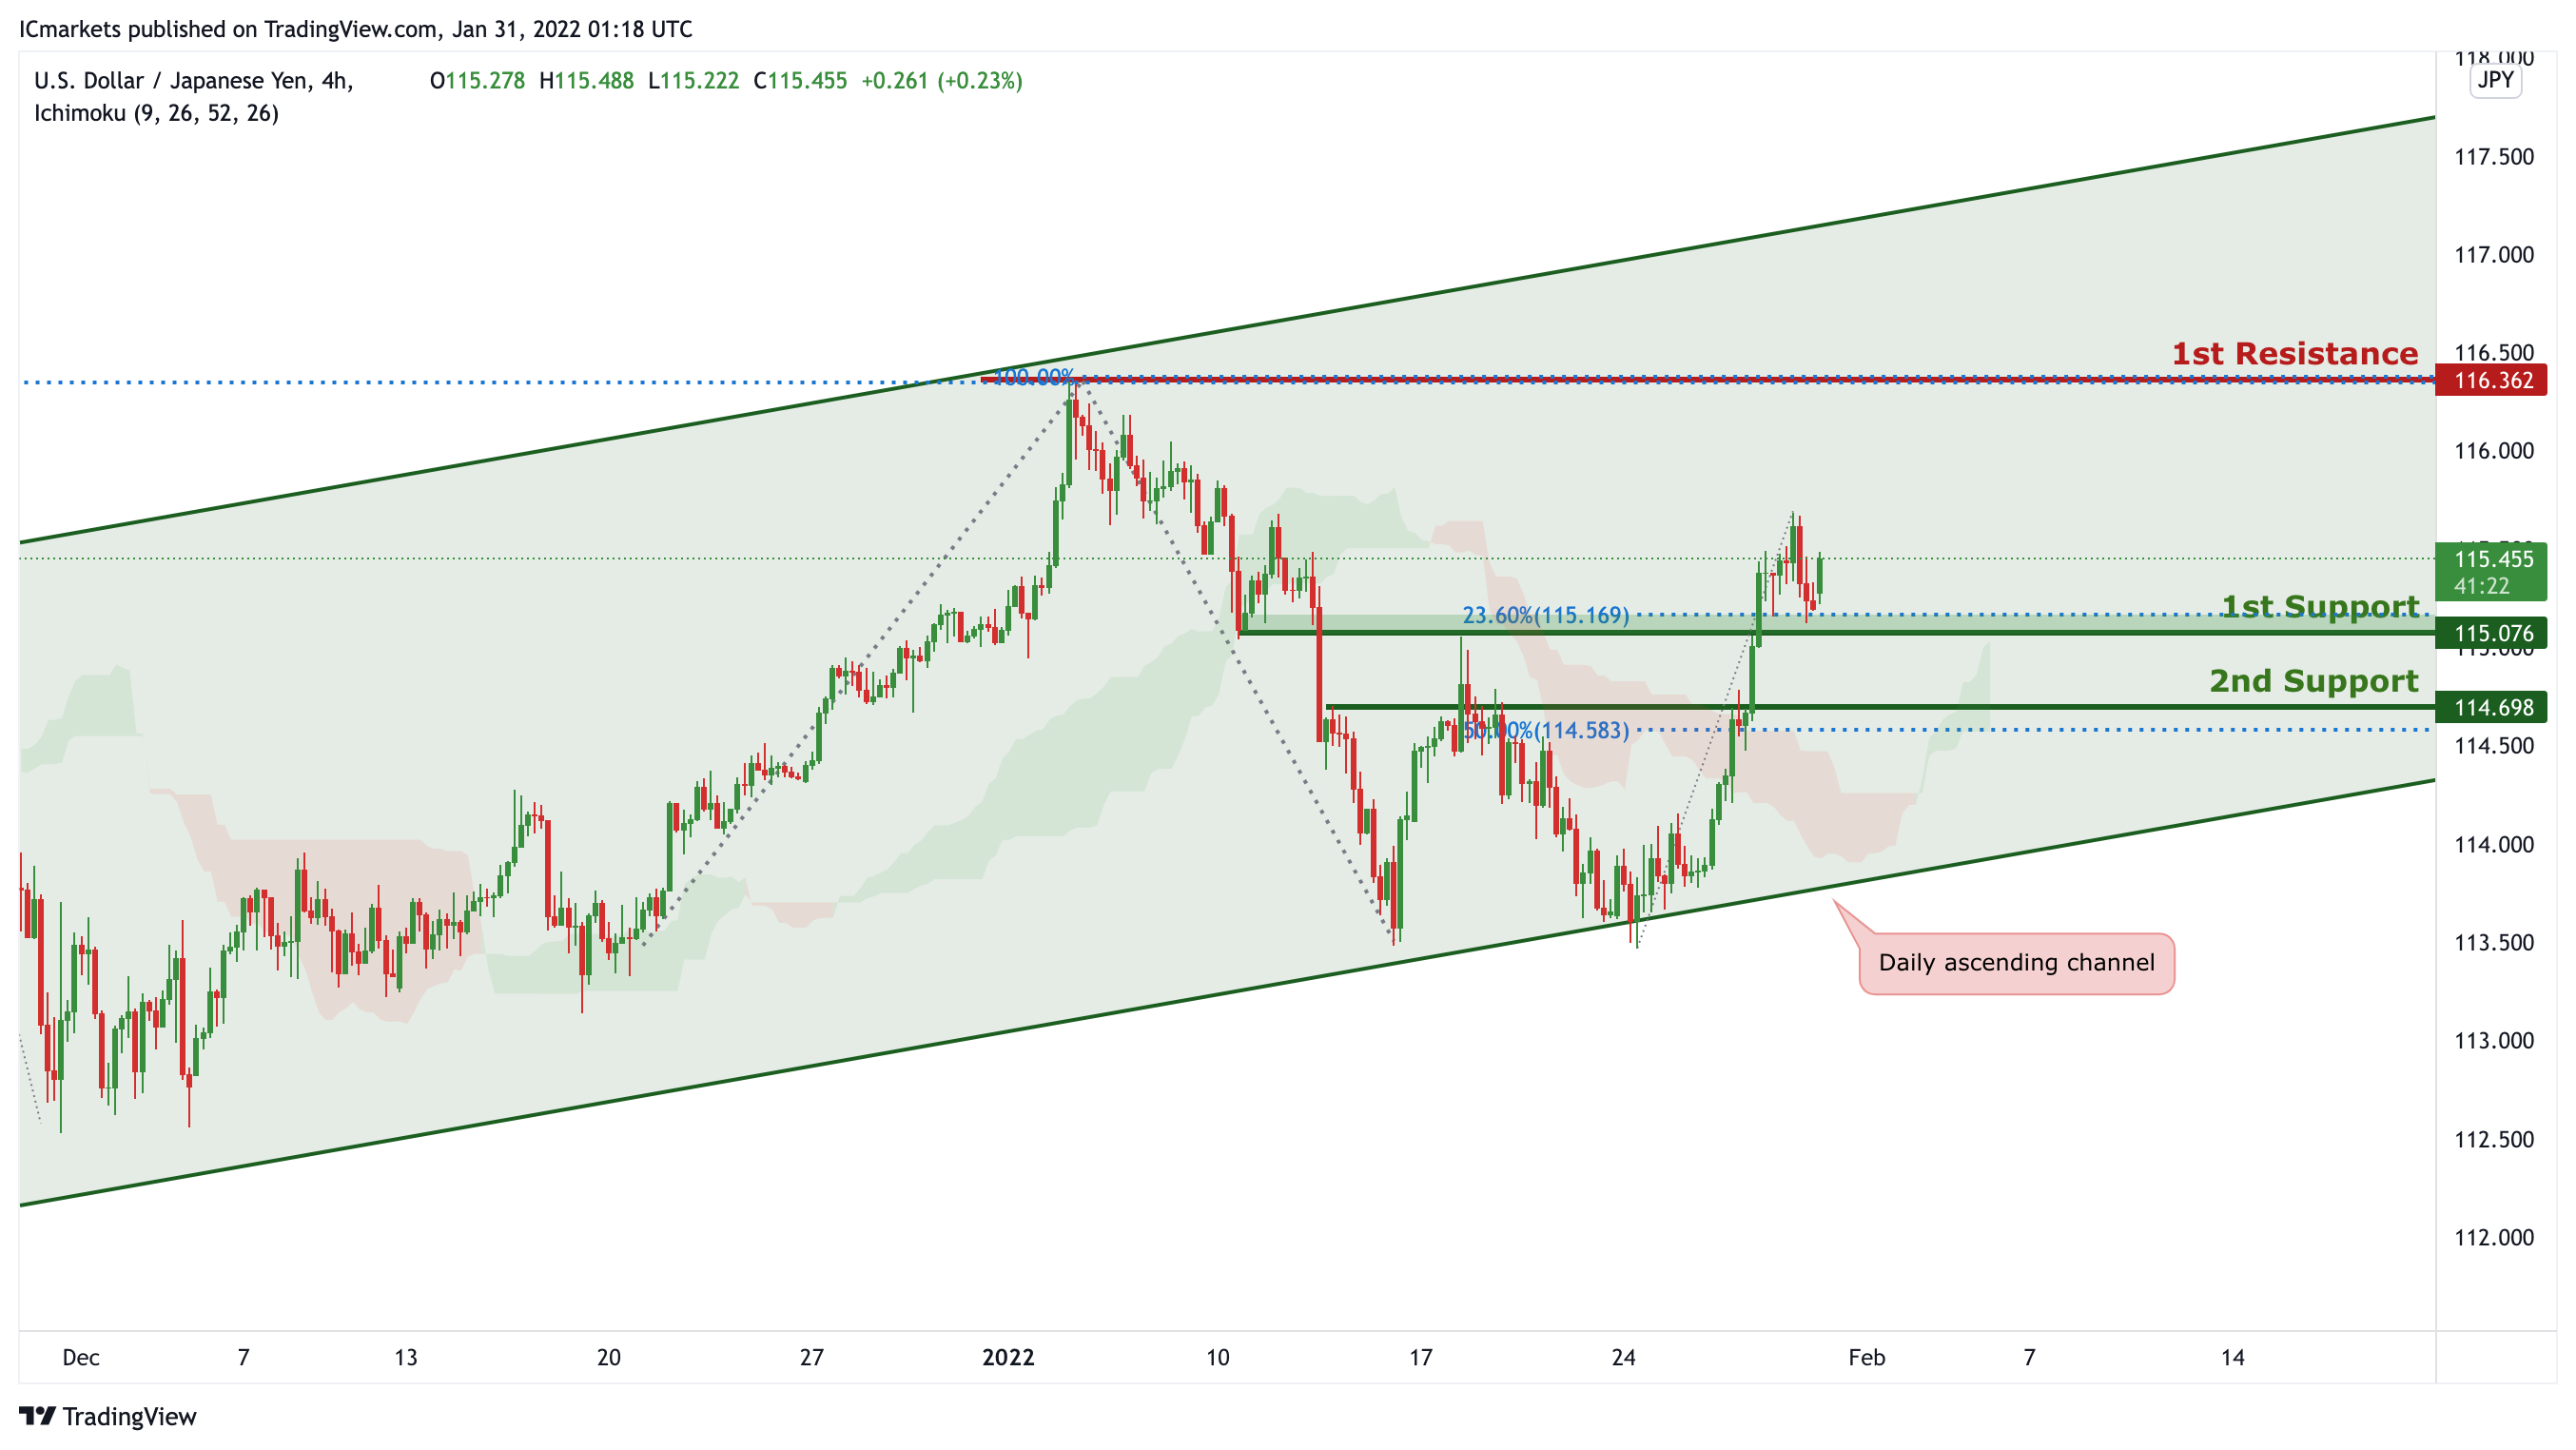
USD/JPY:
On the H4 chart, price is trading in an ascending channel and is near 1st support level of 115.058 which is also 23.6% Fibonacci retracement. Price can potentially go to the 1st resistance level of 116.362 which is also 100% Fibonacci projection and 127.2% Fibonacci retracement. Our bullish bias is supported by the ichimoku cloud indicator as price is trading above it.
Areas of consideration:
- H4 1st support at 115.058
- H4 1st resistance at 116.362
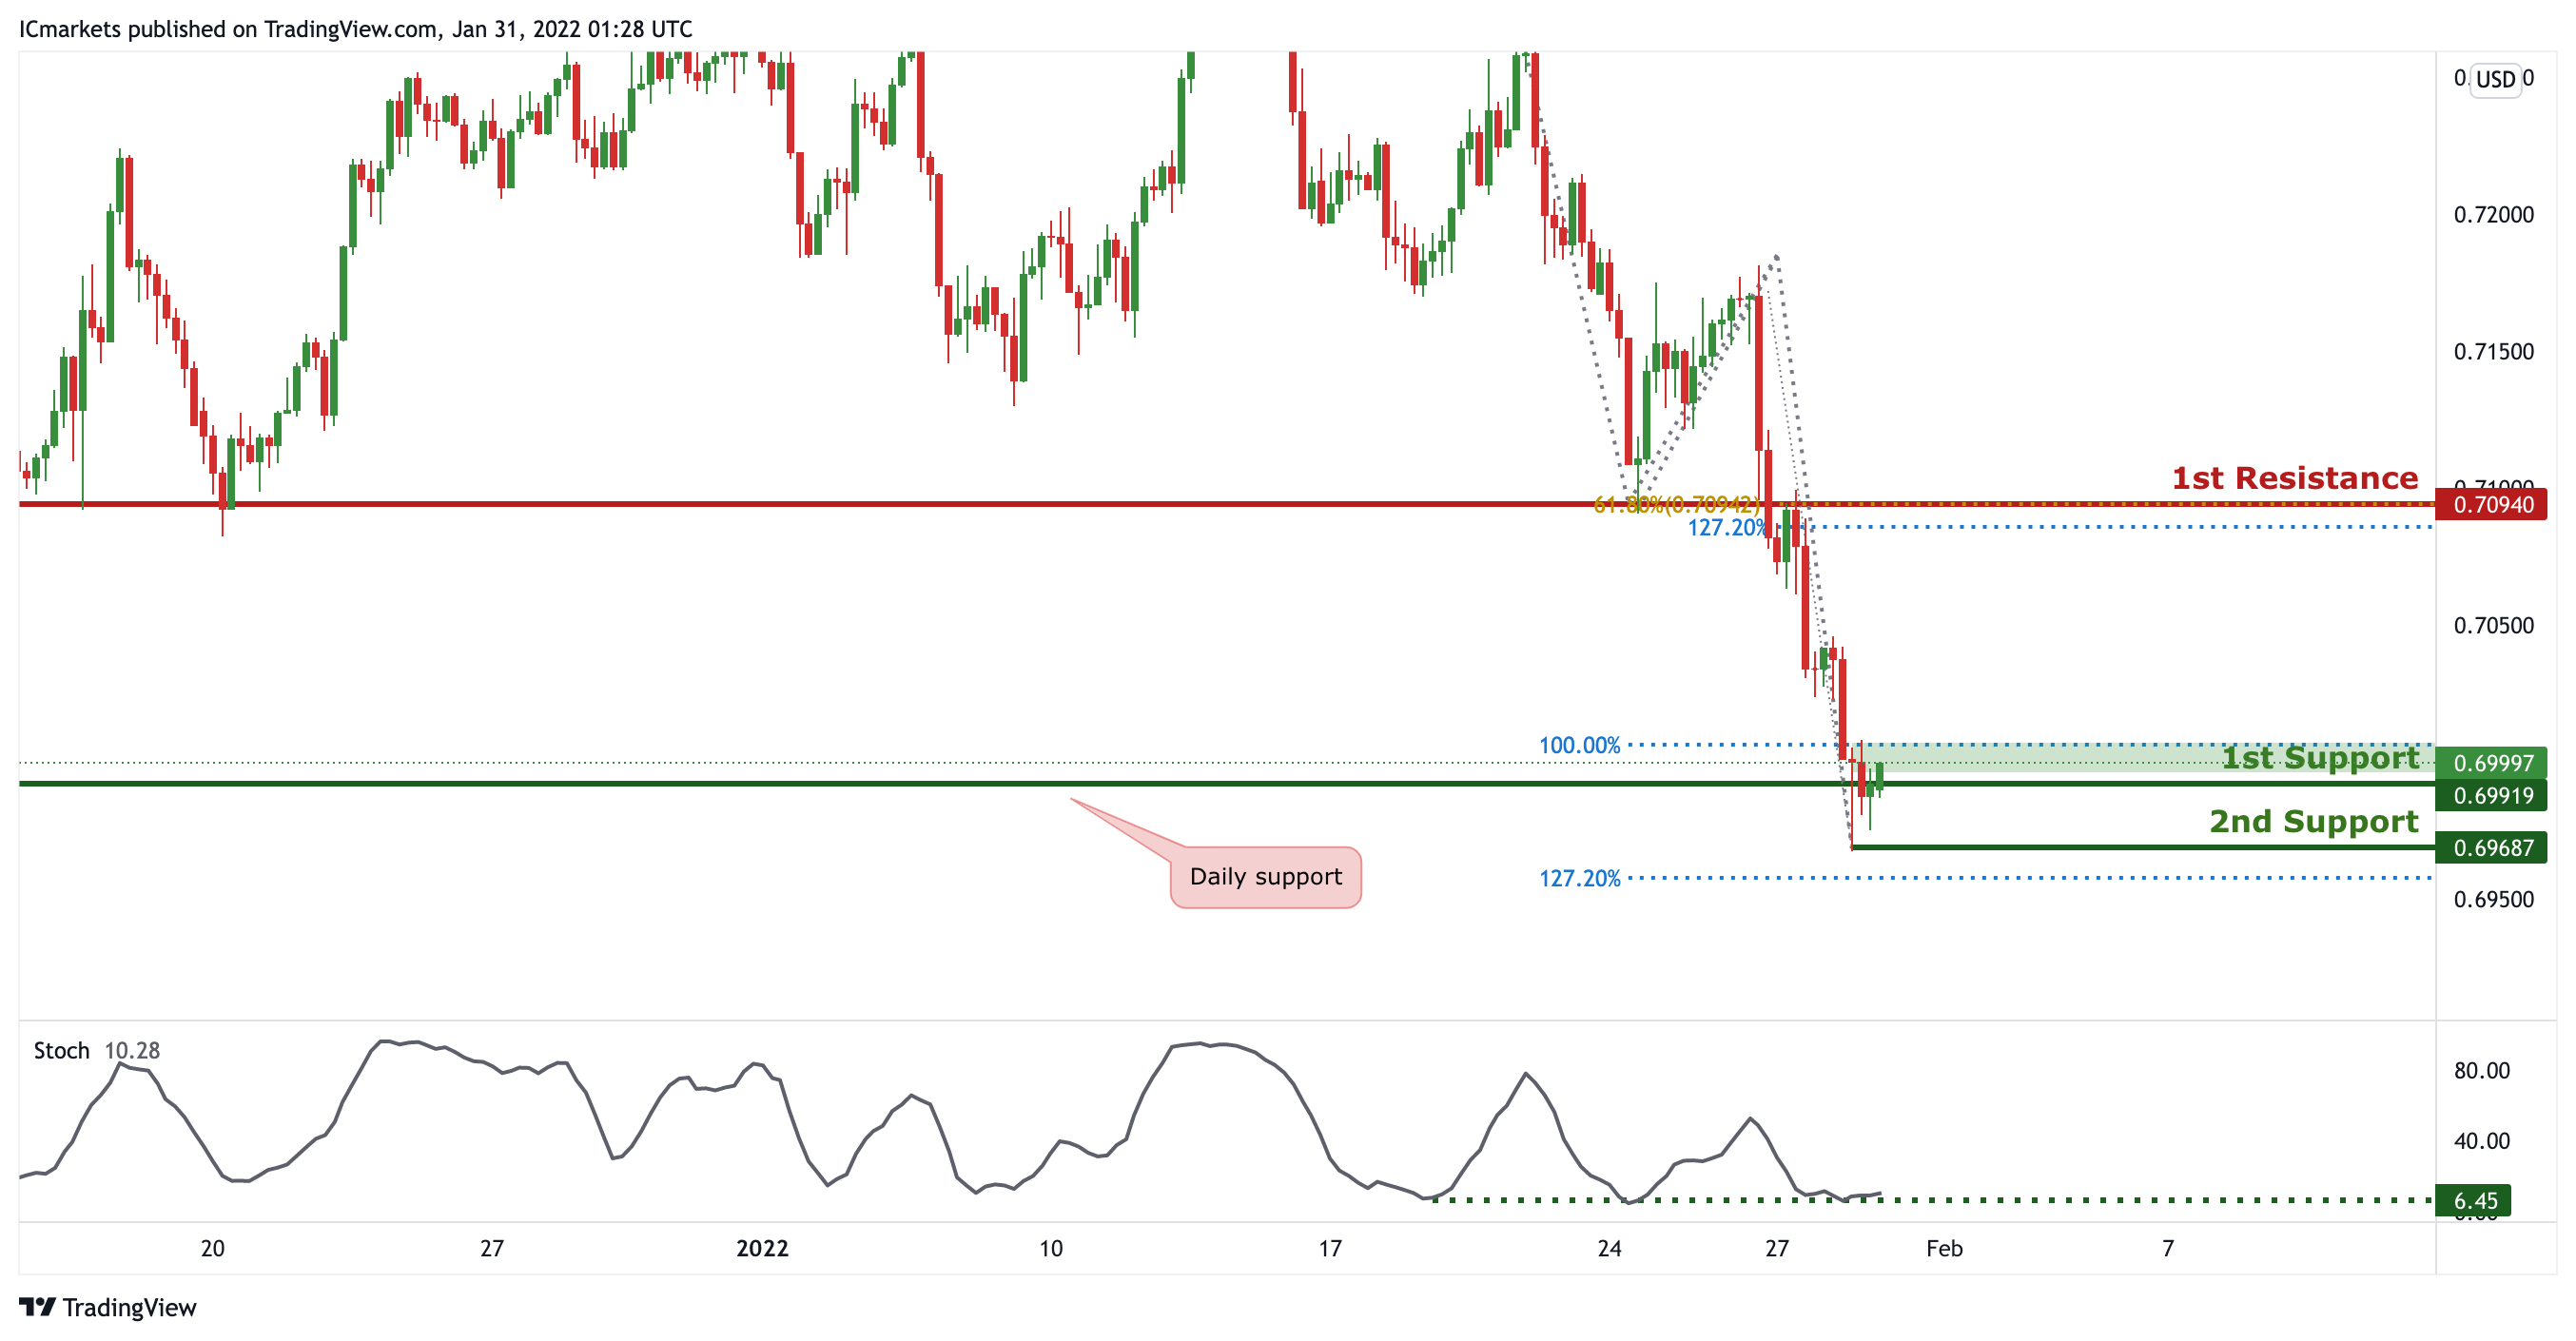
AUD/USD:
On the H4 timeframe, we can see that price is reacting at the daily support level. We can expect price to make a bounce from the 1st Support level in line with 100% Fibonacci projection towards 1st resistance in line with 61.8% Fibonacci retracement and 127.2% Fibonacci projection. Our bullish bias is further supported by the stochastic indicator where the %K line is at the support level.
Areas of consideration:
- H4 1st Support level 0.69919
- H4 1st resistance level 0.69687
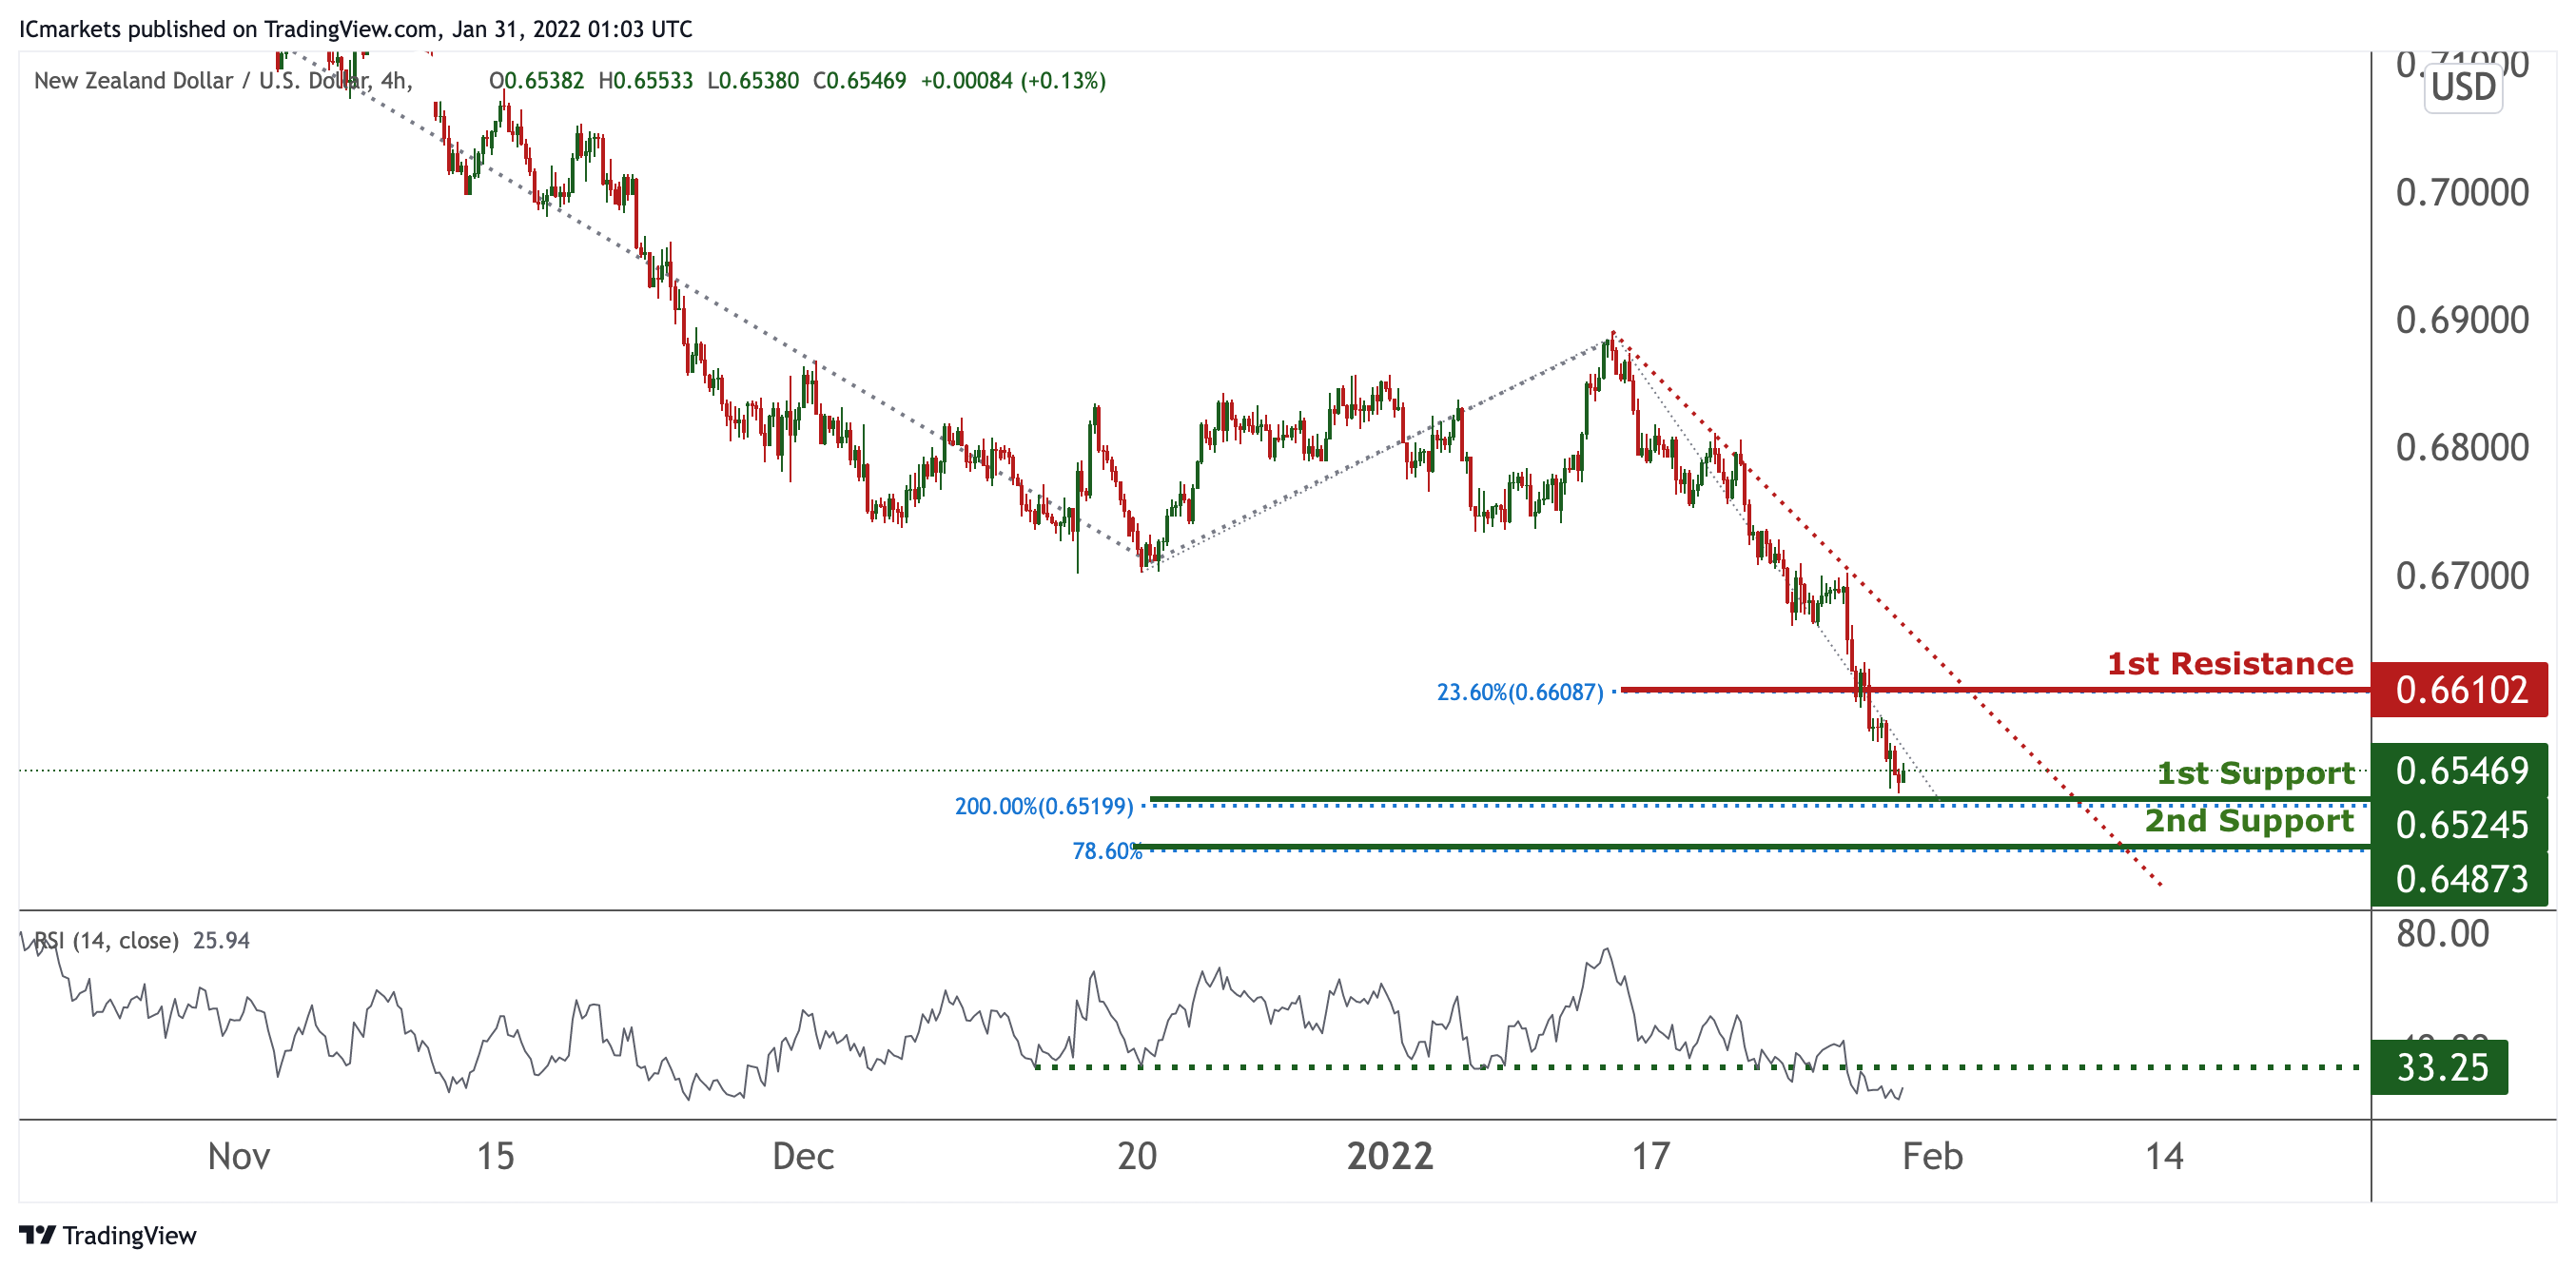
NZD/USD:
On the H4, prices are on bearish momentum and abiding to our bearish trendline. We see the potential for a short bounce from our 1st support at 0.65245 in line with 200% Fibonacci projection towards our 1st resistance at 0.66102 in line with 23.6% Fibonacci retracement. RSI is at a level where bounces occurred previously.
Areas of consideration:
- H4 time frame, 1st resistance at 0.66102
- H4 time frame, 1st support at 0.65245
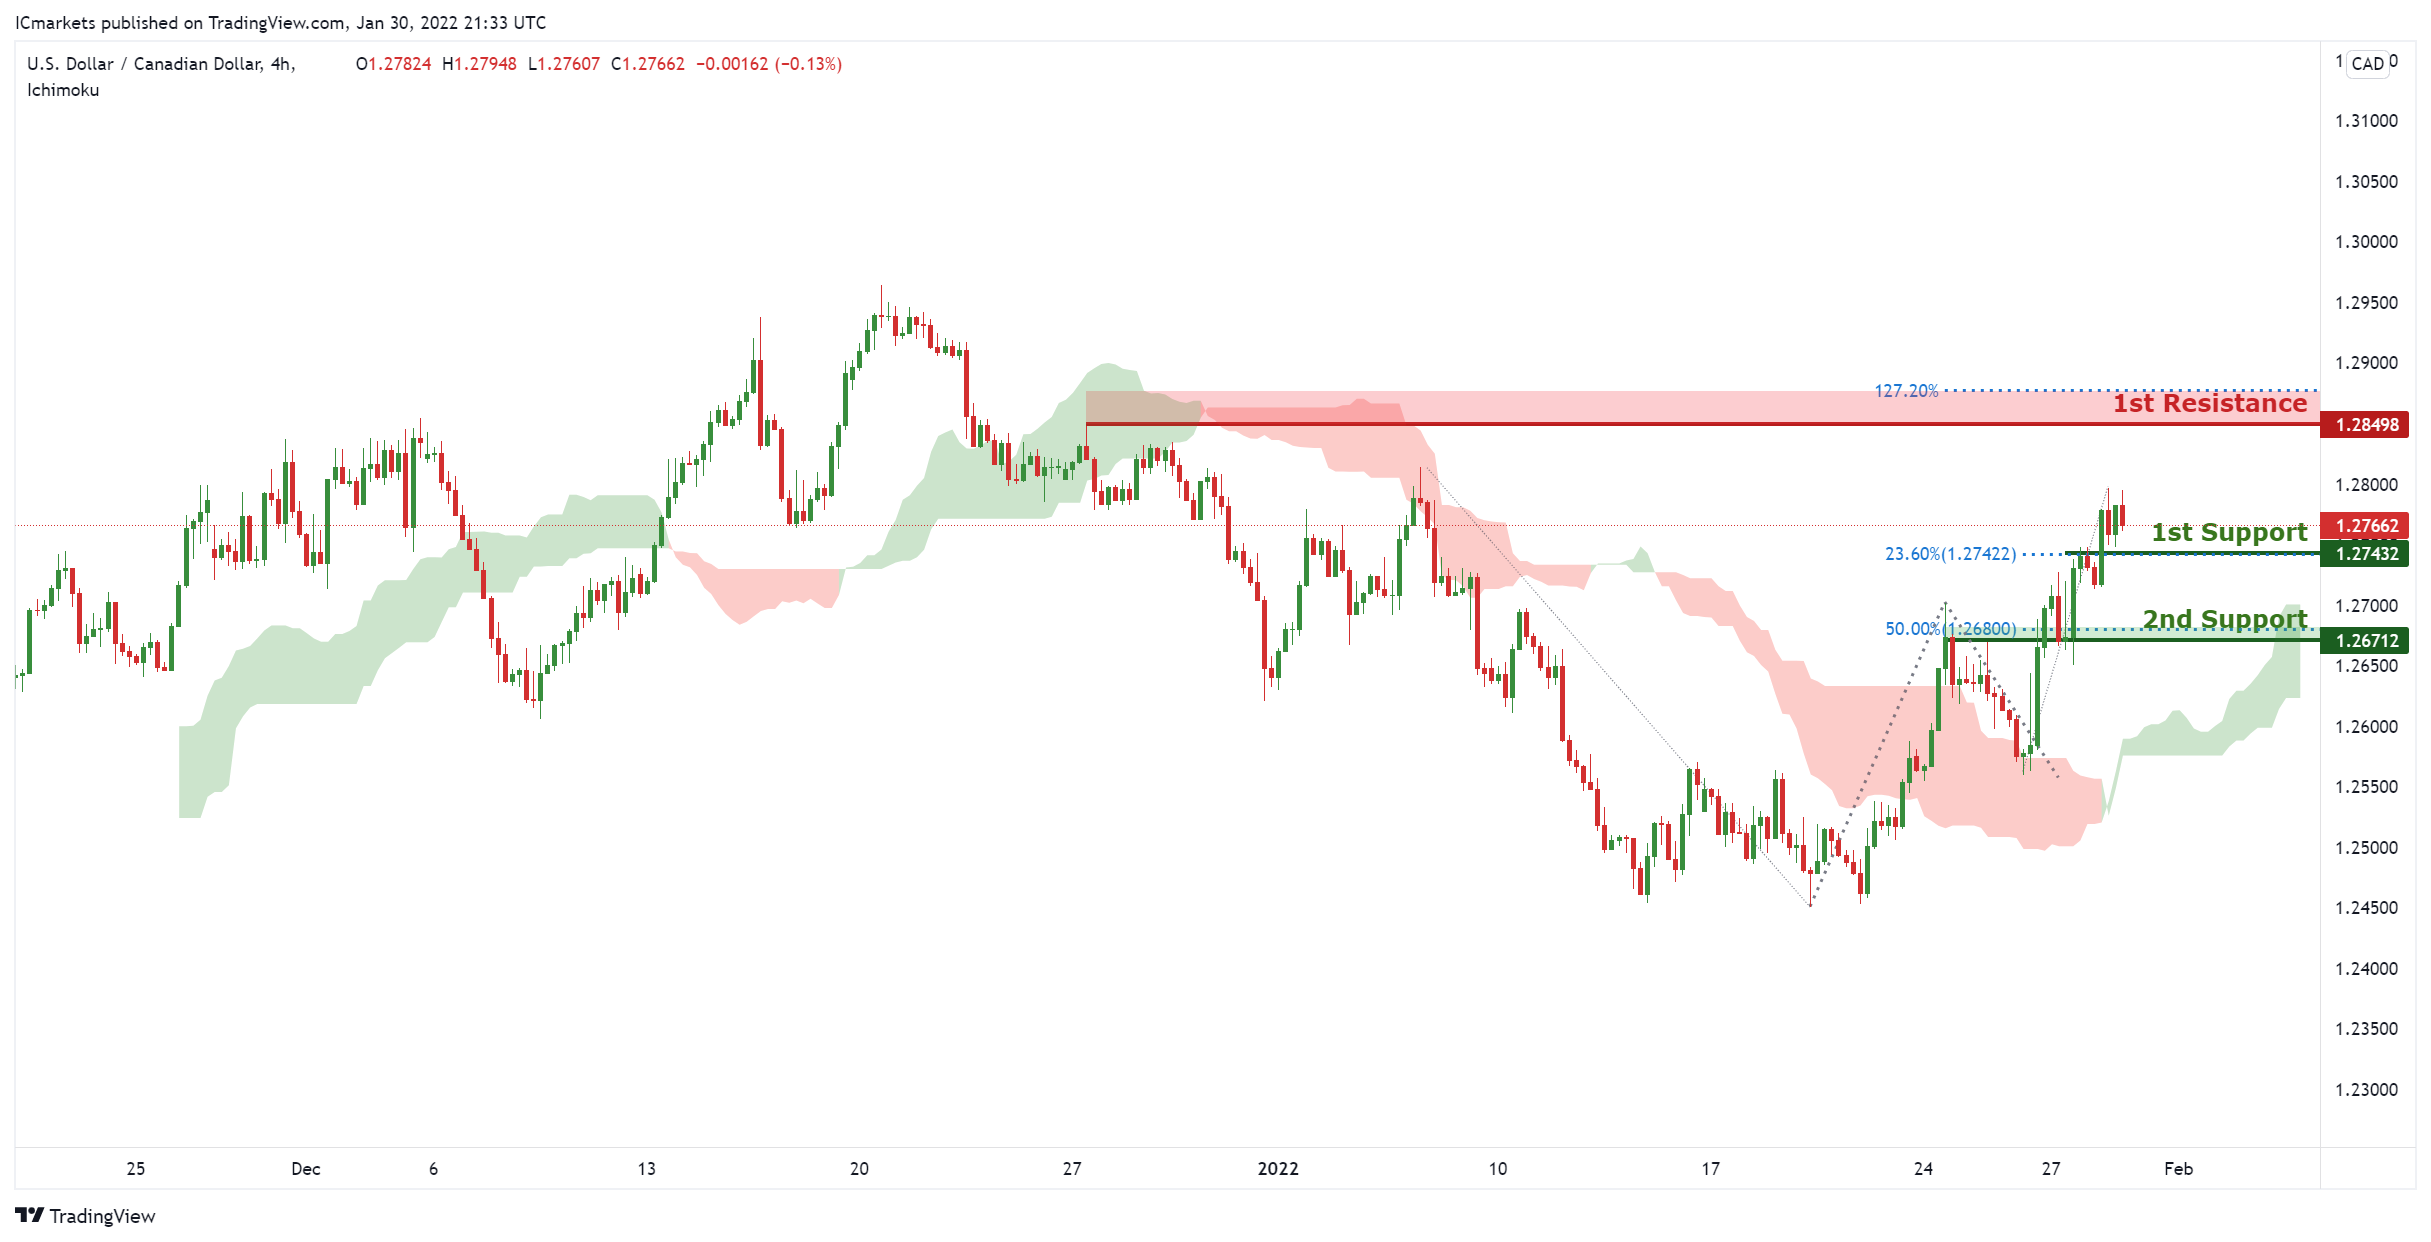
USD/CAD:
On the H4, with prices moving above the ichimoku cloud, we see the potential for a bounce from our 1st support at 1.27432 in line with Horizontal overlap support and 23.6% Fibonacci retracement towards our 1st resistance at 1.28498 in line with horizontal swing high resistance and 127.2% Fibonacci extension. Alternatively, price may break 1st support structure and head for 2nd support at 1.26712, in line with 50% Fibonacci retracement and horizontal overlap support.
Areas of consideration:
- H4 time frame, 1st support at 1.27432
- H4 time frame, 1st resistance at 1.28498
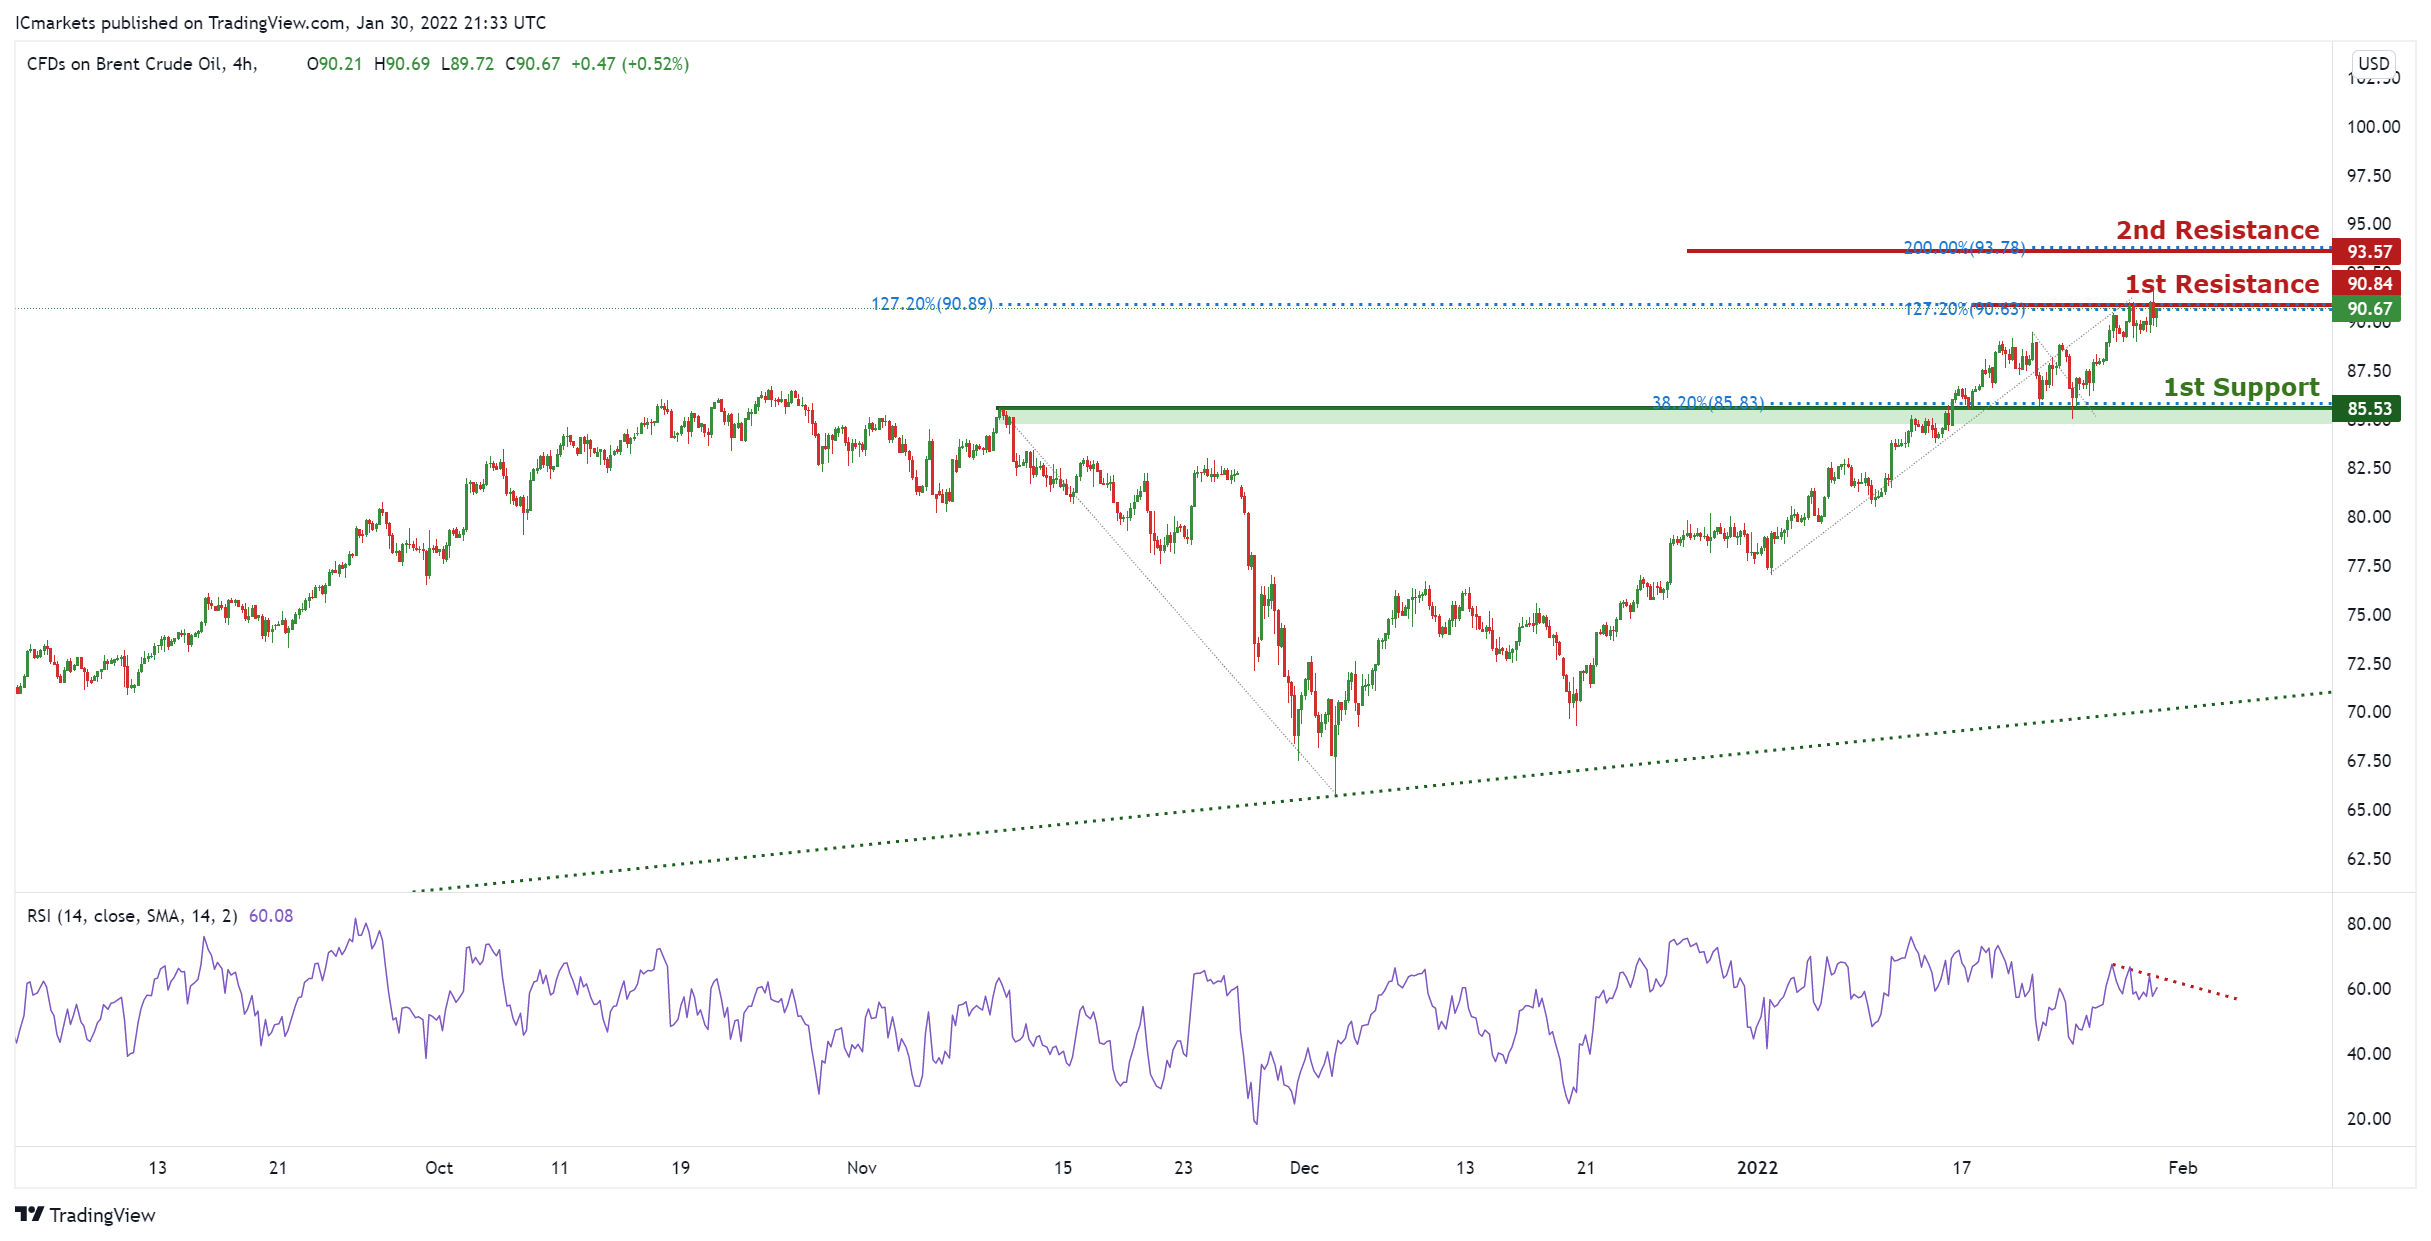
OIL:
On the H4, with price expected to reverse off the resistance on the stochastics indicator, signifying an overall bearish momentum. We can expect price to drop from our 1st resistance at 90.84 in line horizontal graphical swing high resistance and 127.2% Fibonacci extension towards 1st support in line with horizontal overlap support ,38.2% Fibonacci retracement level at 85.53. Alternatively, price may break 1st resistance structure and head for 2nd resistance, which coincides with 200% Fibonacci extension level at 93.57.
Areas of consideration:
- H4 time frame, 1st resistance of 90.84
- H4 time frame, 1st support of 85.53
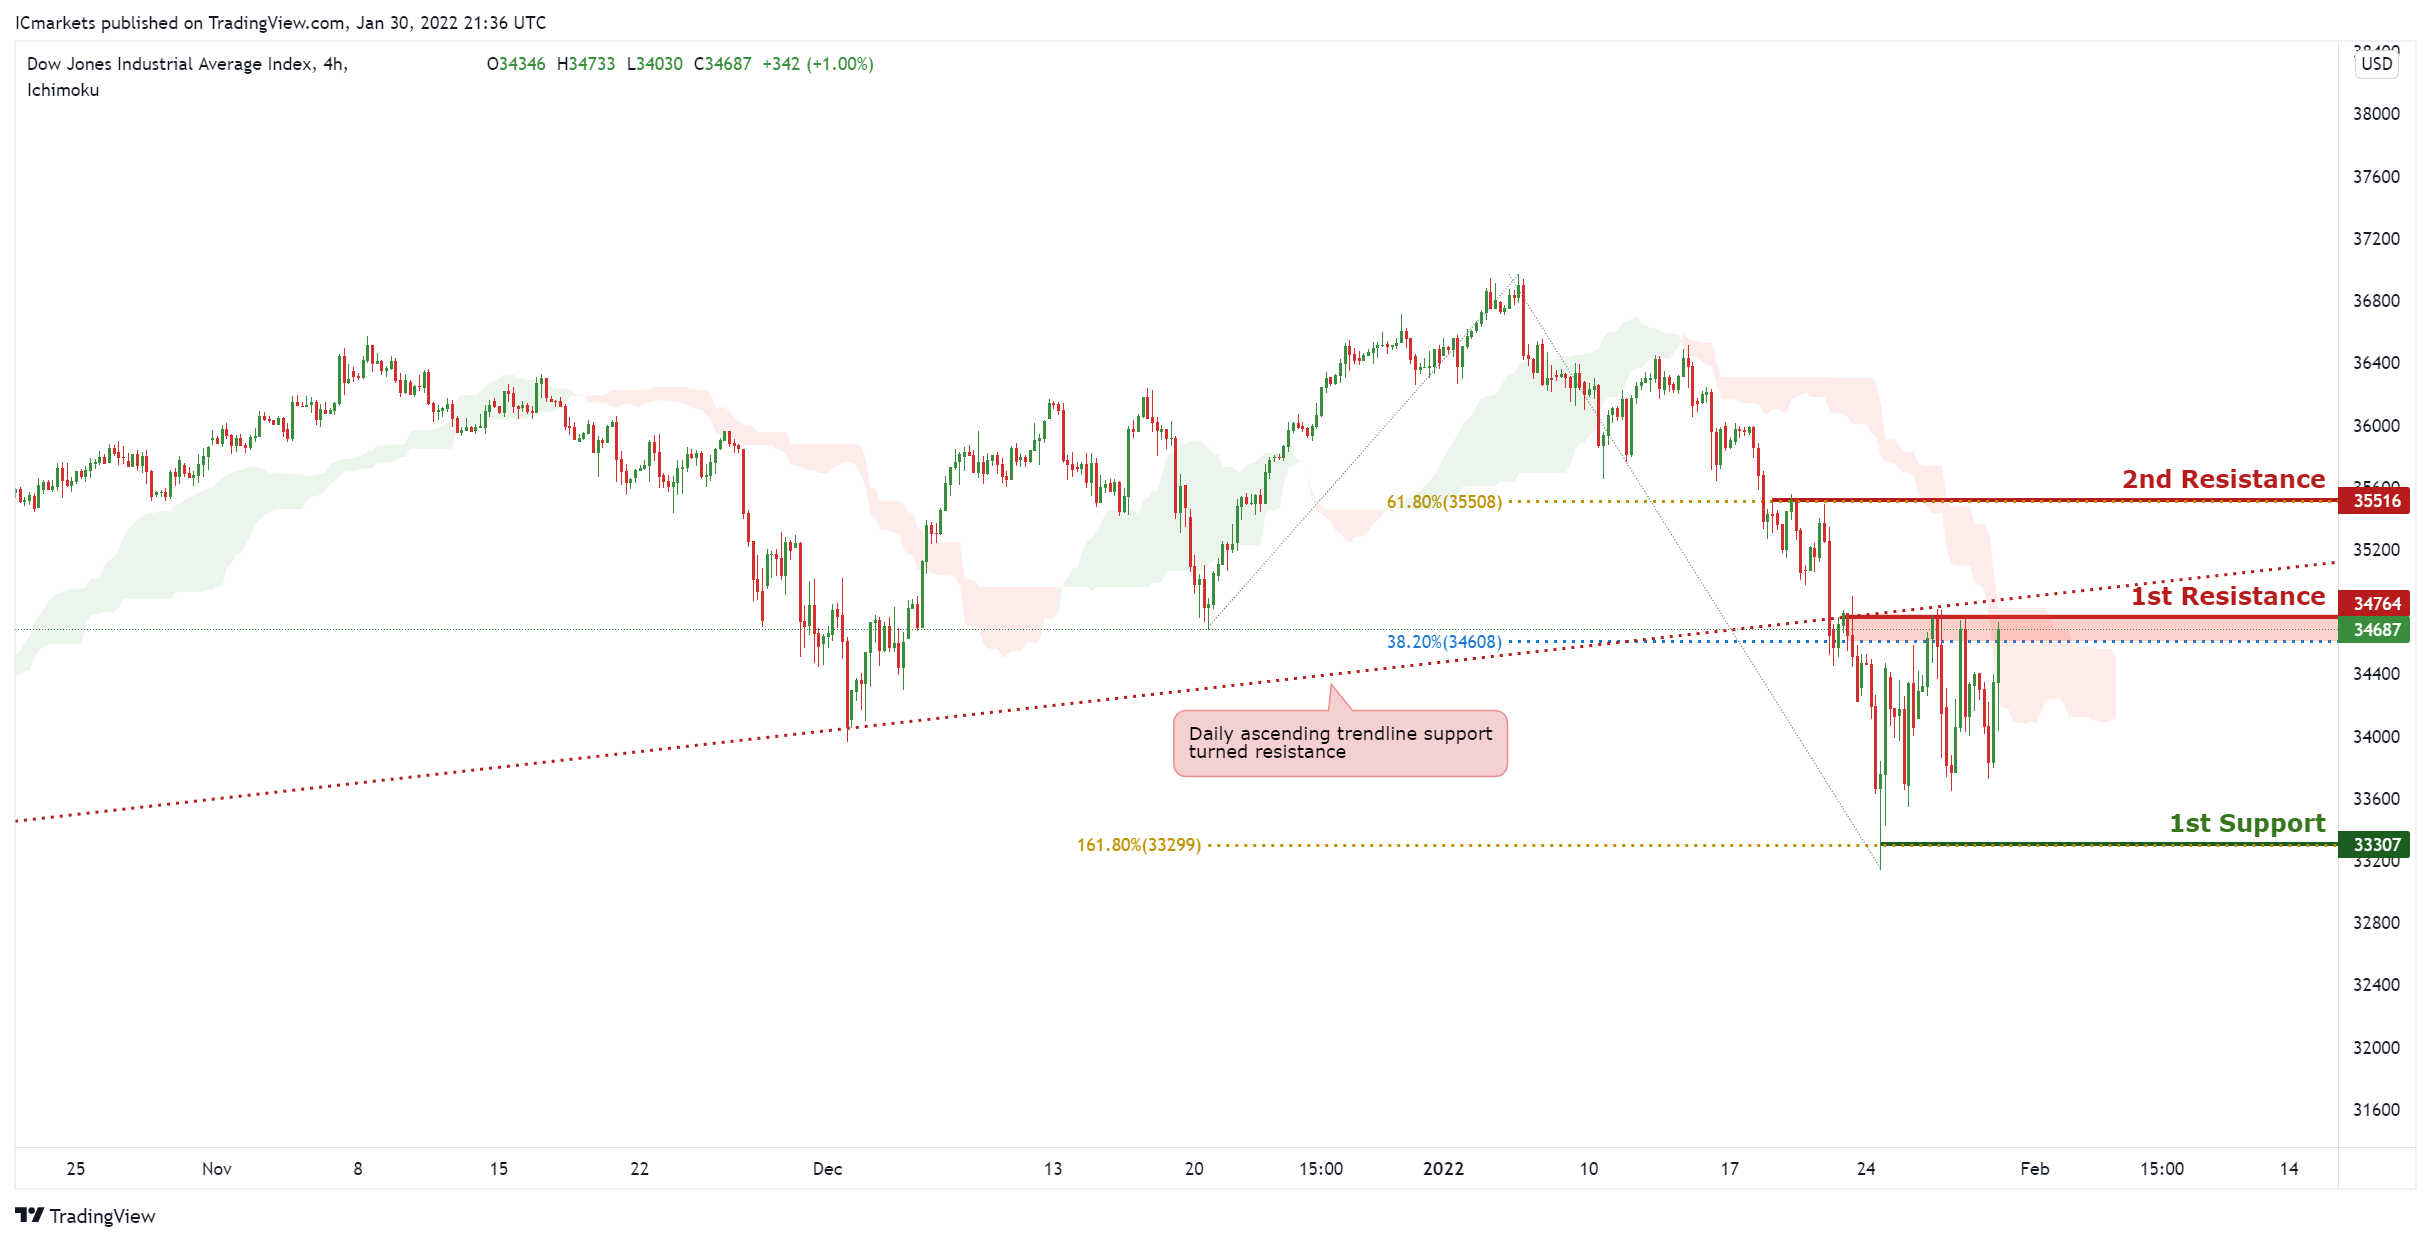
Dow Jones Industrial Average:
On the H4, with price moving below the ichimoku cloud, signifying an overall bearish momentum. We can expect price to drop from our 1st resistance at 34764 in line horizontal graphical overlap and 38.2% Fibonacci retracement towards 1st support in line with horizontal overlap support ,161.8% Fibonacci extension level at 33307. Alternatively, price may break 1st resistance structure and head for 2nd resistance, which coincides with 61.8% Fibonacci retracement at 35516. Traders should wait for price to swing higher or lower before entering.
Areas of consideration:
- H4 time frame, 1st resistance of 34764
- H4 time frame, 1st support of 33307
The accuracy, completeness and timeliness of the information contained on this site cannot be guaranteed. IC Markets does not warranty, guarantee or make any representations, or assume any liability regarding financial results based on the use of the information in the site.
News, views, opinions, recommendations and other information obtained from sources outside of www.icmarkets.com.au, used in this site are believed to be reliable, but we cannot guarantee their accuracy or completeness. All such information is subject to change at any time without notice. IC Markets assumes no responsibility for the content of any linked site.
The fact that such links may exist does not indicate approval or endorsement of any material contained on any linked site. IC Markets is not liable for any harm caused by the transmission, through accessing the services or information on this site, of a computer virus, or other computer code or programming device that might be used to access, delete, damage, disable, disrupt or otherwise impede in any manner, the operation of the site or of any user’s software, hardware, data or property.


