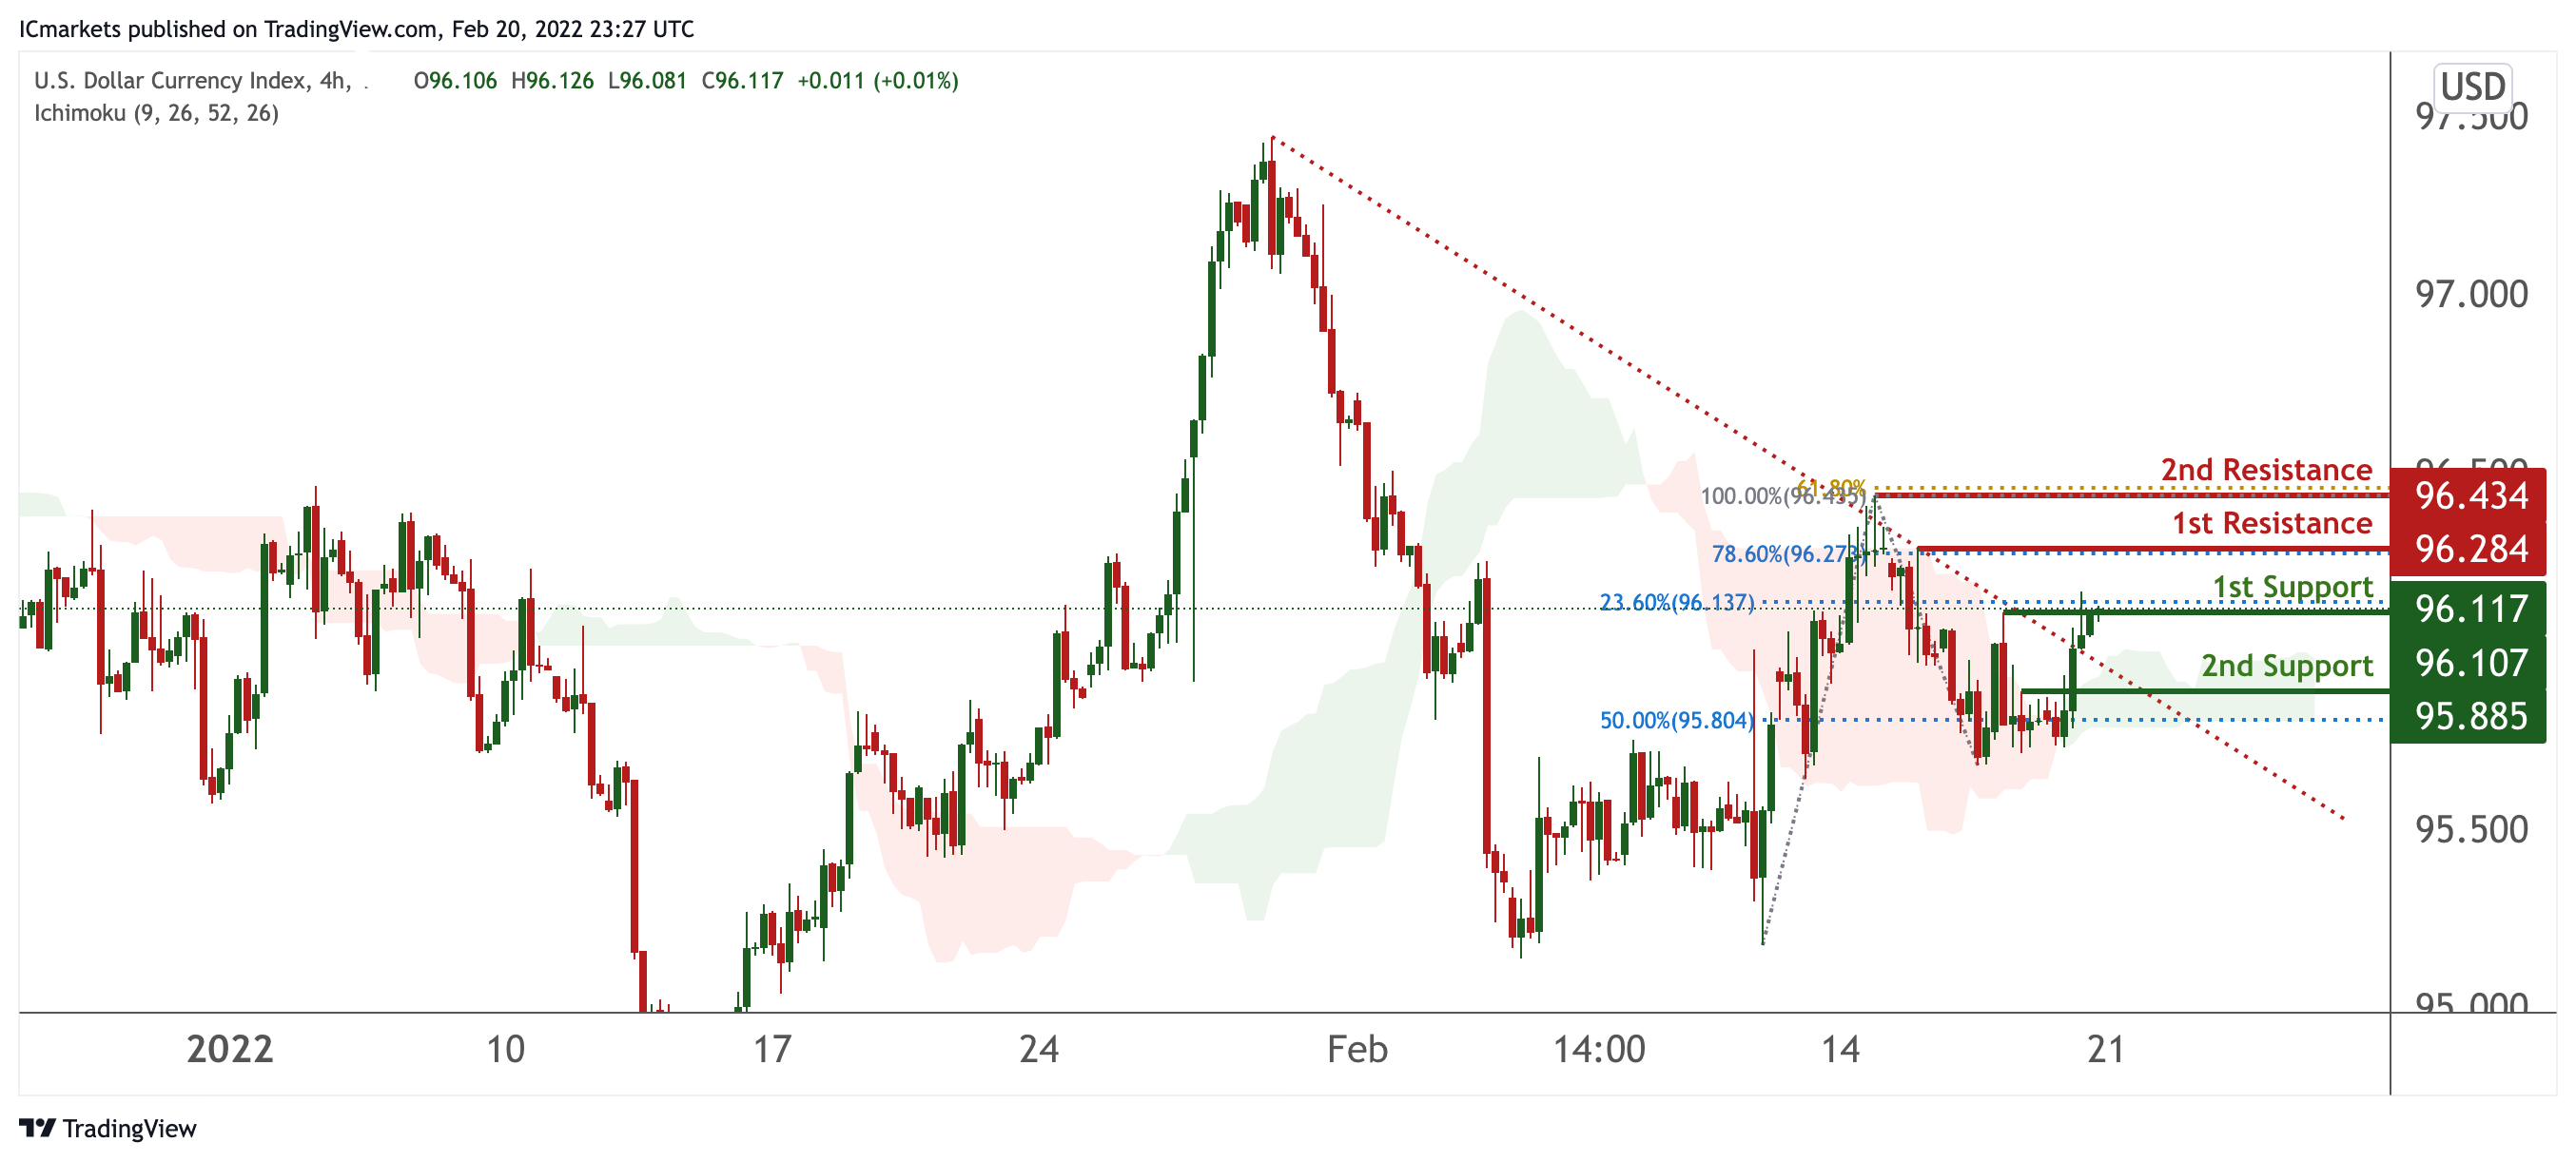
DXY:
On the H4, prices are on bullish momentum and have recently broken out of our daily descending trendline. We see potential for bullish continuation from our 1st support at 96.106 in line with 23.6% Fibonacci retracement towards our 1st resistance at 97.297 in line with 78.6% Fibonacci extension. Prices are trading above our Ichimoku Cloud support, further supporting our bullish bias.
Areas of consideration:
- H4 time frame, 1st resistance at 96.284
- H4 time frame, 1st support at 96.117
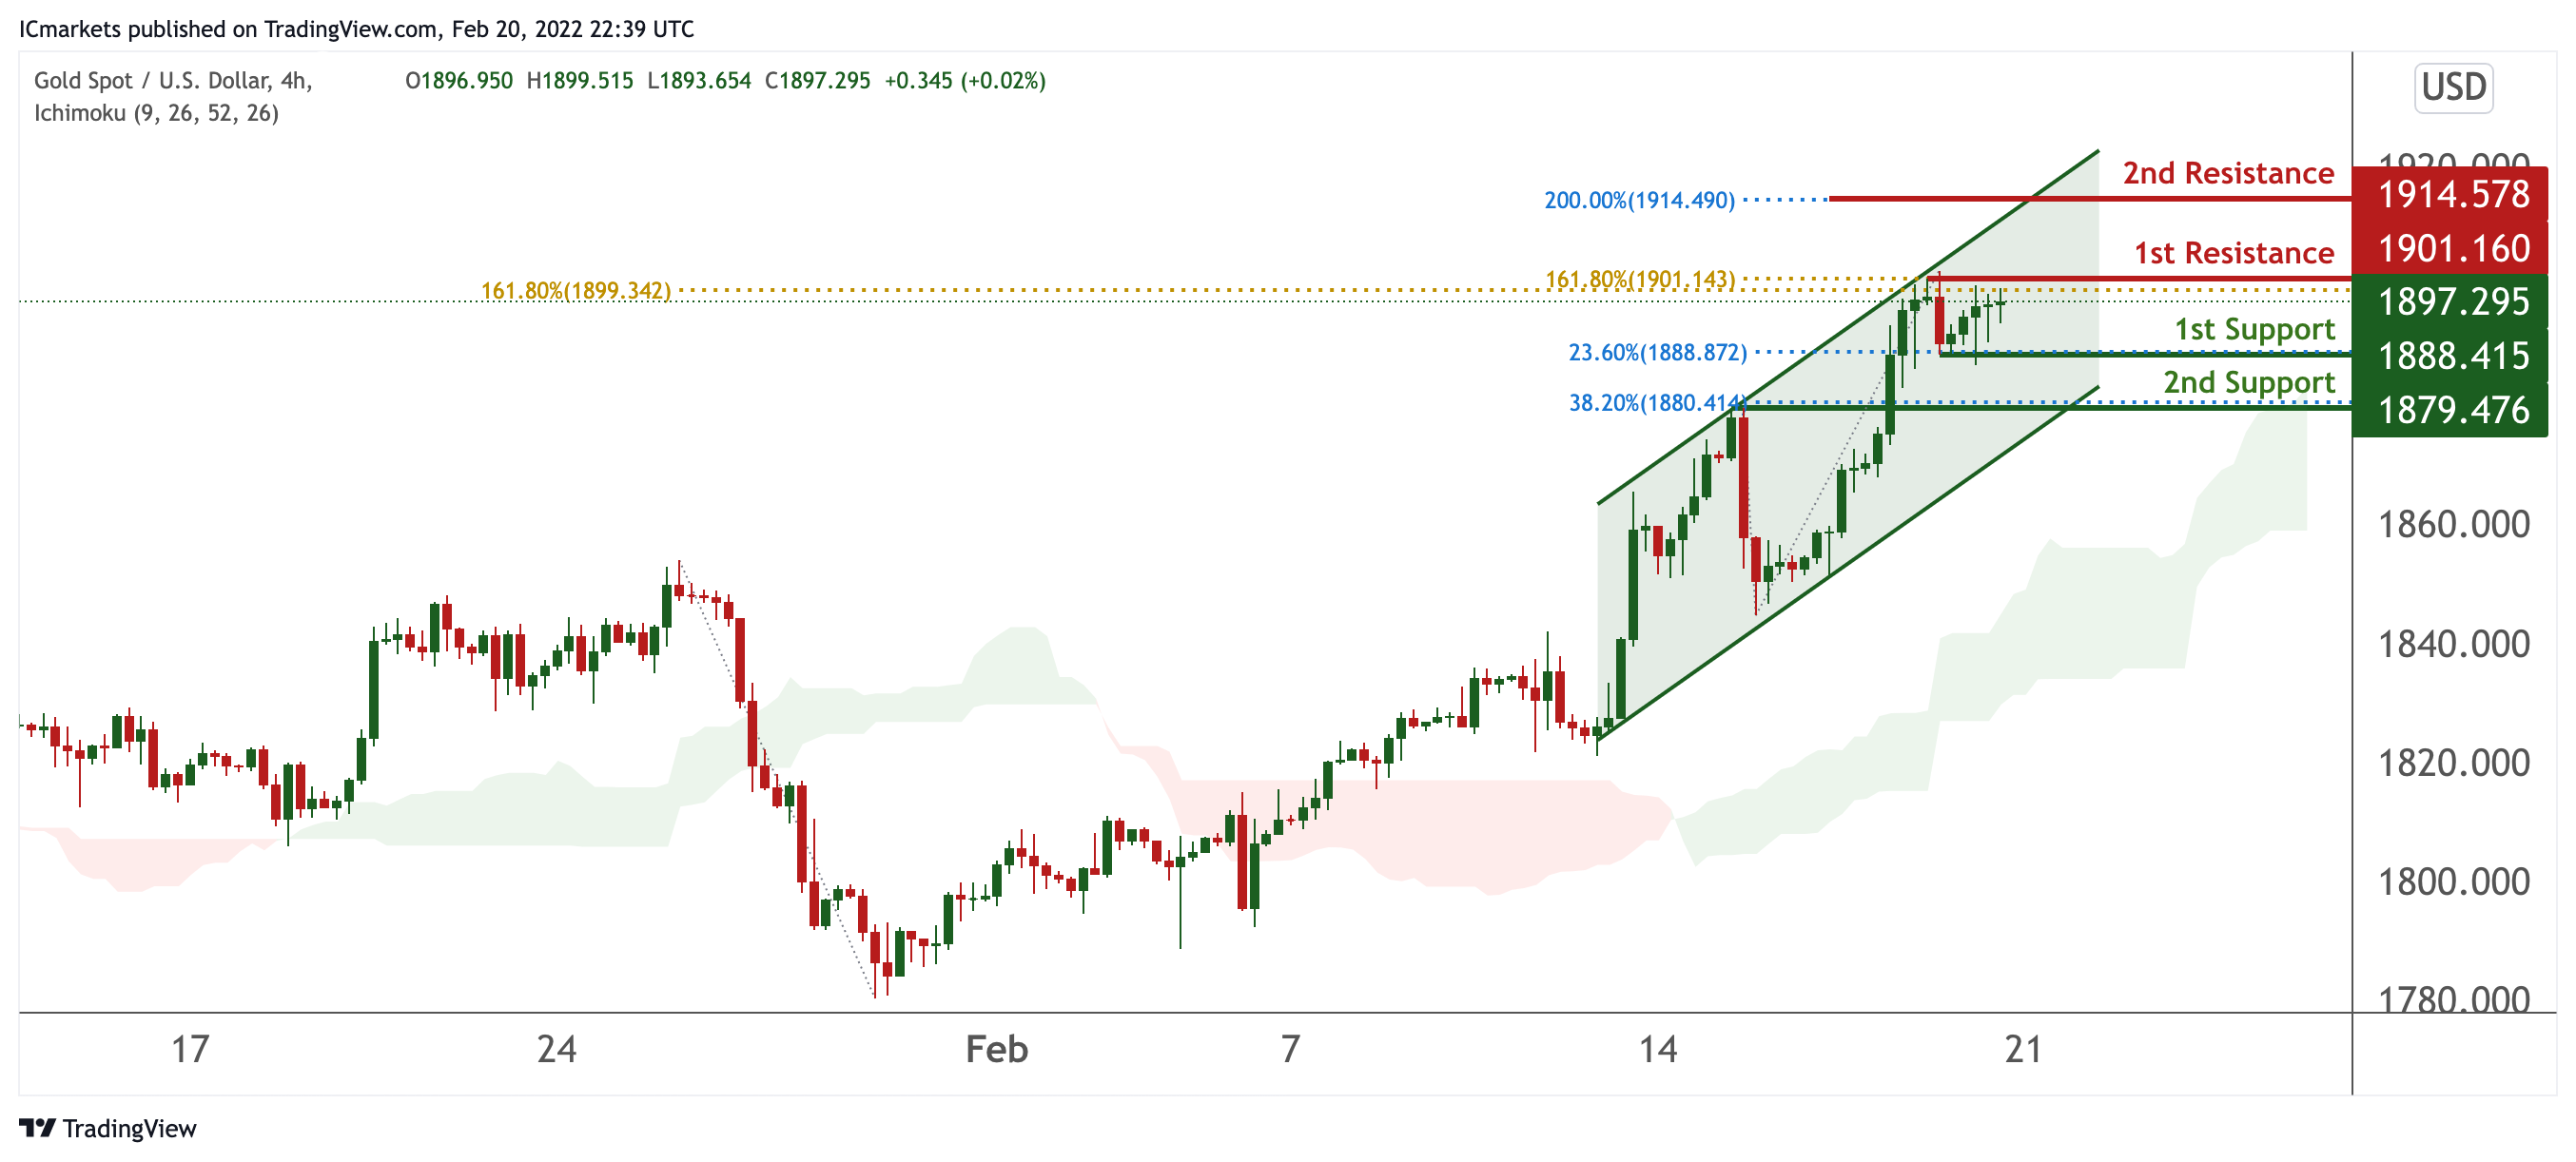
XAU/USD (GOLD):
On the H4 chart, prices are on bullish momentum and abiding to our ascending channel. We see potential for bullish continuation from our 1st support at 1888.415 in line with 23.6% Fibonacci retracement towards our 1st resistance at 1901.160 in line with 161.8% Fibonacci Projection and 161.8% Fibonacci Extension. Prices are trading above our Ichimoku support, further supporting our bullish bias.
Areas of consideration:
- 4h 1st support at 1888.415
- 4h 1st resistance at 1901.160
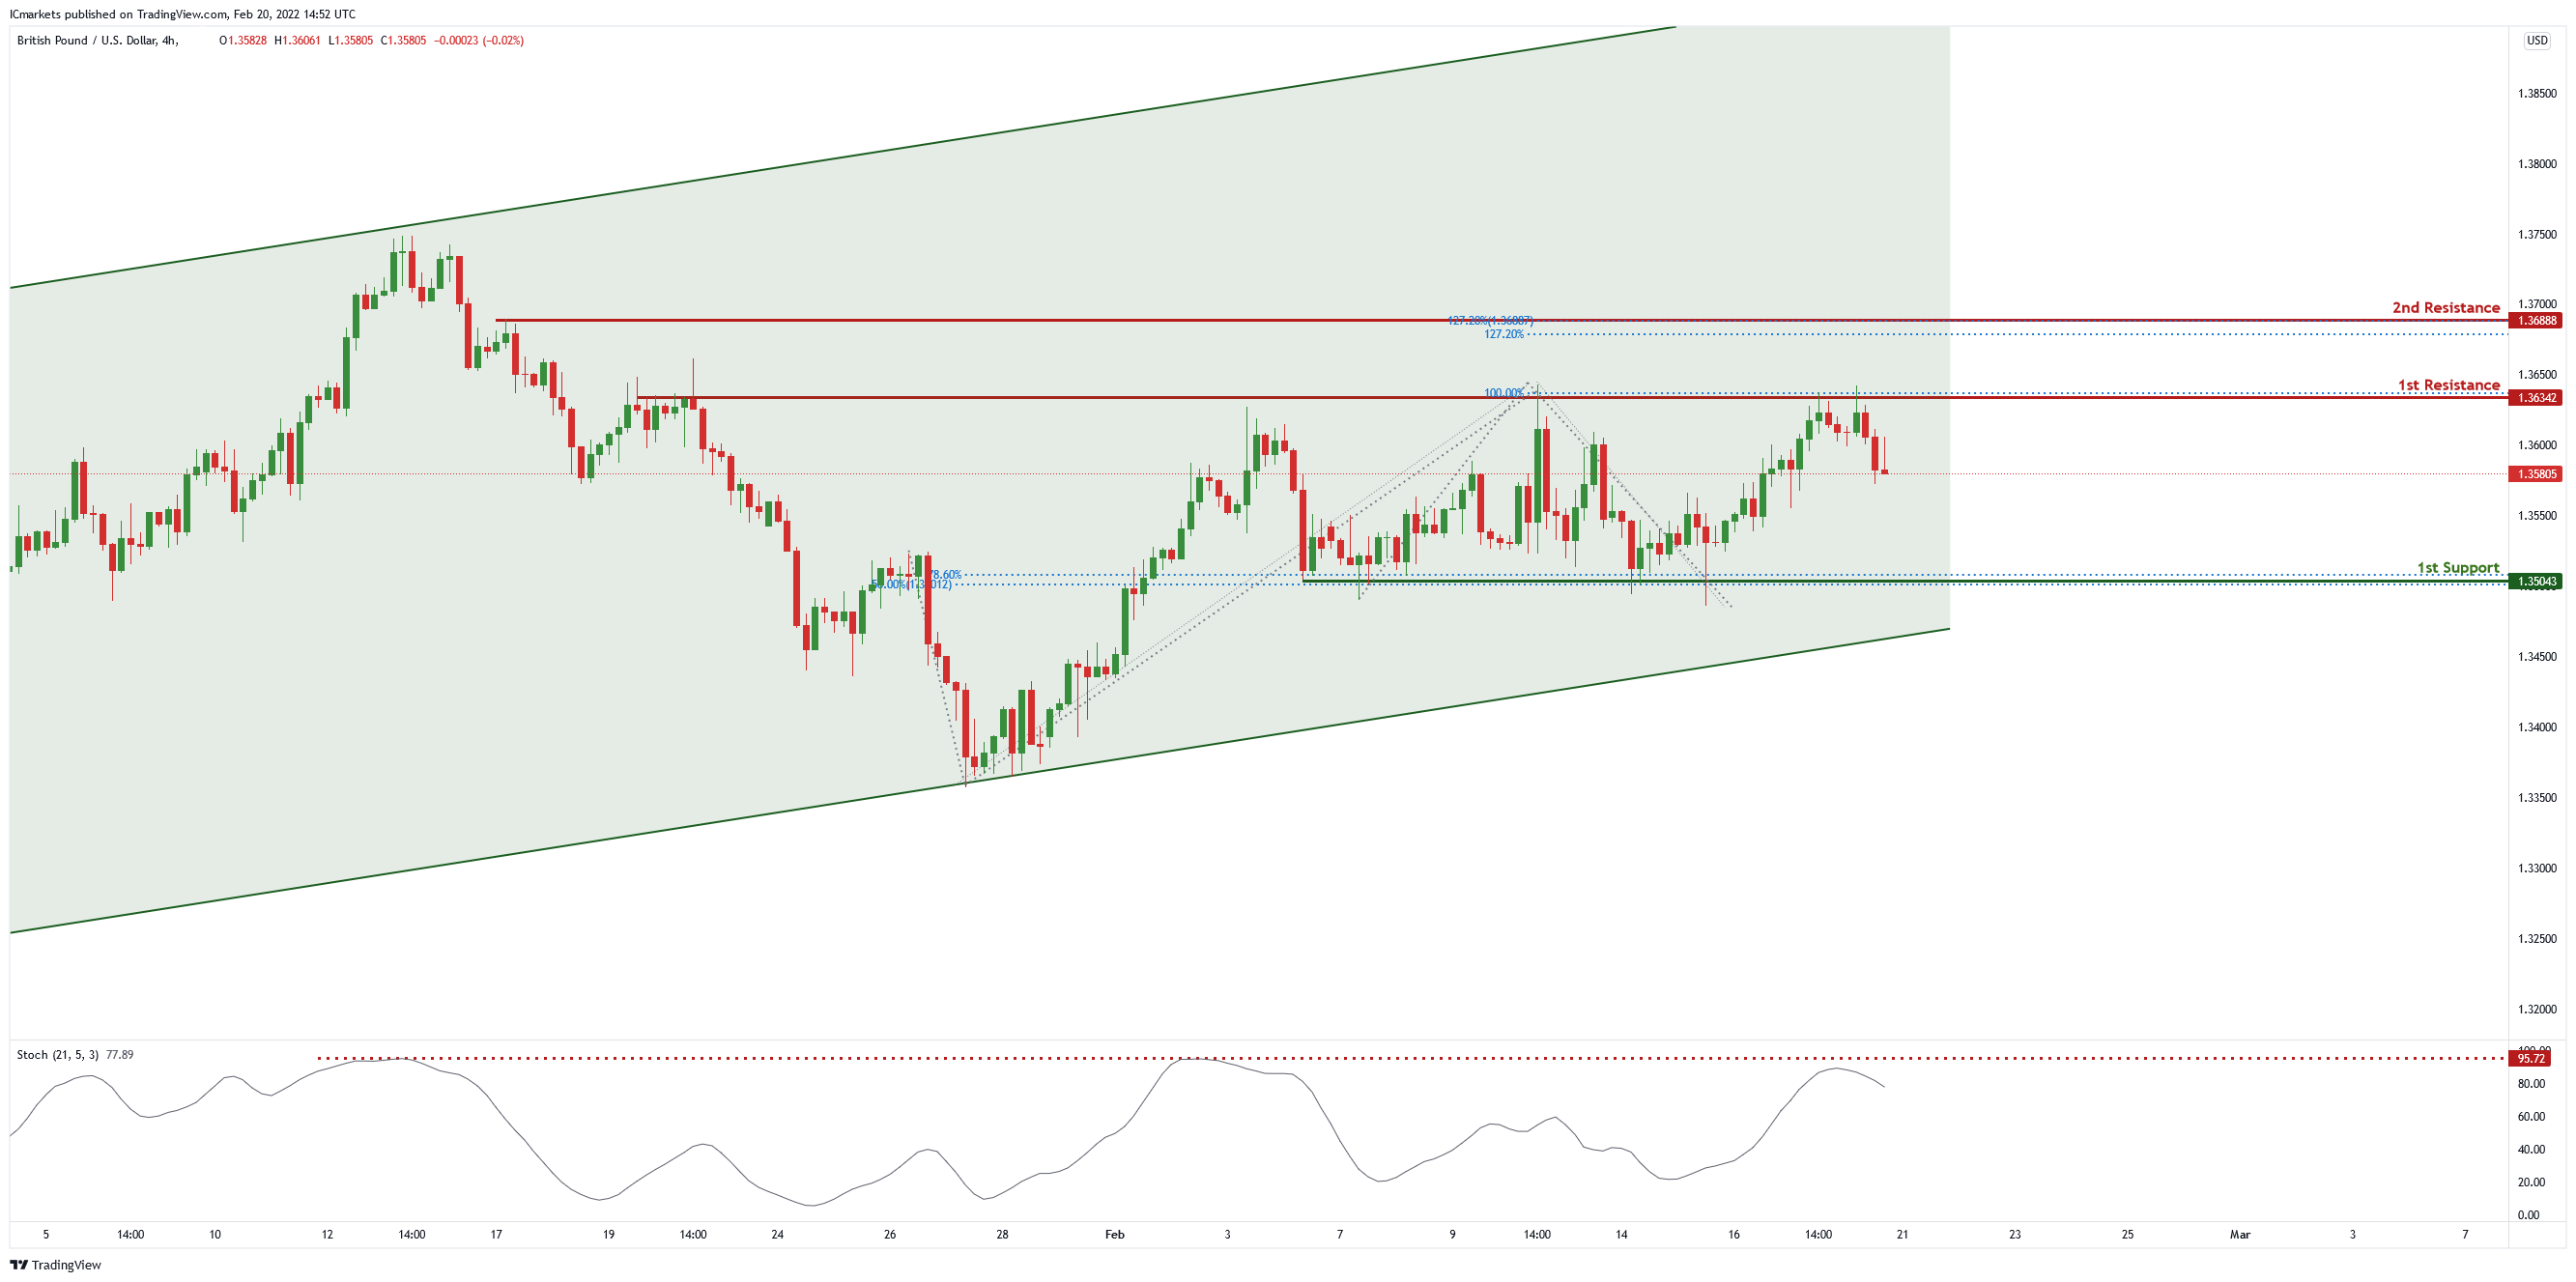
GBP/USD
On the H4 chart , price is near 1st resistance level of 1.36342 in line with 61.8% Fibonacci retracement and 100% Fibonacci projection. Price can potentially dip to the take profit level of 1.35043 in line with 50% Fibonacci retracement and 78.6% Fibonacci projection . Our bearish bias is supported by the stochastic indicator as it is near resistance level.
Areas of consideration
- H4 1st resistance at 1.36342
- H4 1st support at 1.35043
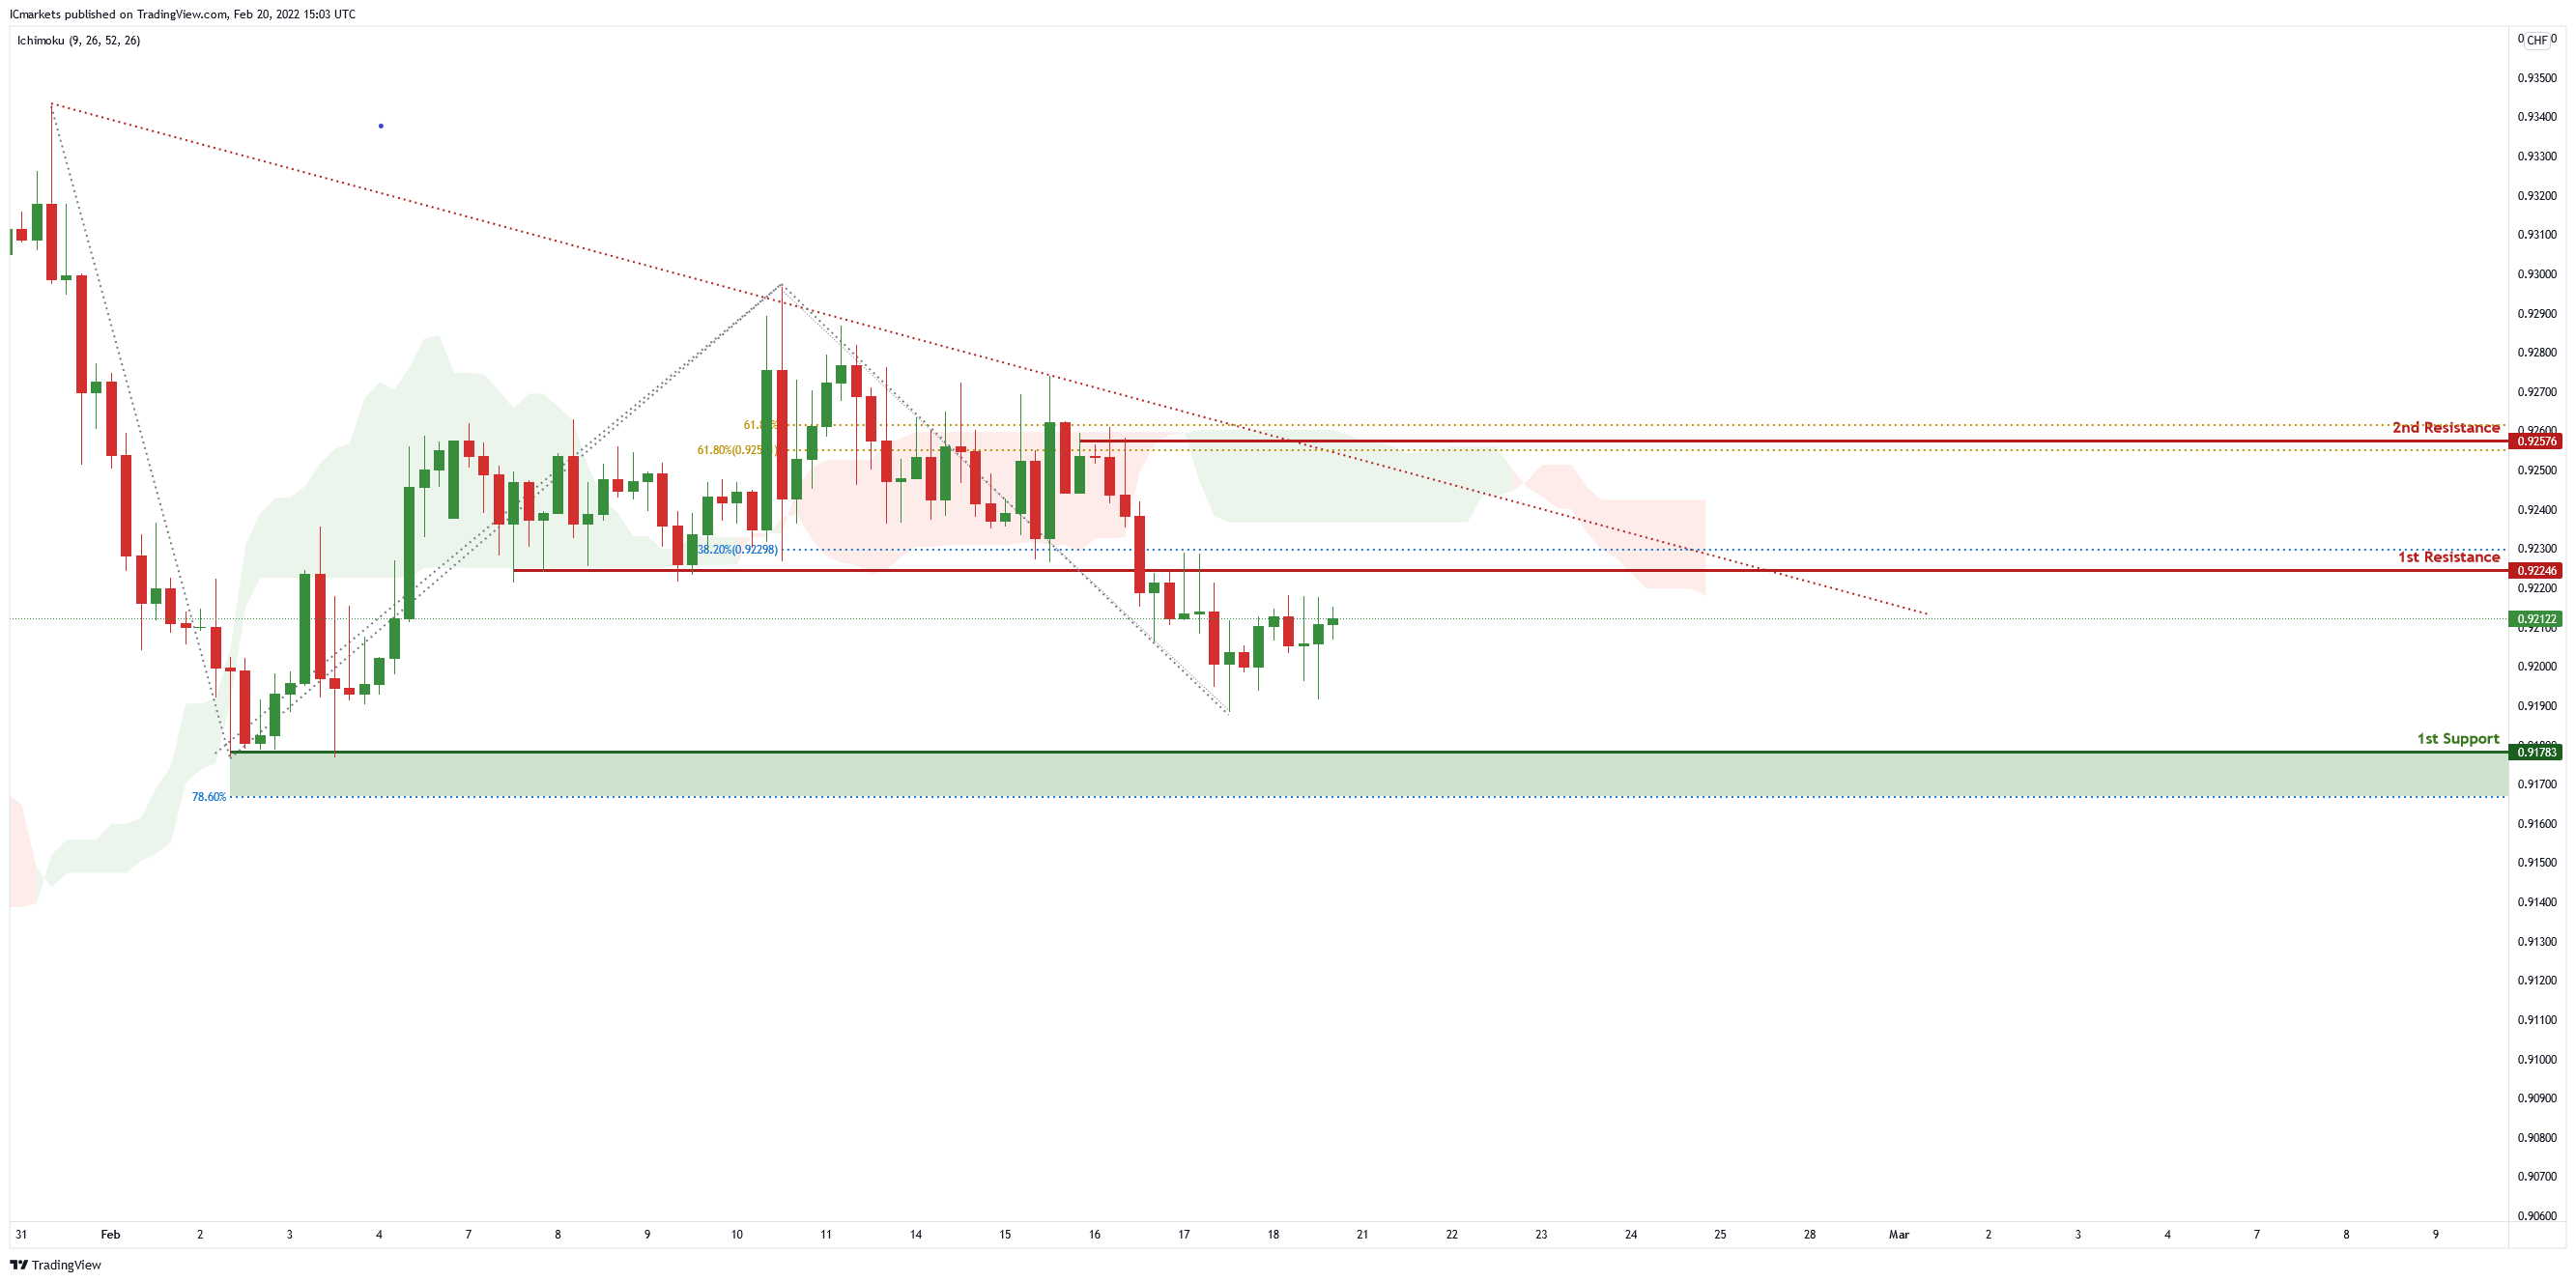
USD/CHF:
On the H4 chart, price is abiding by a descending channel and near 1st resistance level of 0.92246 in line with 38.2% Fibonacci retracement. Price can potentially dip to the 1st support level of 0.91783 in line with 78.6% Fibonacci projection. Our bearish bias is supported by the ichimoku cloud indicator as price is trading below it.
Areas of consideration :
- H4 1st resistance at 0.92246
- H4 1st support at 0.91783
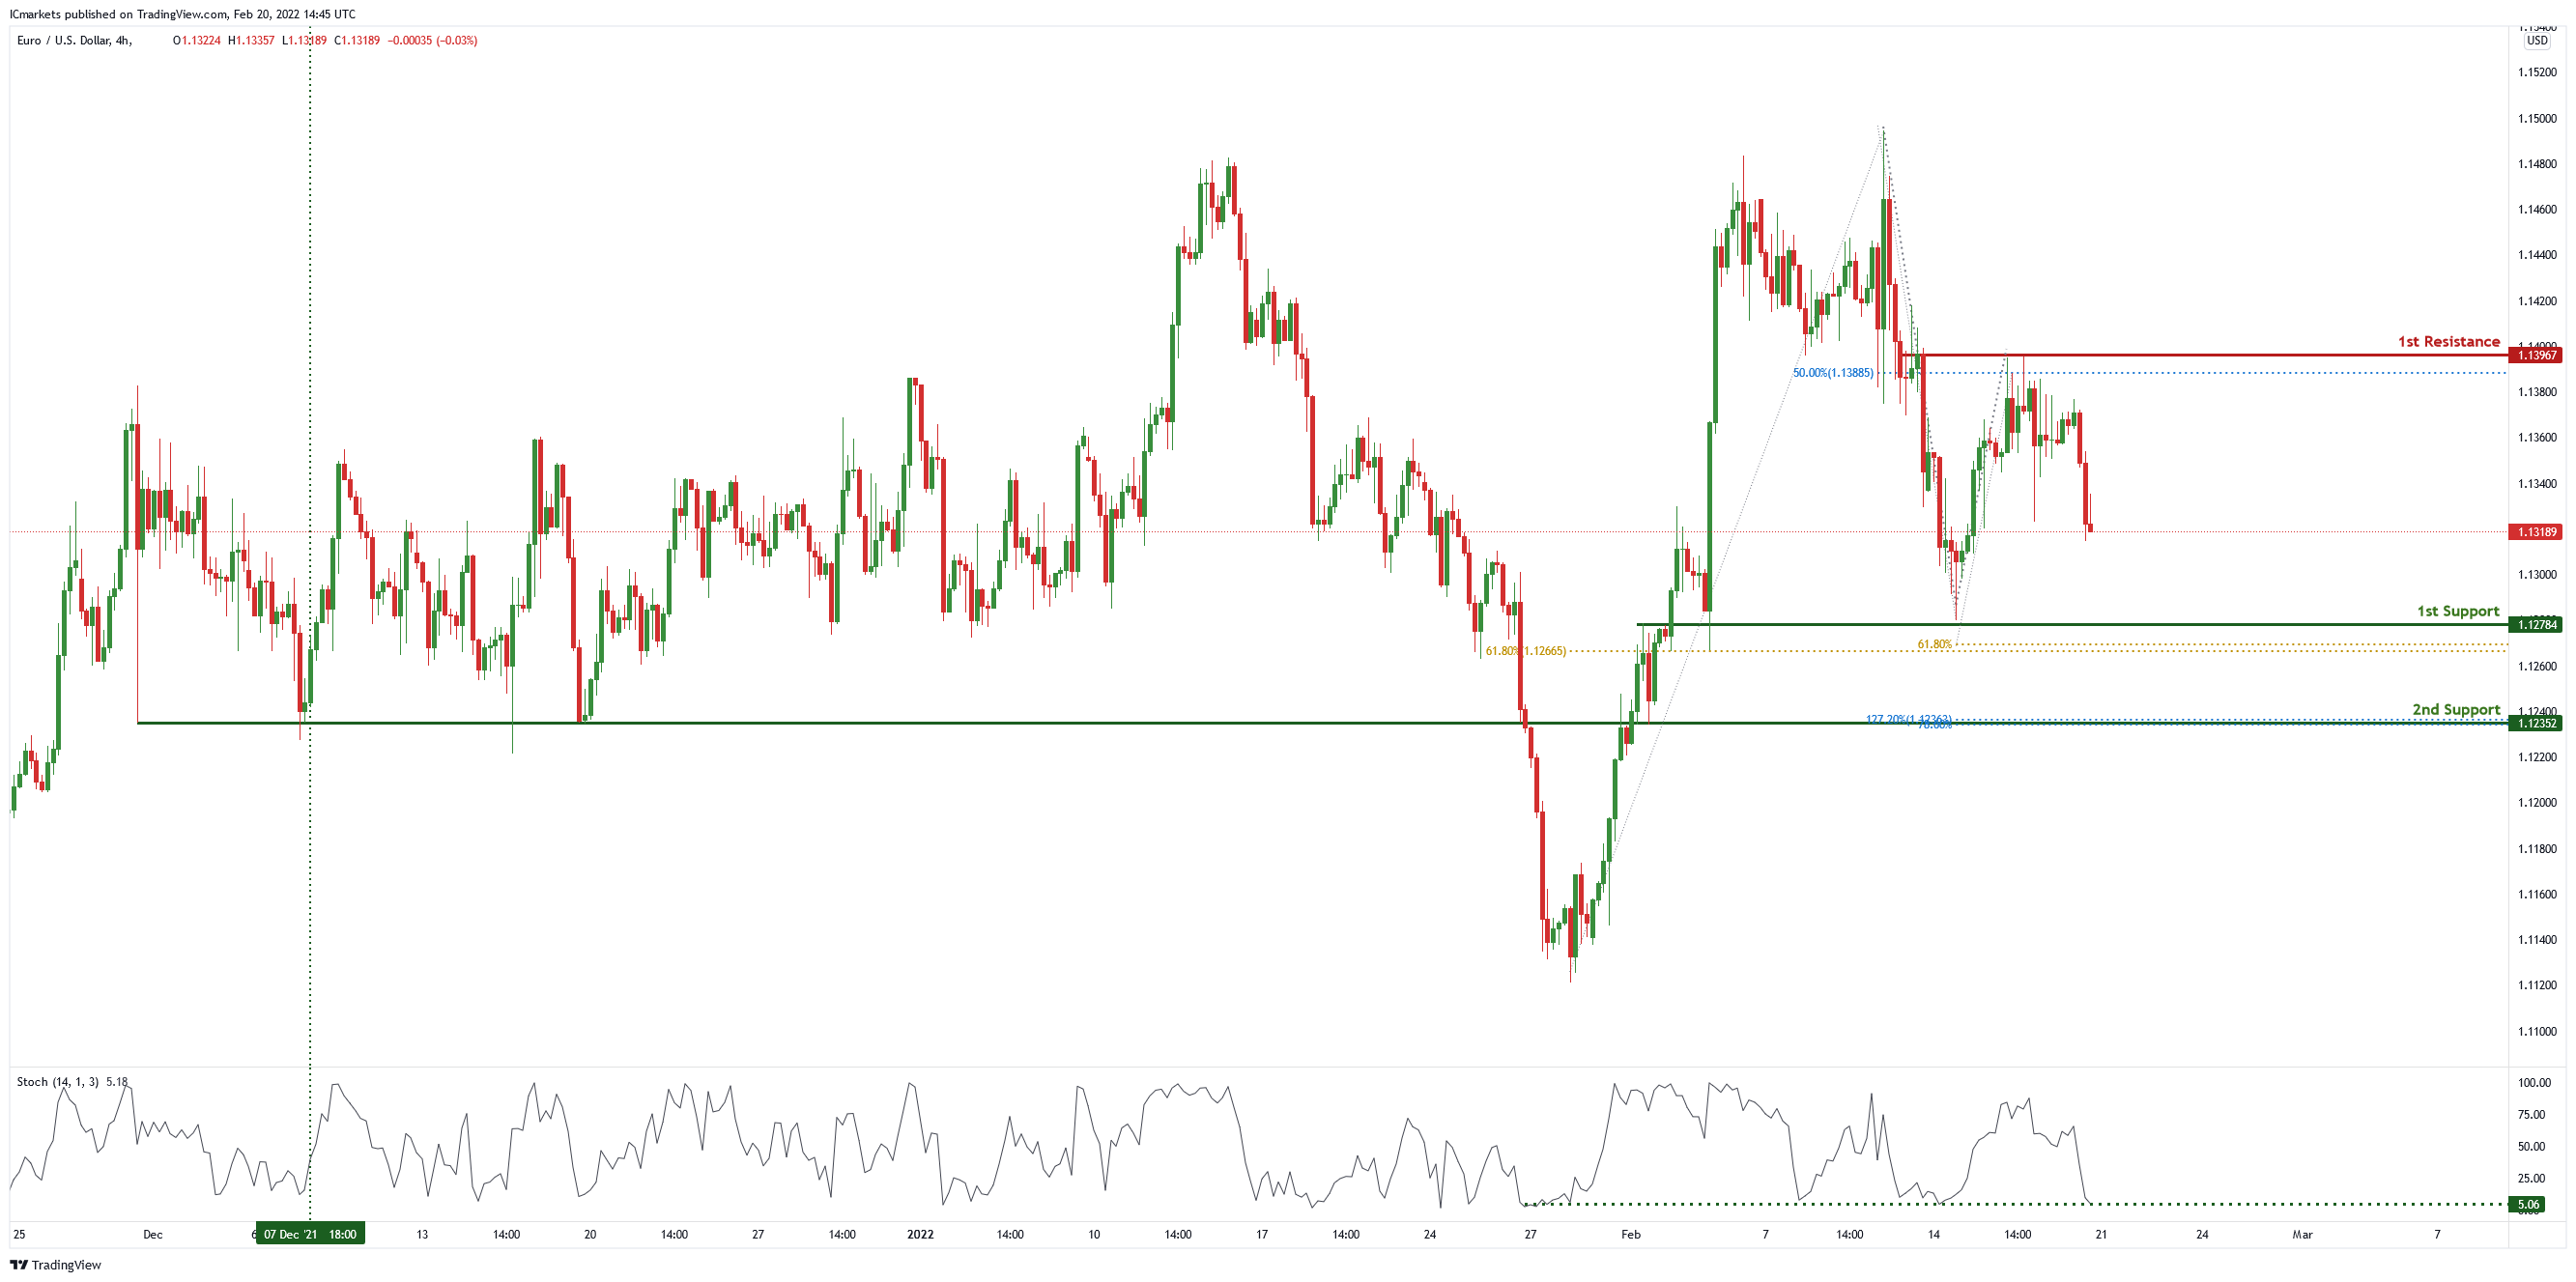
EUR/USD :
On the H4 chart price is near 1st support level of 1.12784 in line with 61.8% Fibonacci retracement and 61.8% Fibonacci projection. Price can potentially go to the 1st resistance level of 1.13967 in line with 50% Fibonacci retracement. Our bullish bias is supported by the stochastic indicator as it is at support level.
Areas on consideration :
- H4 1st support at 1.12784
- H4 1st resistance at 1.13967
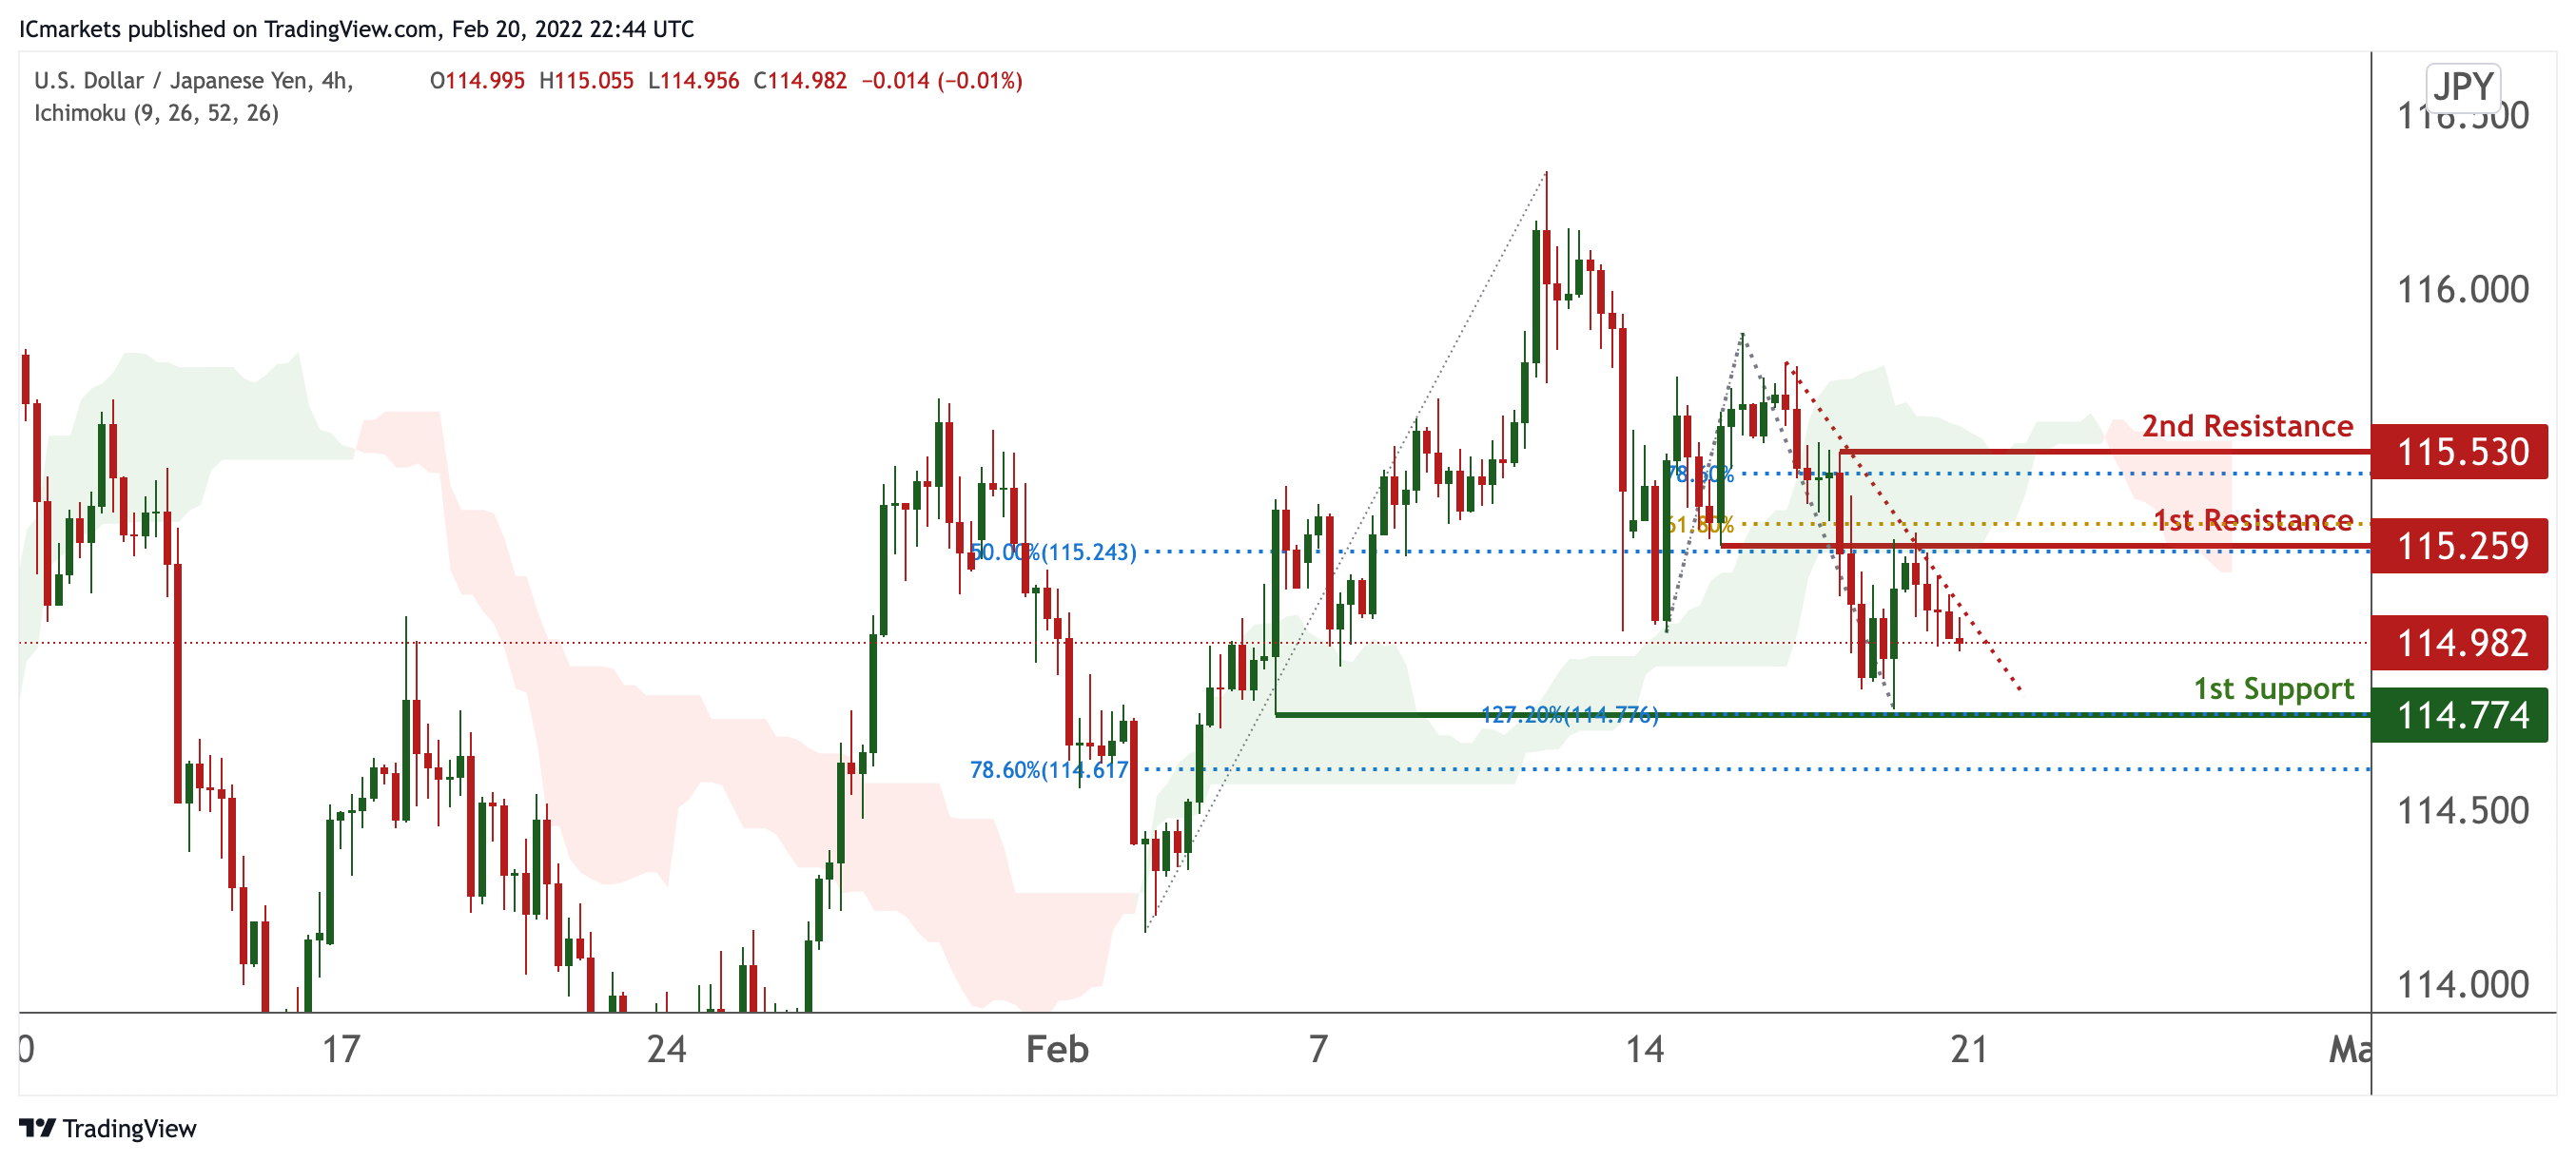
USD/JPY:
On the H4 timeframe, prices are on bearish momentum and abiding to our descending trendline. We see the possibility of bearish continuation from our 1st resistance at 115.259 in line with 61.8% Fibonacci extension and 50% Fibonacci retracement towards our 1st support at 114.774 in line with 127.2% Fibonacci extension and 78.6% Fibonacci retracement. Our bearish bias is further supported by prices trading below our Ichimoku clouds and being on bearish momentum.
Areas of consideration:
H4 time frame, 1st resistance at 115.259
H4 time frame, 1st support at 114.774
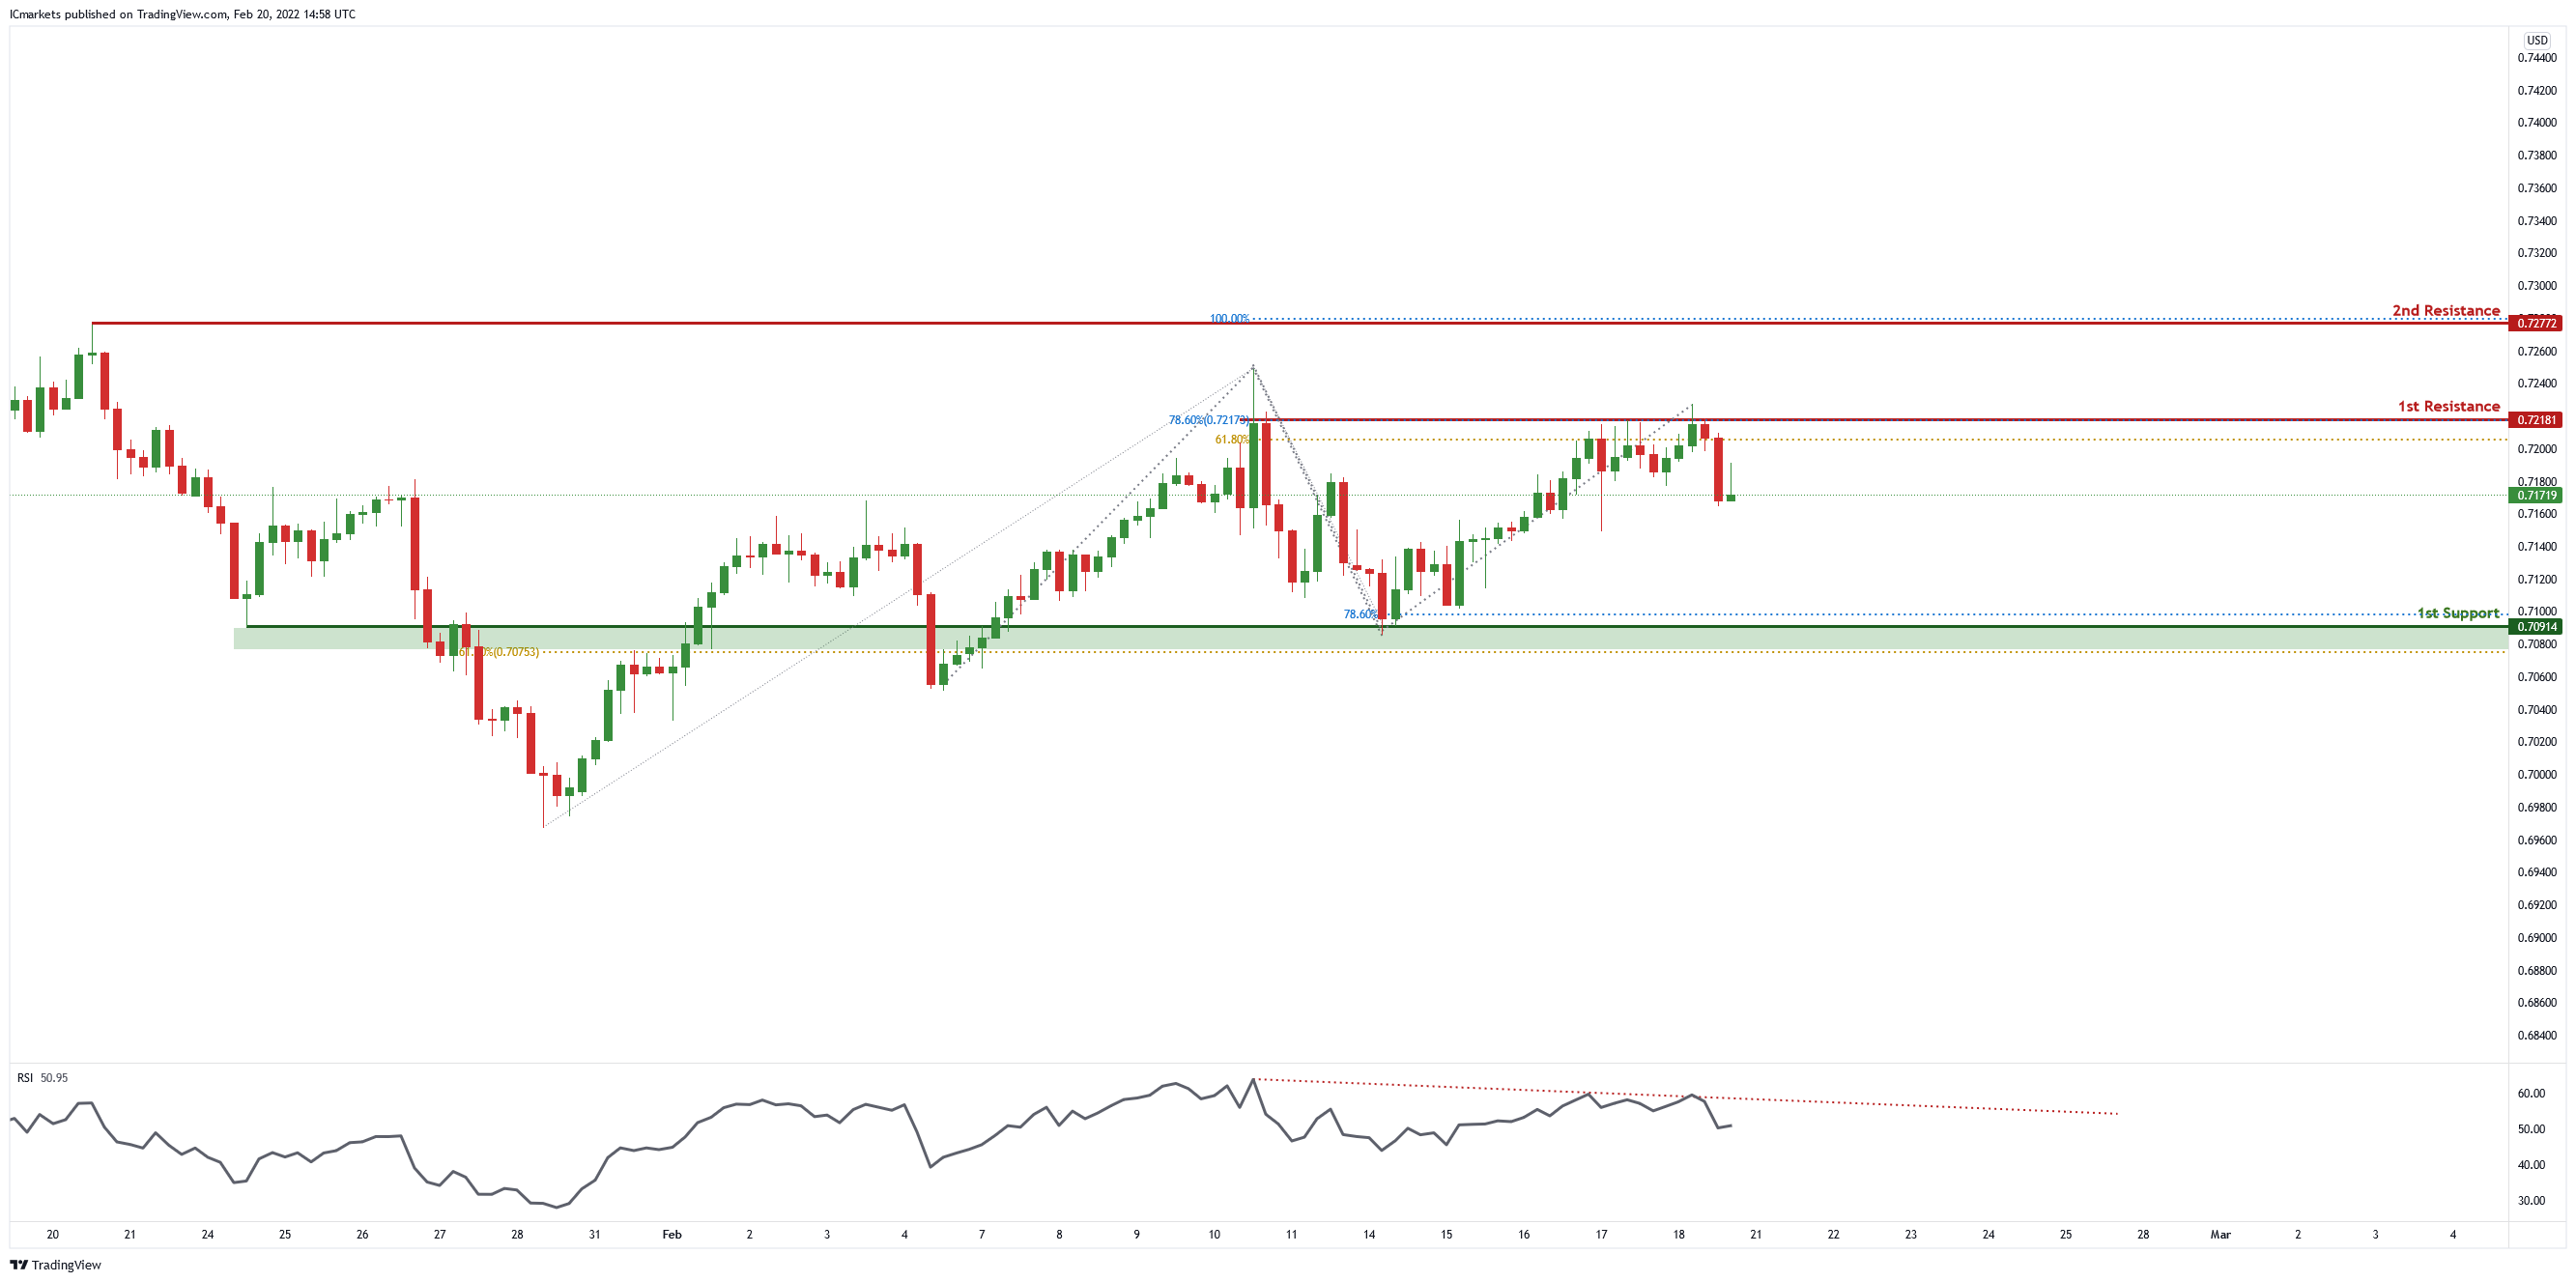
AUD/USD:
On the H4 chart , price is near 1st resistance level of 0.72181 in line with 78.6% Fibonacci projection and 61.8% Fibonacci retracement. Price can potentially dip to the 1st support level of 0.70914 in line with 78.6% Fibonacci projection and 61.8% Fibonacci retracement. Our bearish bias is supported by RSI indicator as it is abiding by a descending trendline
Areas of consideration:
- H4 1st resistance at 0.72181
- H4 1st support at 0.70914
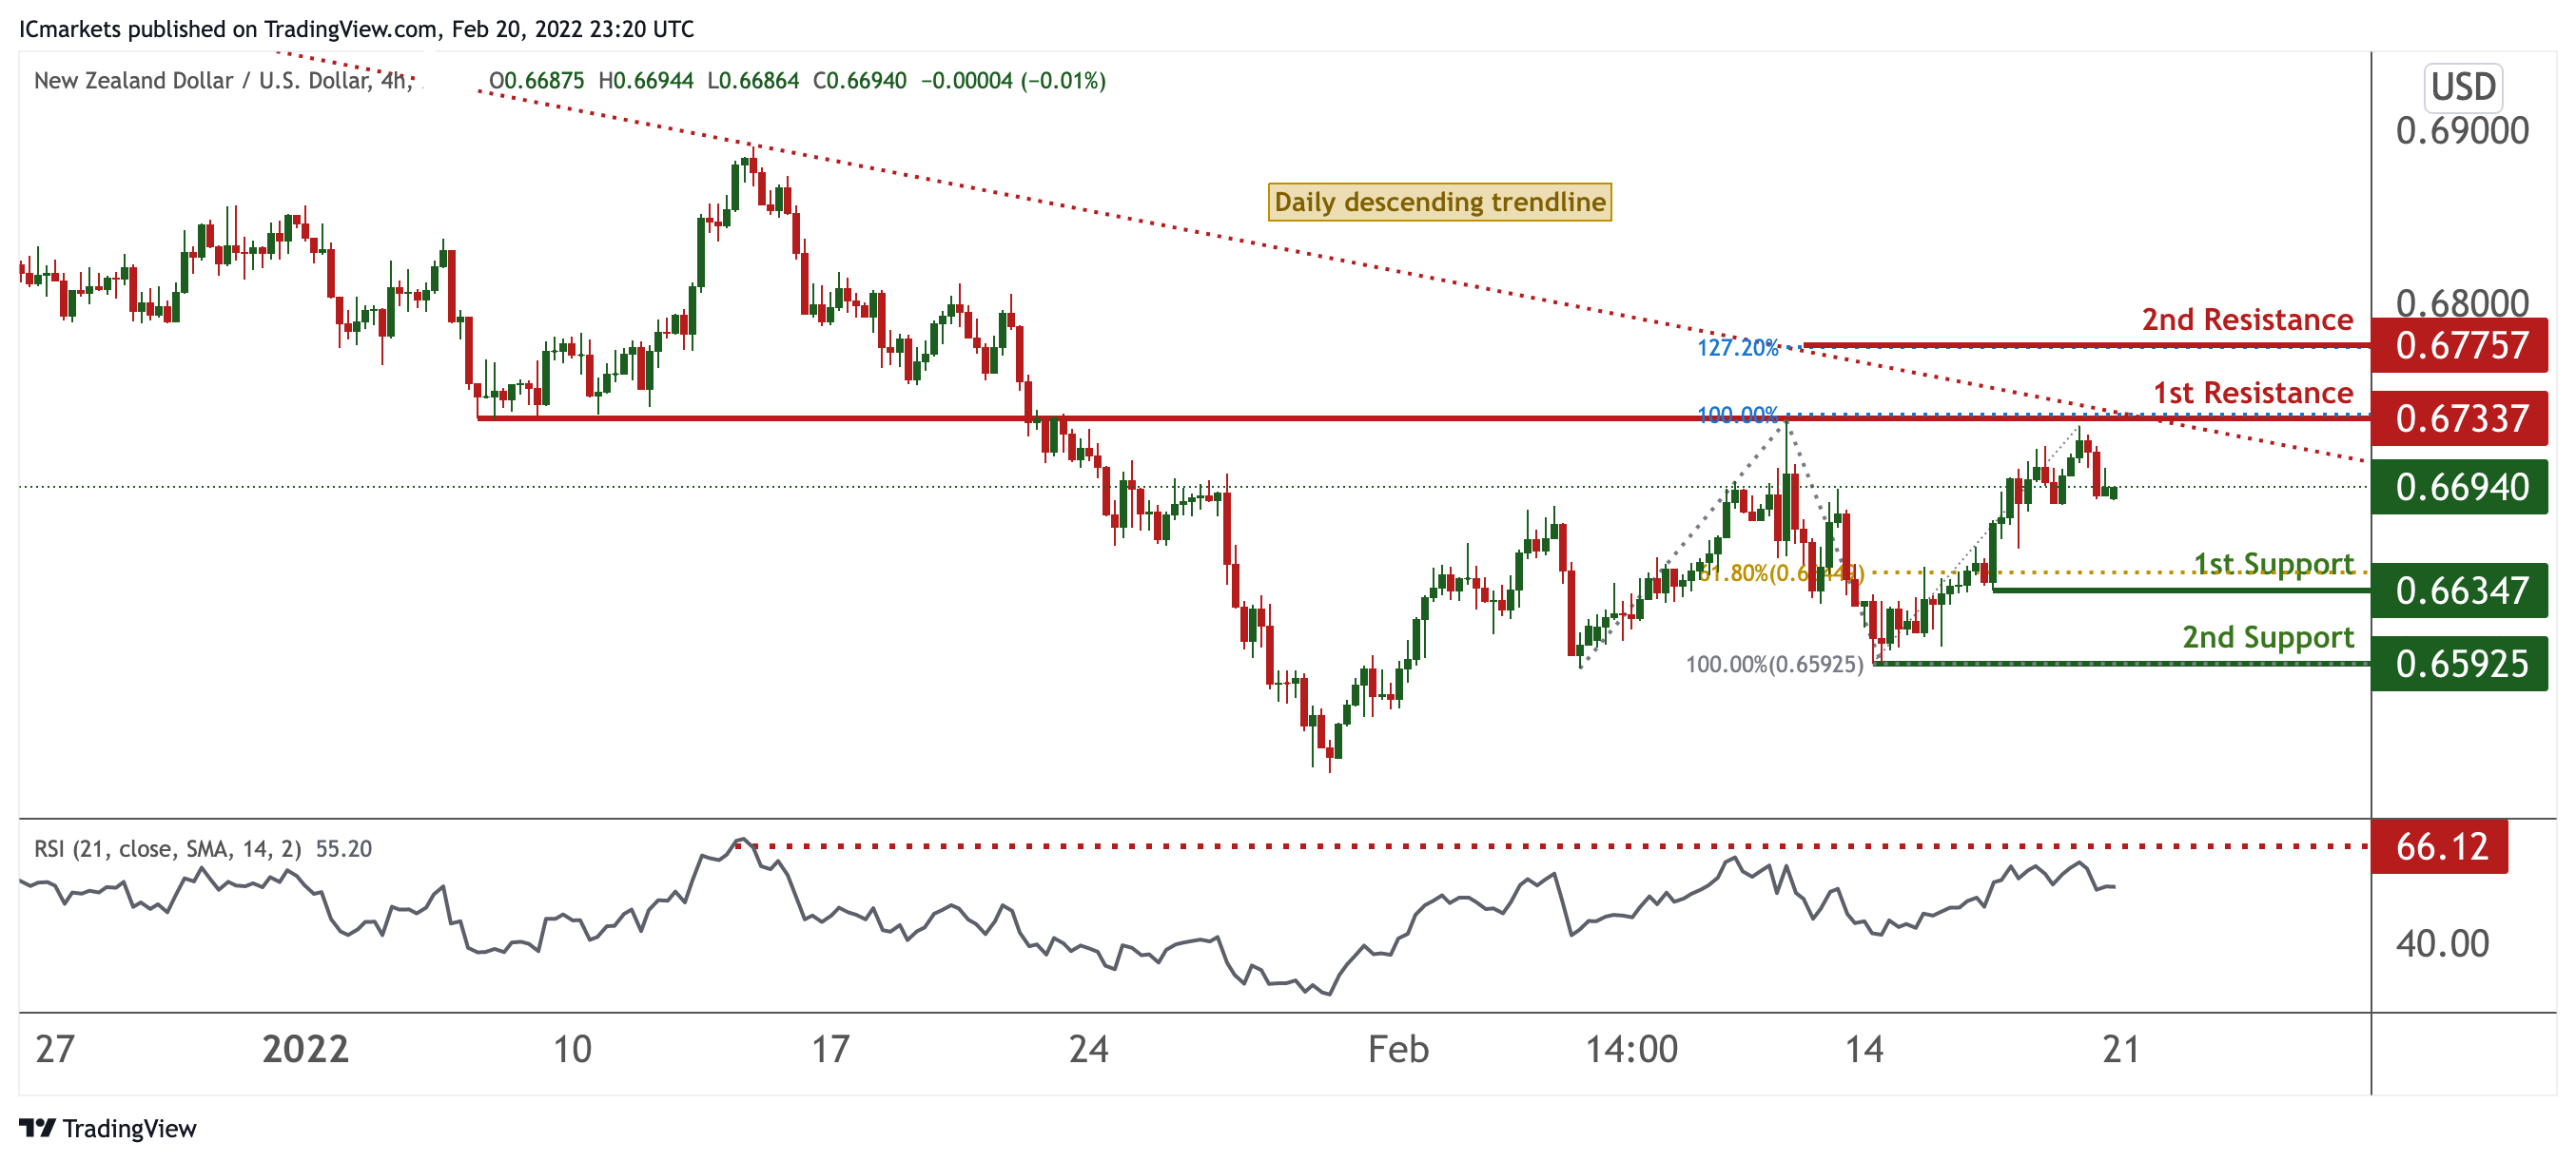
NZD/USD:
On the H4 timeframe, prices are on bearish momentum and abiding to a daily descending trendline. We see potential for a dip from our 1st resistance at 0.67337 in line with 100% Fibonacci extension and descending trendline towards 1st support at 0.66347 in line with 61.8% Fibonacci retracement. RSI are at levels where dips previously occurred, further supporting our bearish bias. Alternatively, our stop loss will be placed at 0.67757 in line with 127.2% Fibonacci extension.
Areas of consideration:
H4 time frame, 1st resistance at 0.67337
H4 time frame, 1st support at 0.66347
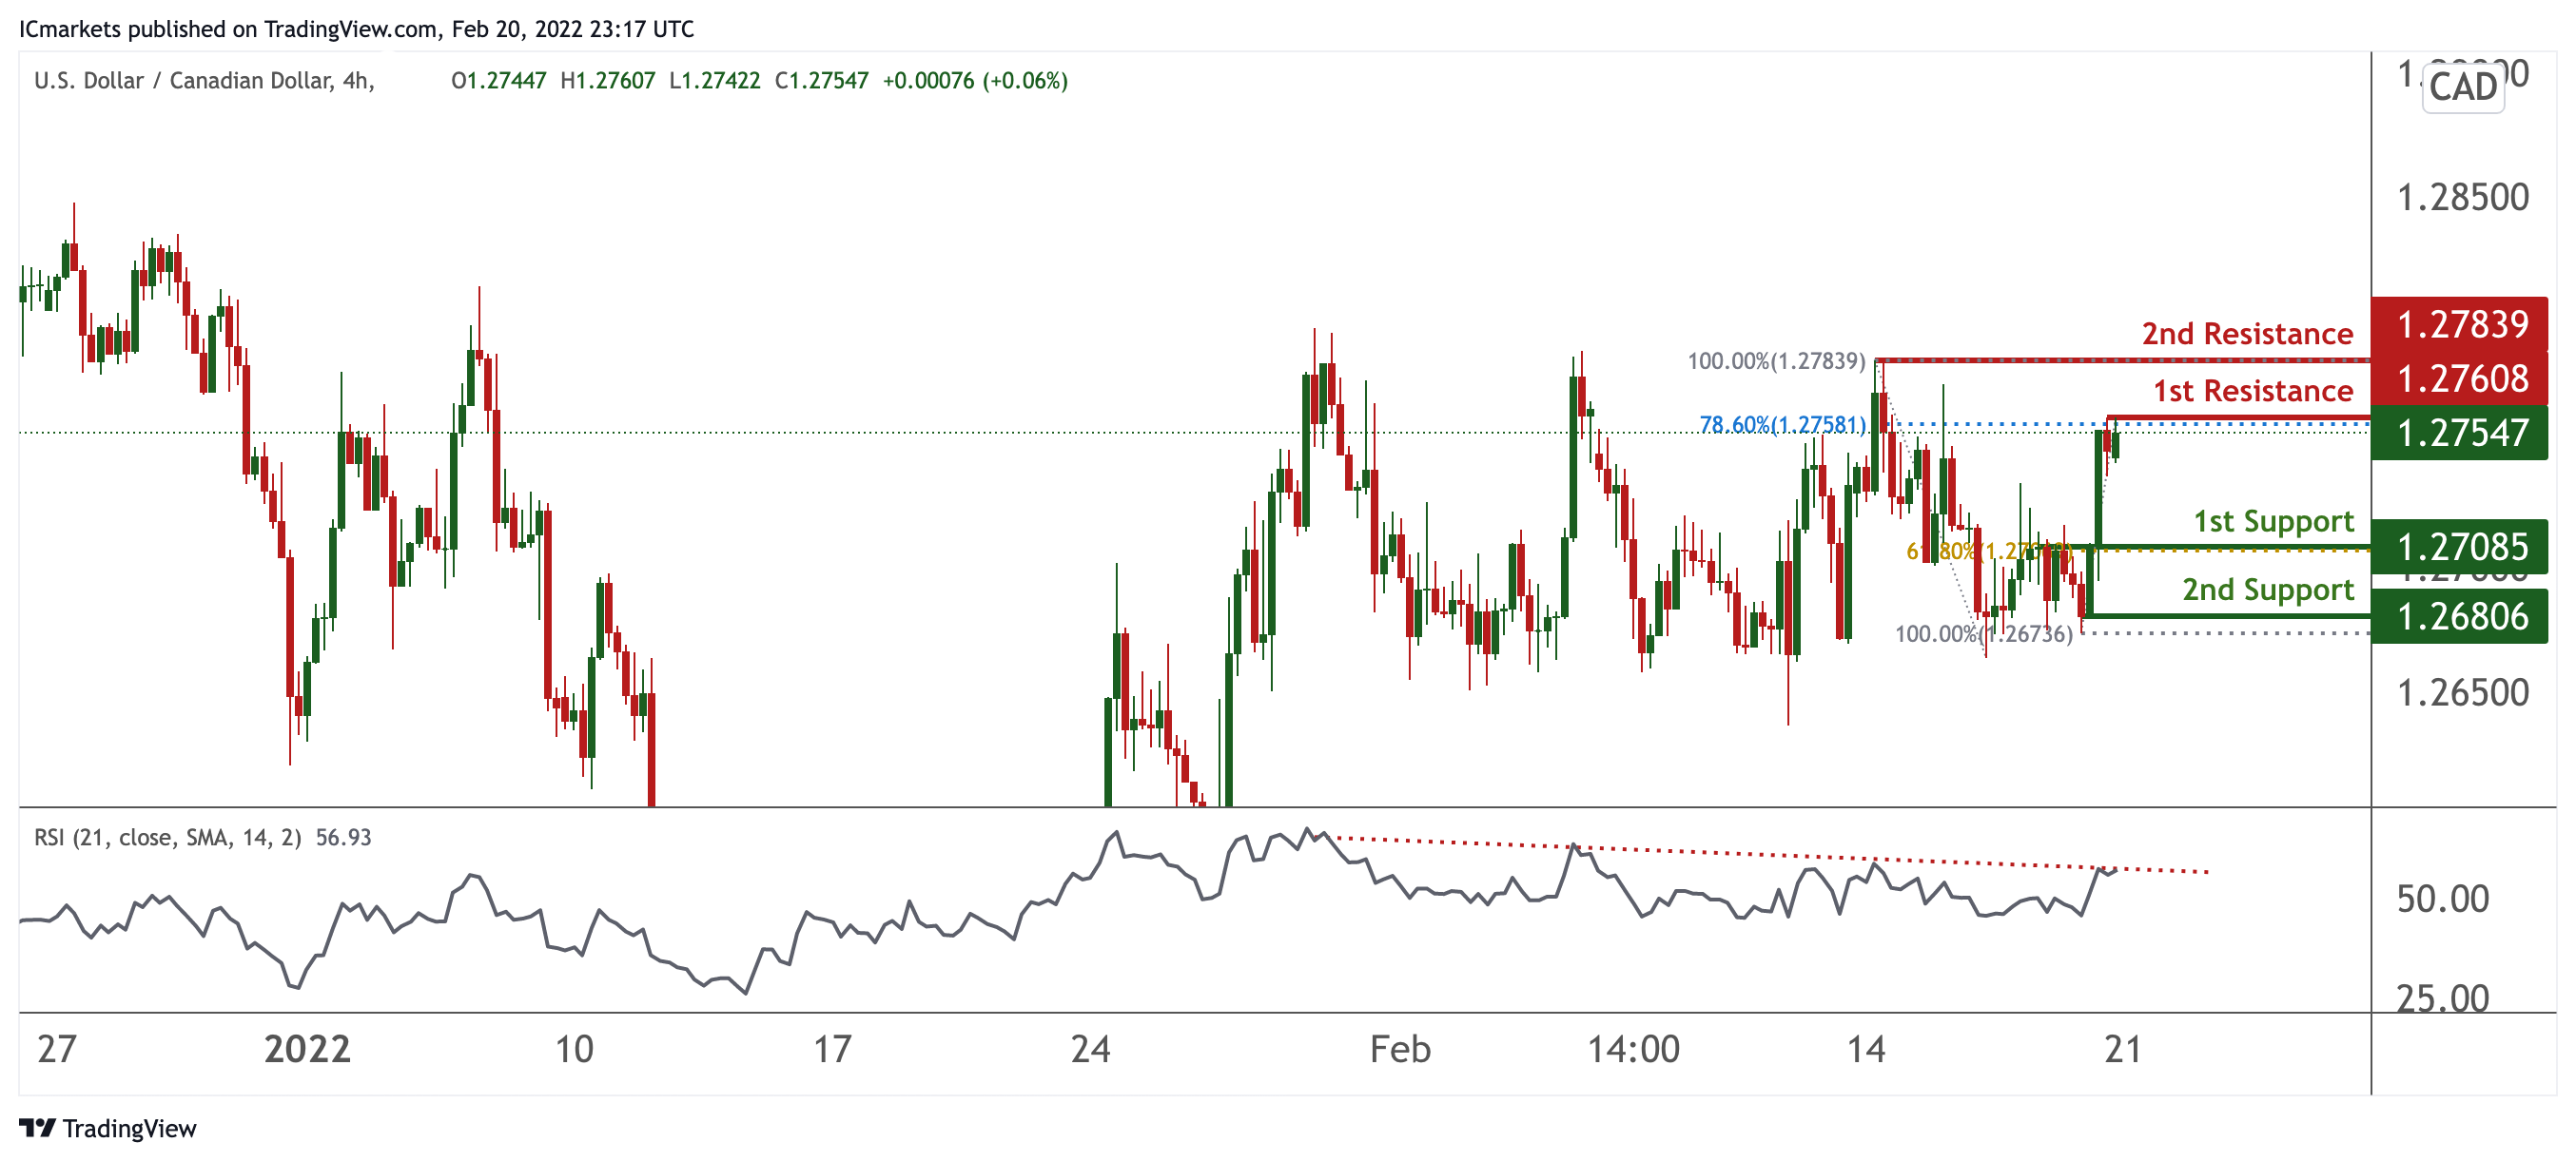
USD/CAD:
On the H4, prices are consolidating sideways. With RSI depicting bearish momentum, we can expect price to drop from our 1st resistance at 1.27608 in line with 78.6% Fibonacci retracement towards our 1st support in line with horizontal overlap support and 61.8% Fibonacci retracement at 1.27085. Alternatively, price may break 1st resistance structure and head for 2nd resistance, which coincides with horizontal swing high resistance and 100% Fibonacci retracement at 1.27839.
Areas of consideration:
- H4 time frame, 1st support at 1.27085
- H4 time frame, 1st resistance at 1.27608
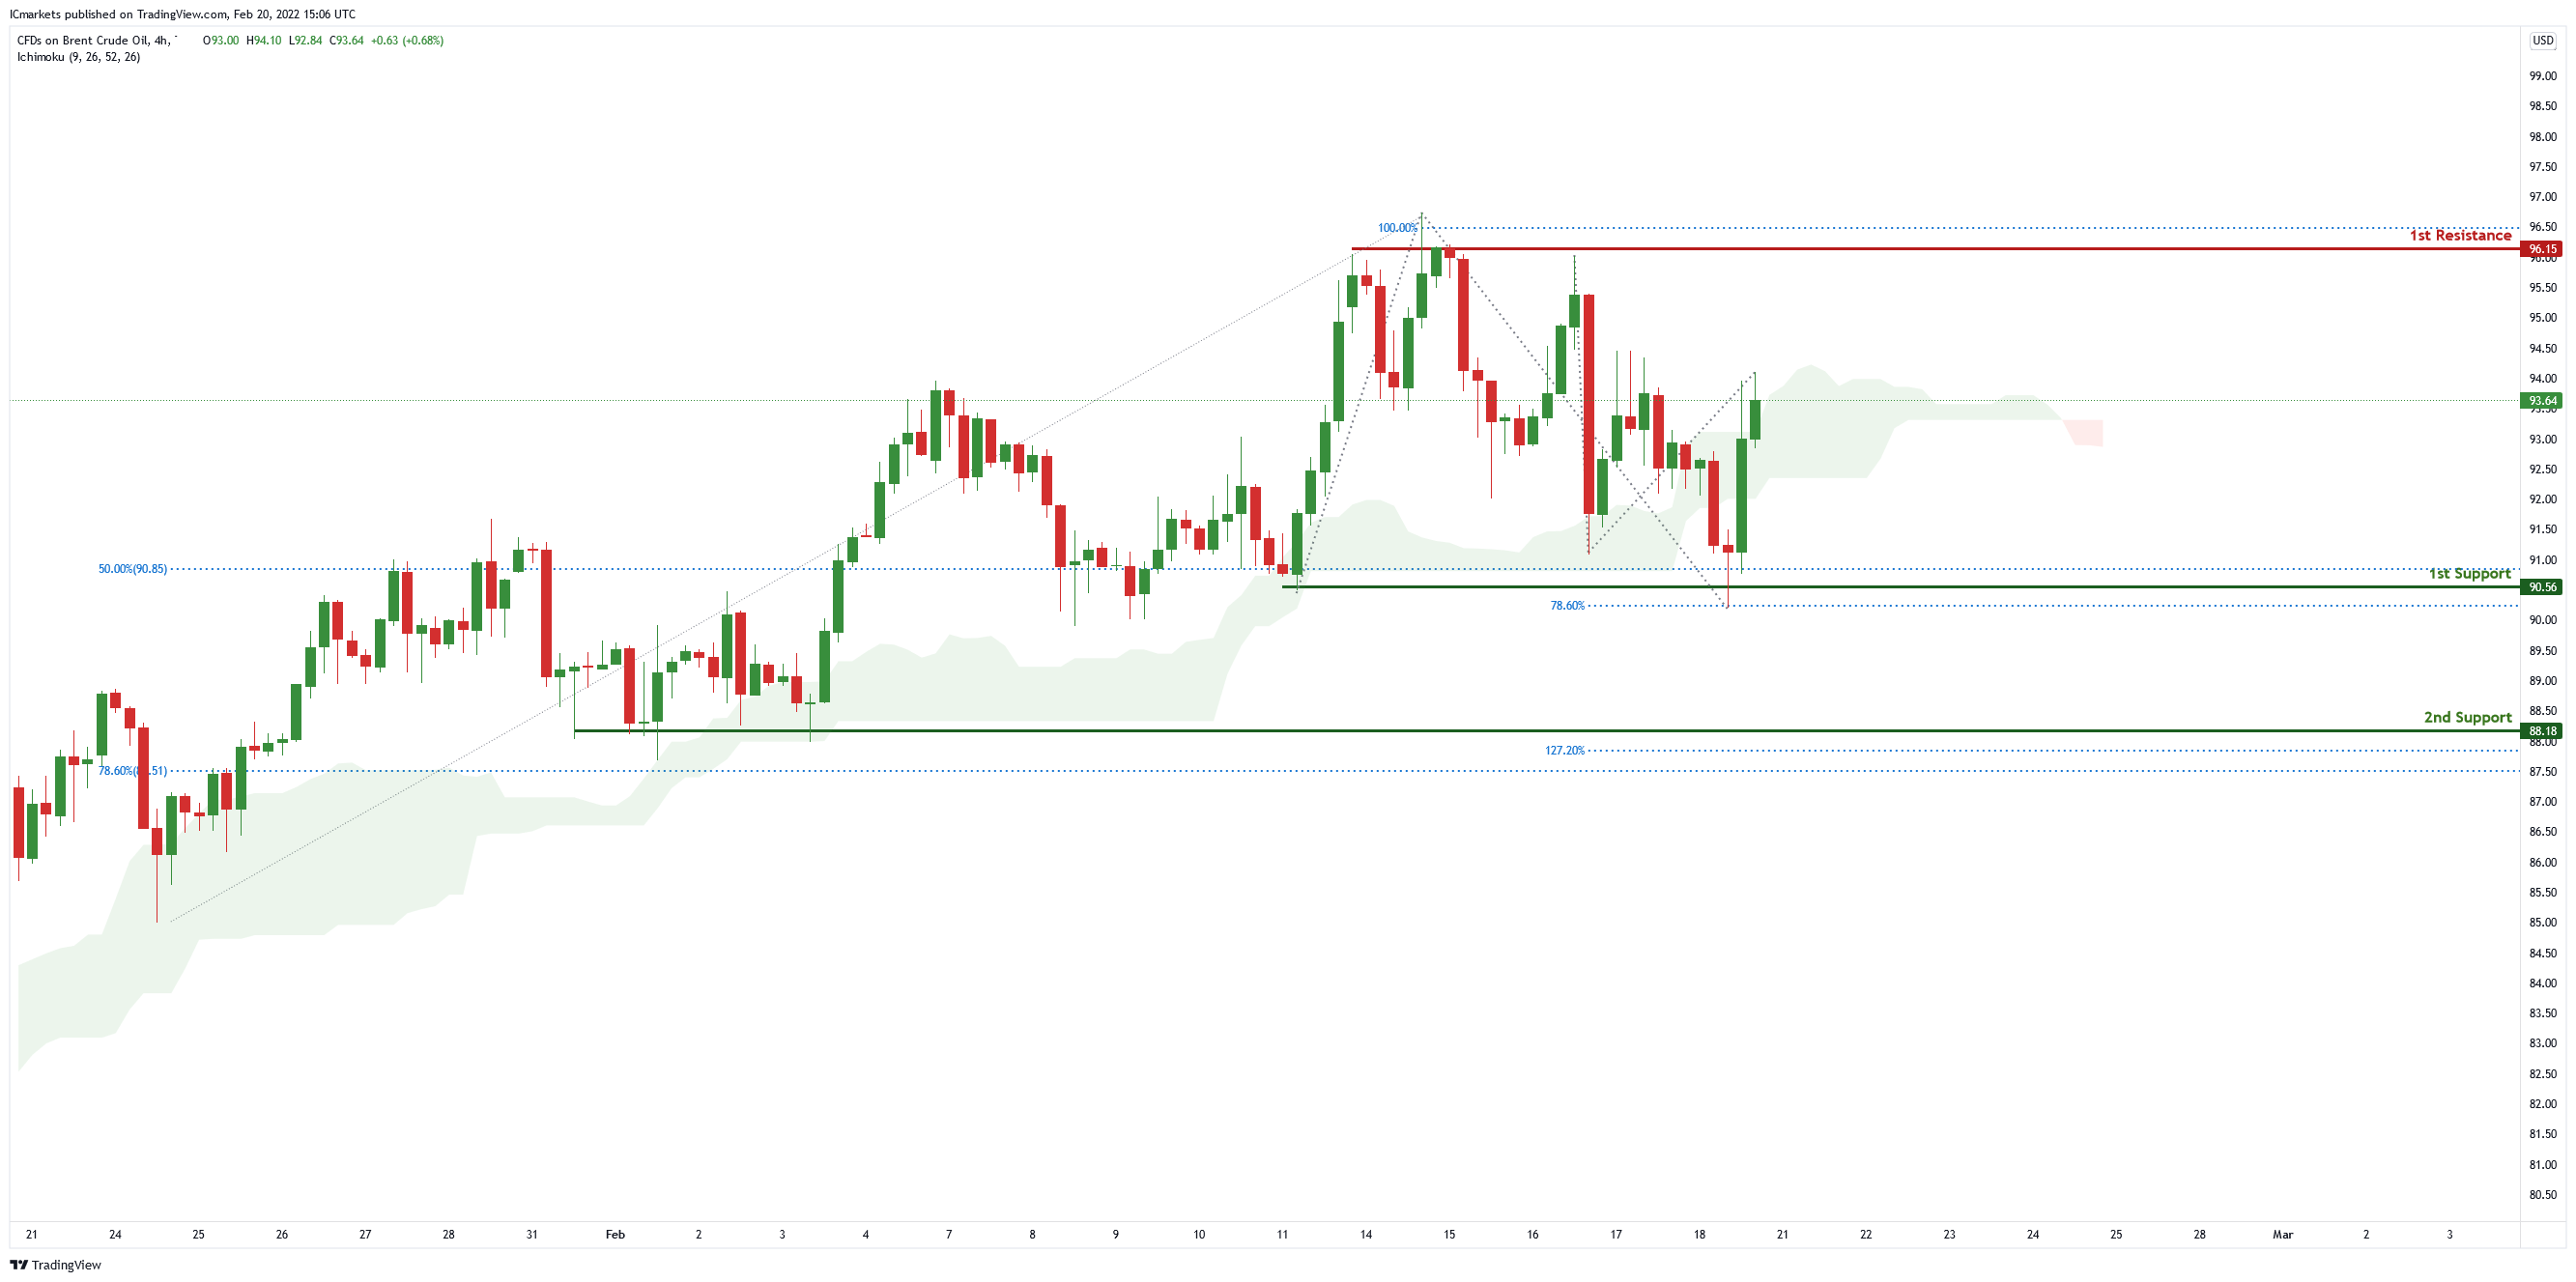
OIL:
On the H4 chart , price has recently bounced off the 1st support level of 90.56 in line with 50% Fibonacci retracement and 78.6% Fibonacci projection. Price is heading towards the 1st resistance level of 96.15 in line with 100% Fibonacci projection. Our bullish bias is supported by the ichimoku cloud indicator as price is trading above it.
Areas of consideration:
- H4 time frame, 1st resistance of 96.15
- H4 time frame, 1st support of 90.56
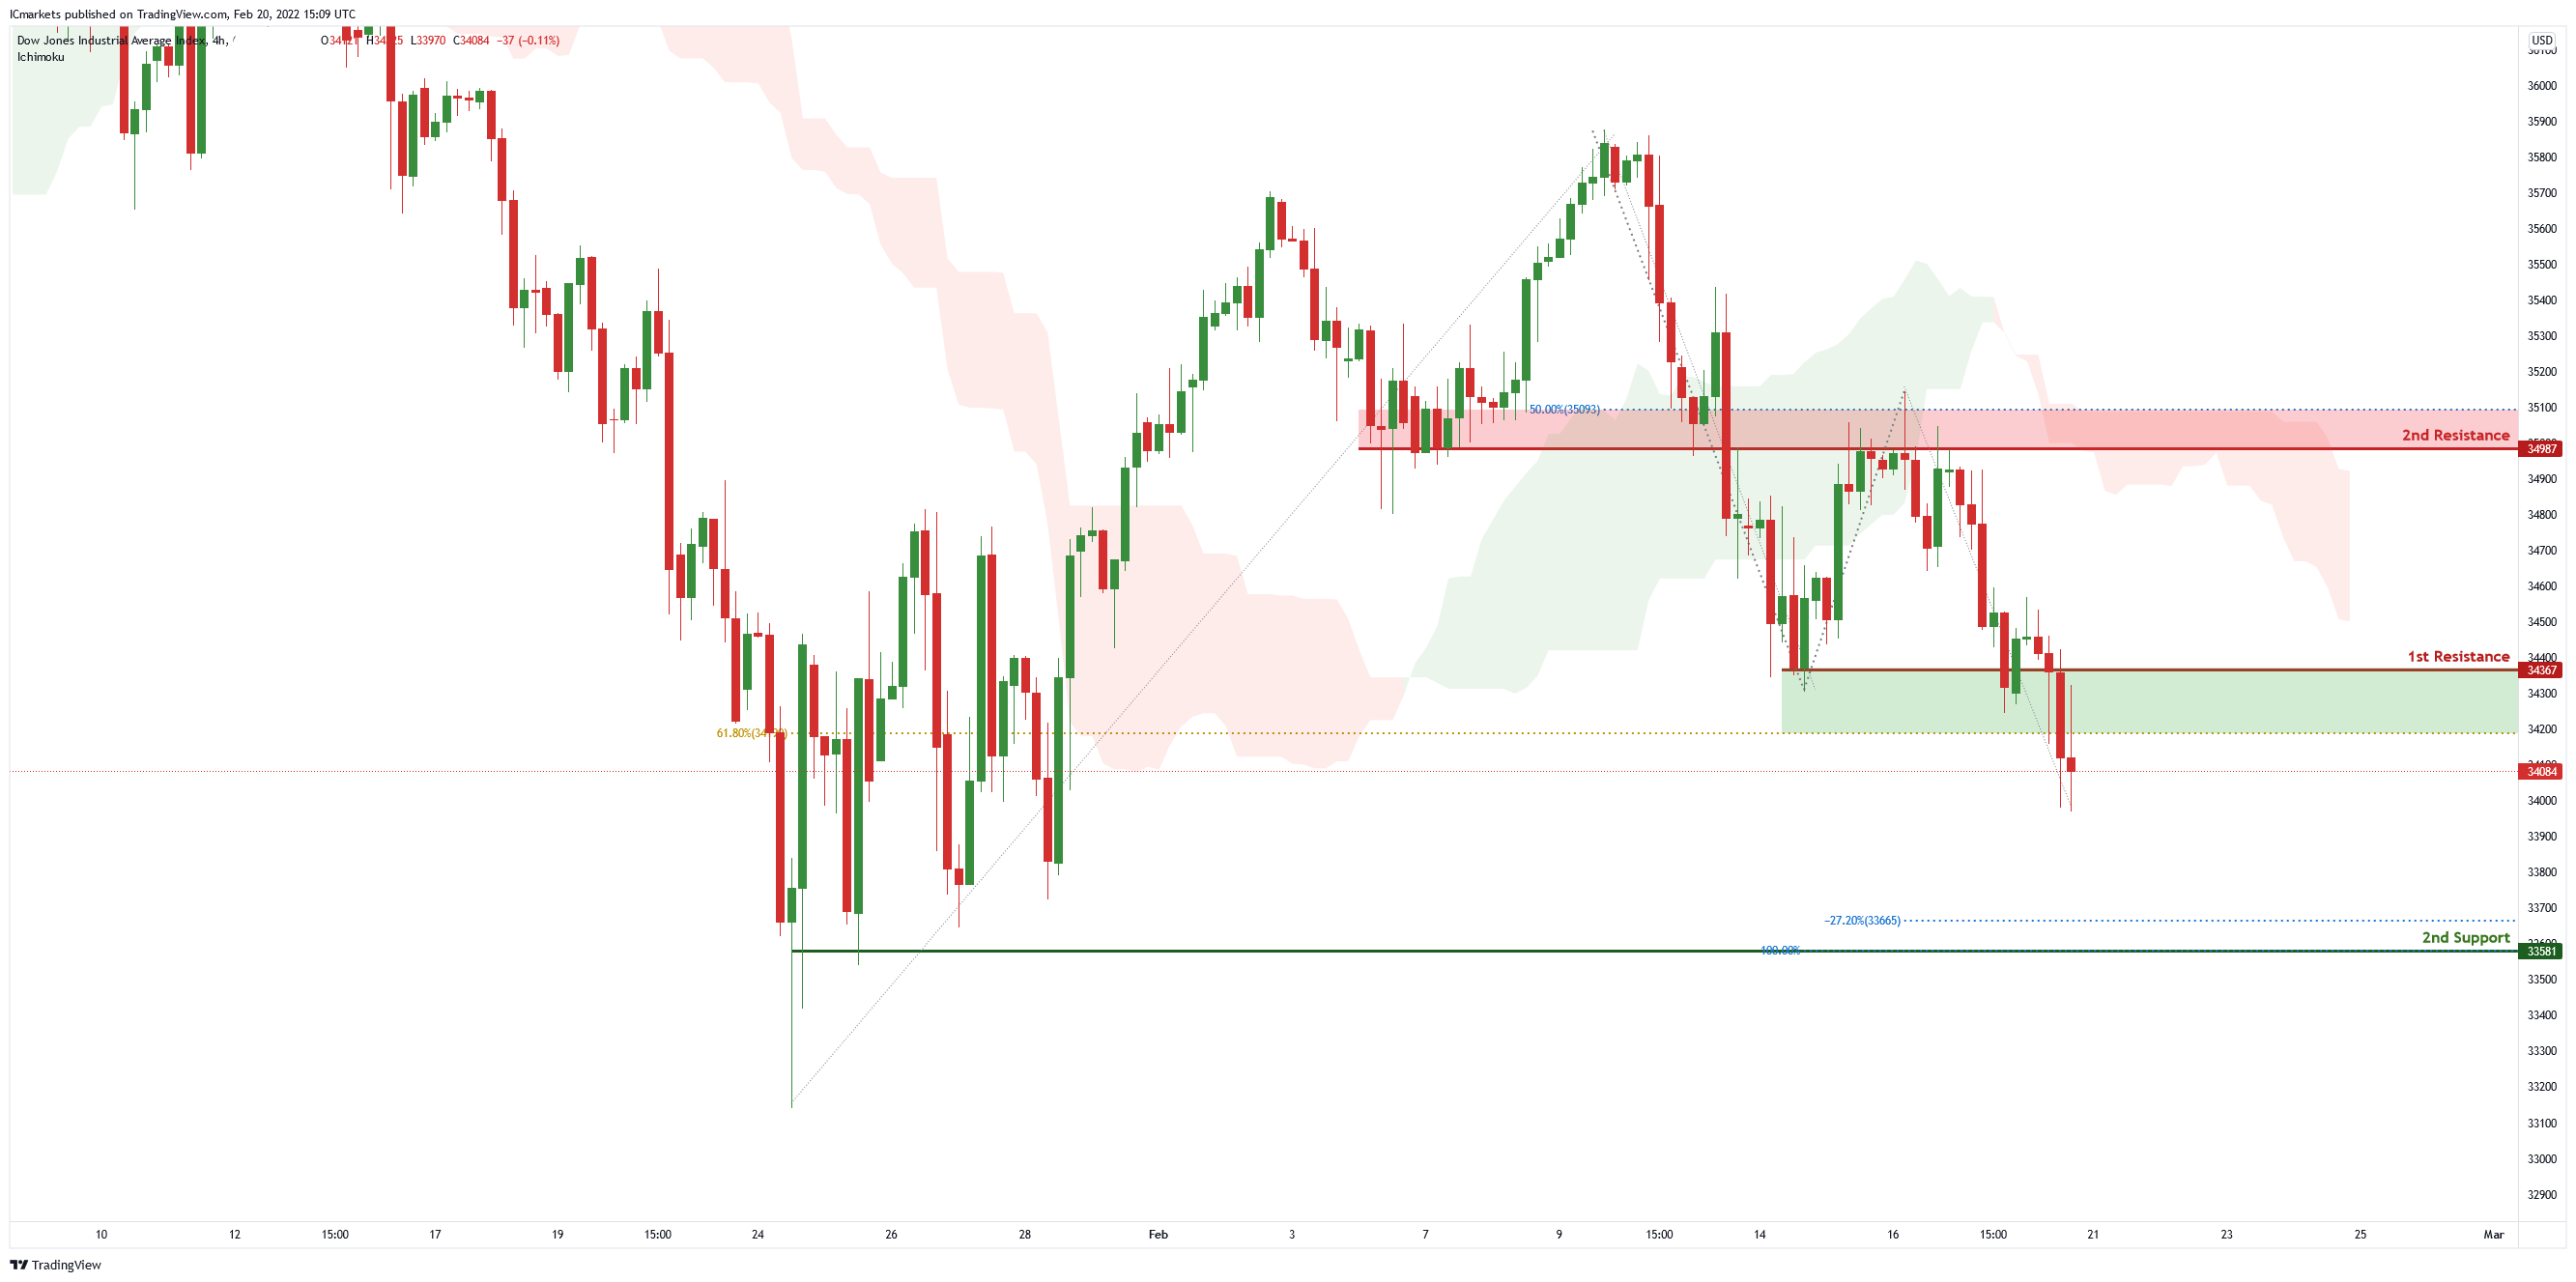
Dow Jones Industrial Average:
On the H4 chart price is near 1st resistance level of 34367 in line with 61.8% Fibonacci retracement. Price can potentially dip to the 1st support level of 33581 in line with -27.2% Fibonacci retracement and 100% Fibonacci projection. Our bearish bias is supported by the ichimoku cloud indicator as price is trading below it .
Areas of consideration:
- H4 1st resistance at 34367
- H4 1st support at 33581
The accuracy, completeness and timeliness of the information contained on this site cannot be guaranteed. IC Markets does not warranty, guarantee or make any representations, or assume any liability regarding financial results based on the use of the information in the site.
News, views, opinions, recommendations and other information obtained from sources outside of www.icmarkets.com.au, used in this site are believed to be reliable, but we cannot guarantee their accuracy or completeness. All such information is subject to change at any time without notice. IC Markets assumes no responsibility for the content of any linked site.
The fact that such links may exist does not indicate approval or endorsement of any material contained on any linked site. IC Markets is not liable for any harm caused by the transmission, through accessing the services or information on this site, of a computer virus, or other computer code or programming device that might be used to access, delete, damage, disable, disrupt or otherwise impede in any manner, the operation of the site or of any user’s software, hardware, data or property.


