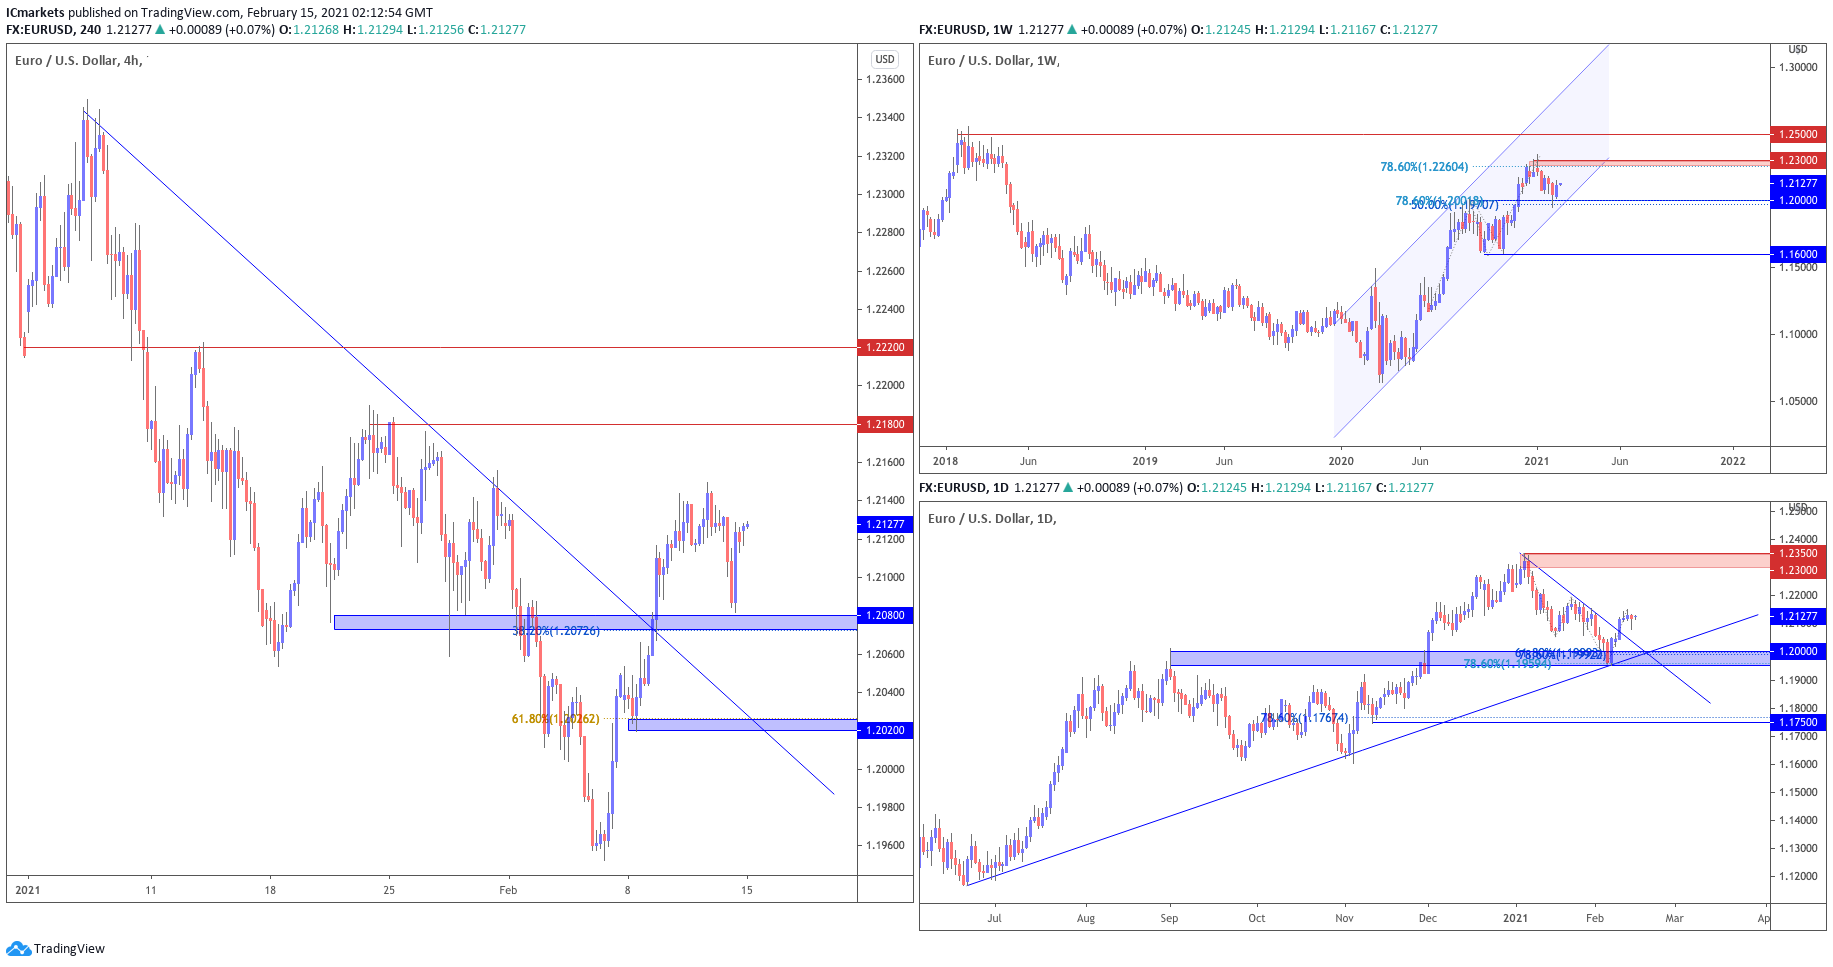
EUR/USD:
Looking at the weekly chart, we can see that prices are testing the support area of our ascending channel at 1.200, which coincides with the 50% Fibonacci retracement and 78.6% Fibonacci extension. We could see a further upside to test our resistance area at 1.2300, in line with the graphical swing high resistance and 78.6% Fibonacci extension. On the daily time frame, prices are holding nicely above the ascending trend line and support area at 1.200 which can also be found on the weekly time frame.
On the H4 timeframe, prices are facing upside pressure from our support area at 1.2080, which coincides with the graphical overlap resistance and 38.2% fibonacci retracement. This would be an interesting level for buyers and recent price action around that area suggests it is a strong area of demand flowing, where we could see a further upside to our short term resistance level at 1.2180, in line with the graphical swing high resistance on the H4 time frame.
Areas of consideration:
- 2080 support area found on H4 time frame
- 2180 resistance level found on H4 time frame
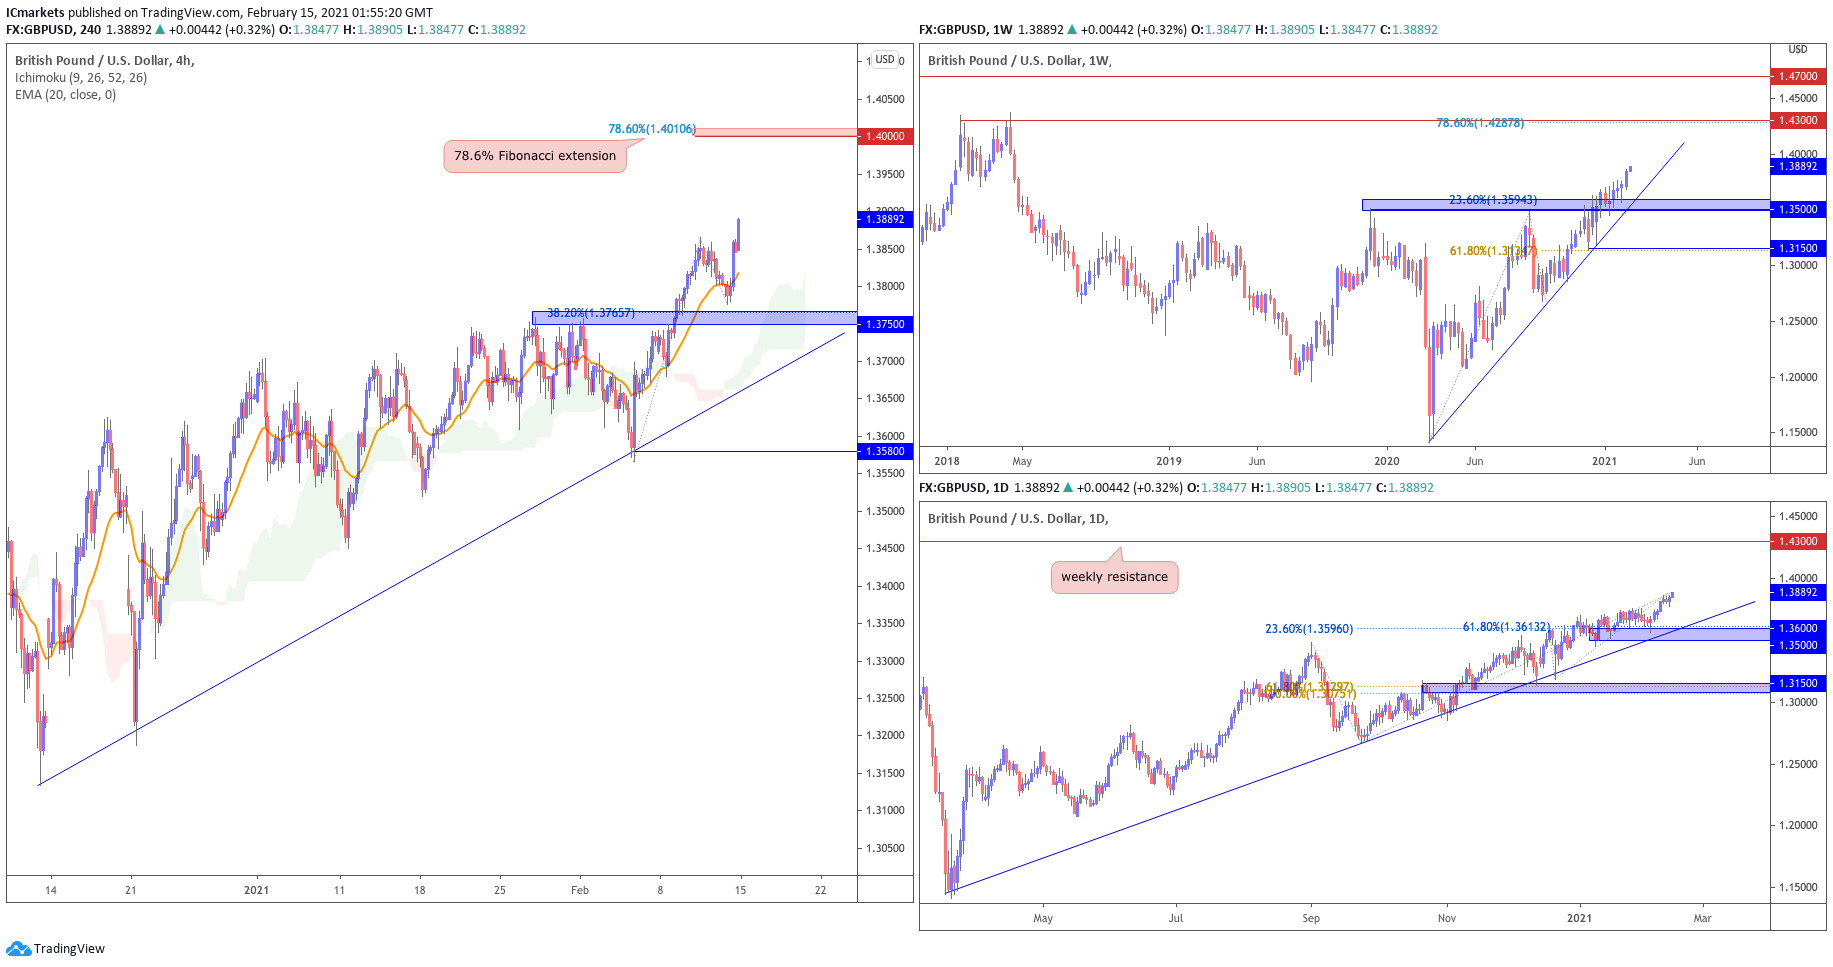
GBP/USD:
Looking at the weekly chart, we can see that prices are holding nicely above our ascending trend line and weekly support area at 1.3500 where we could see a further upside to the weekly resistance level at 1.4300, in line with the graphical swing high area and 78.6% Fibonacci extension. On the daily time frame, our support area at 1.3500 – 1.3600, which is also found on the weekly time frame, coincides with the 23.6% Fibonacci retracement and 61.8% Fibonacci extension as well, where we could see further upside in prices above this area.
On the H4 timeframe, prices are facing bullish pressure from our ascending trend line and support area at 1.3750, in line with the 38.2% Fibonacci retracement. We could see a further upside above this level to our short term resistance area at 1.400, in line with the 78.6% Fibonacci extension.
Areas of consideration:
- 400 resistance area resistance area found on H4 timeframe
- 3750 support area on H4 timeframe
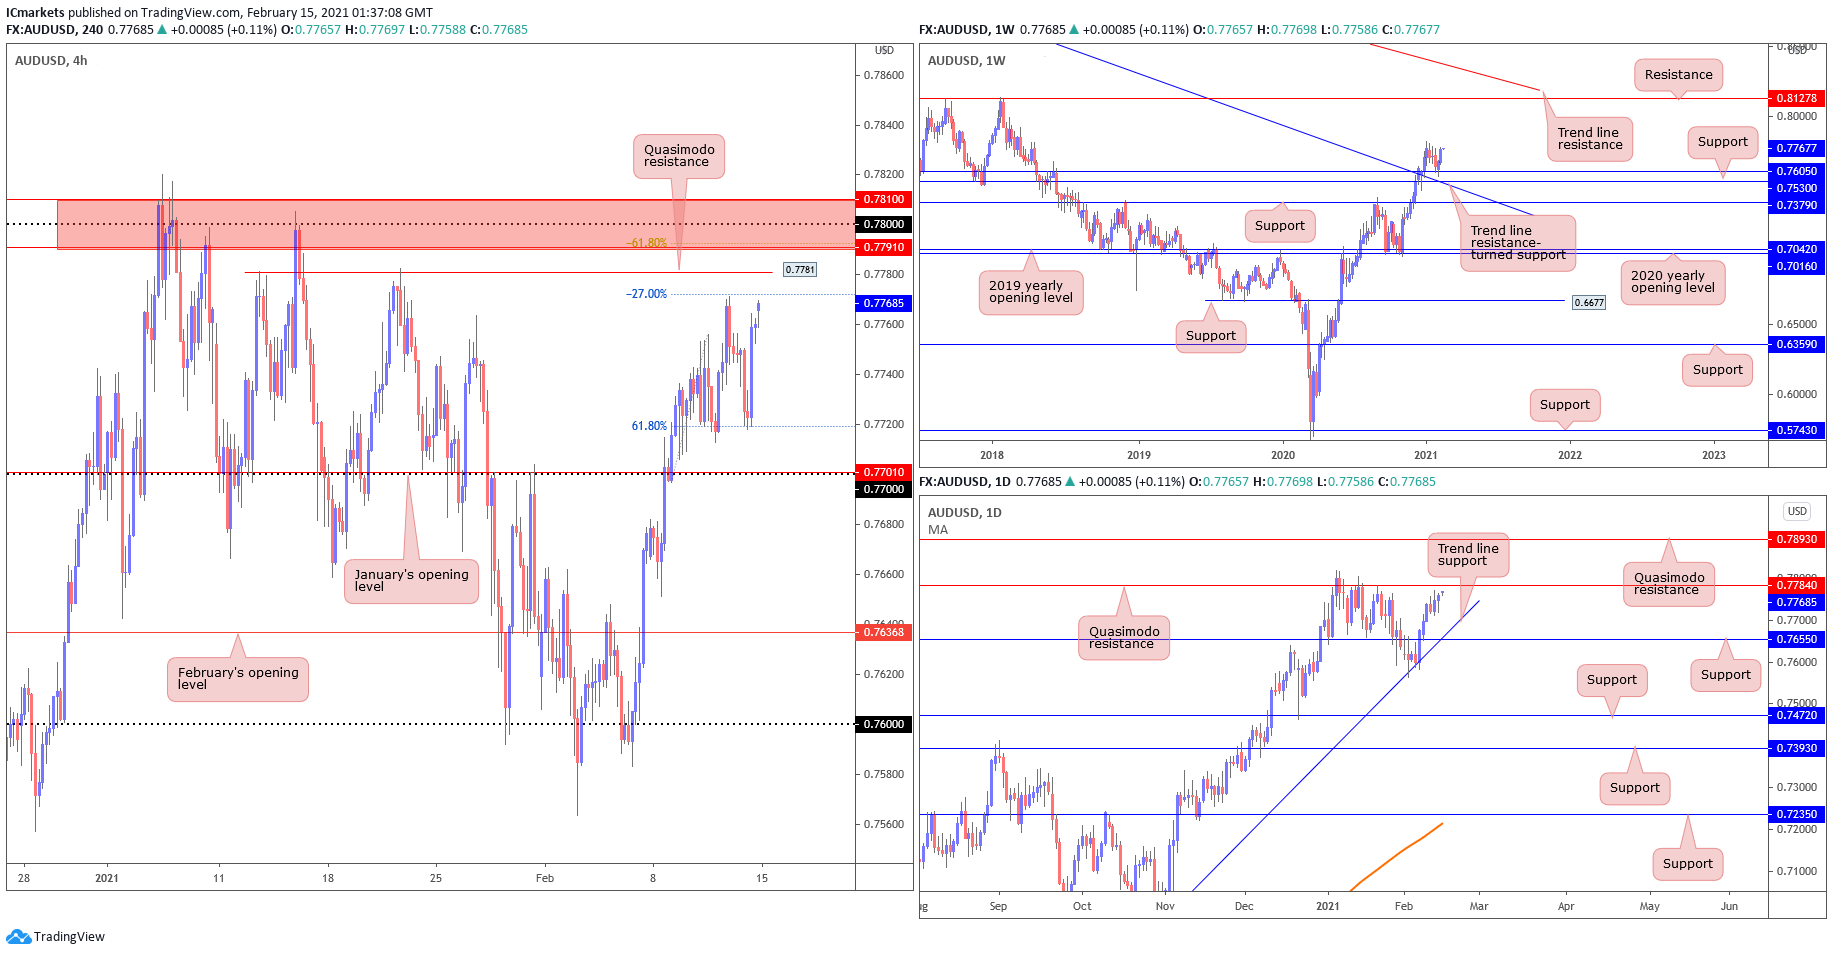
AUD/USD:
From the Weekly timeframe, we can see that price is approaching the previous high from the week of 4 January (2021), we may witness a continuation of bullish momentum into the next resistance at 0.81278, a retested swing-high level since 11 May (2015). On the Daily timeframe, the bounce from Trend line support has shown a strong bullish move towards the 0.7784 level, a previous Quasimodo resistance. Price has yet to retest the resistance turned-support level of 0.7655, therefore a short-term bearish scenario may be due. On H4, we could see that buyers pushed the prices up from the 61.8% retracement level and sellers took control when price approached the 0.77717 level, a -27% retracement on 11 February (2021). We may see the breaking of this previous high (0.77717) and 0.7781, a Quasimodo resistance level, towards the highlighted resistance area of 0.7791 where the major level reversal has previously occur.
Areas of consideration:
- H4 bounced from 61.8% retracement and is approaching -27% retracement.
- Daily and Weekly still showing bullish momentum, price may retest highlighted resistance zone between 0.7791 to 0.7810.
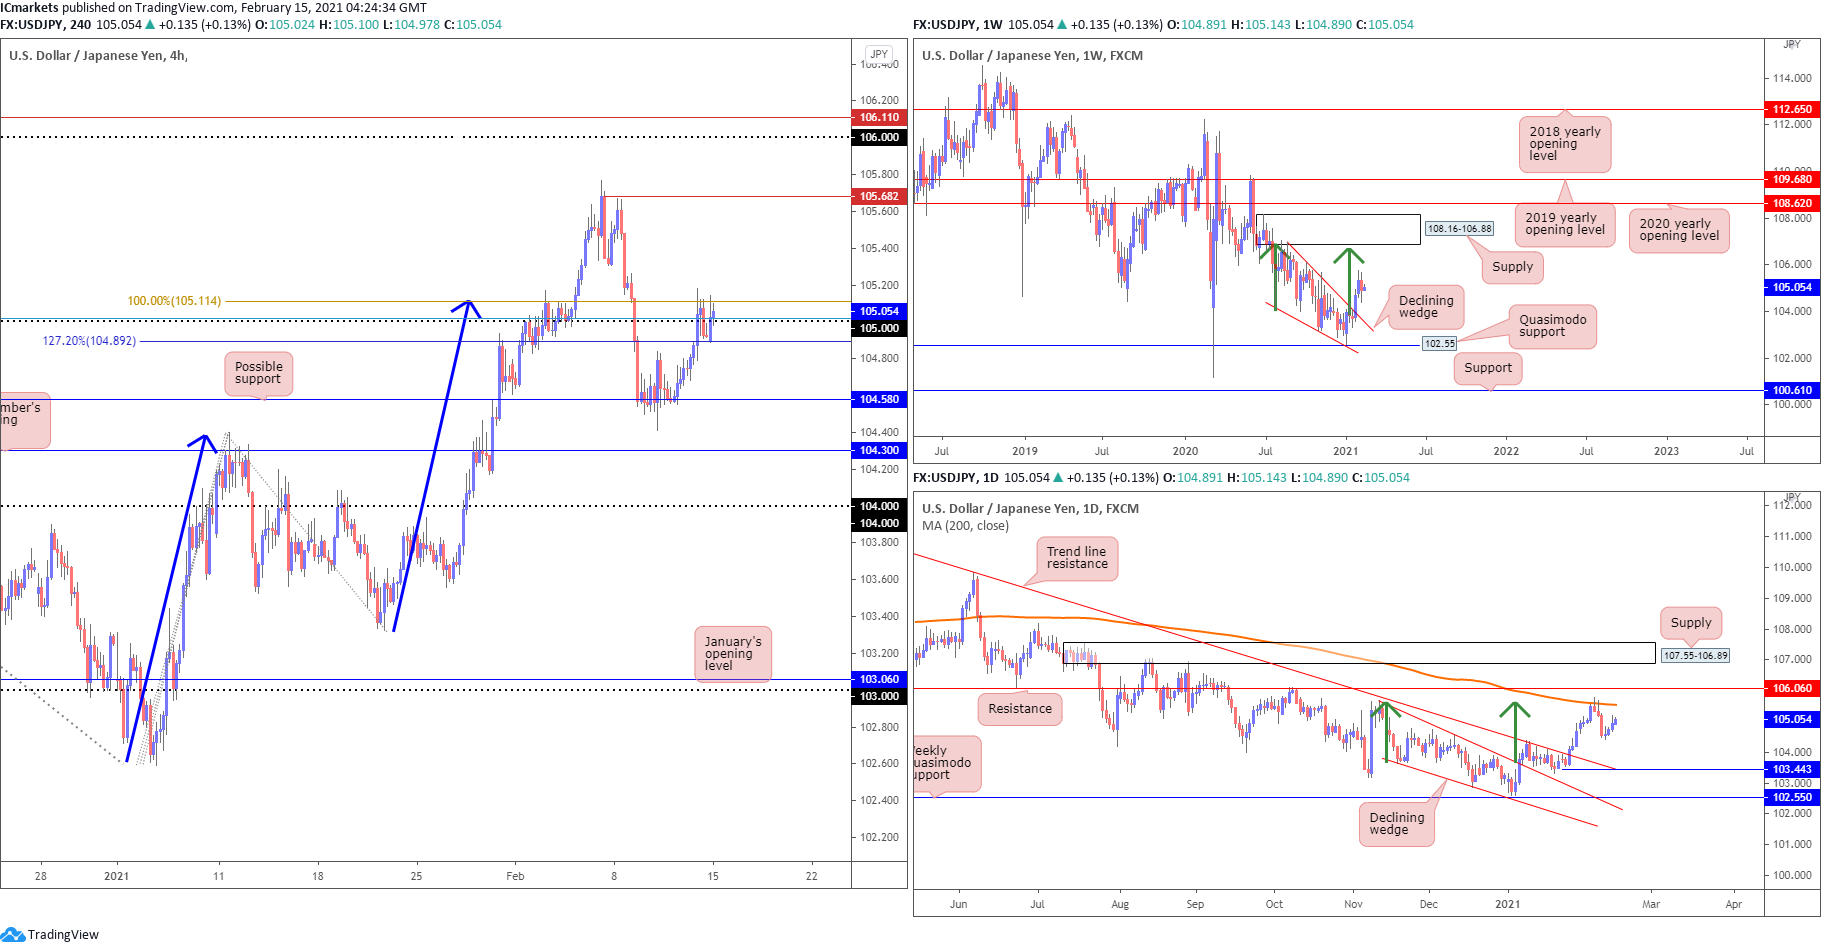
USD/JPY
The US dollar bounced on Friday towards the 100% fib extension where the AB=CD target is, after price retested 104.58 support on H4 where the horizontal overlap is . We could see buyers step in further if price breaks above 105.11.
Against the backdrop of the H4 timeframe, price is pulling back after recent breakout above the weekly declining wedge (106.94/104.18). On the daily chart, price dropped after tapping the MA200 and is pulling back to the declining wedge where it previously broke out. The daily timeframes displaying room to reach 103.443 underpins the possibility of further selling materialising south of 104.58(H4). However, before that on the H4 chart, we couldn’t ignore the support at 104.58 where the horizontal pullback support is.
Areas of consideration:
- 06 resistance on the Daily timeframe
- 114 resistance on H4 timeframe, in line with 100% fib extension ( AB=CD target)
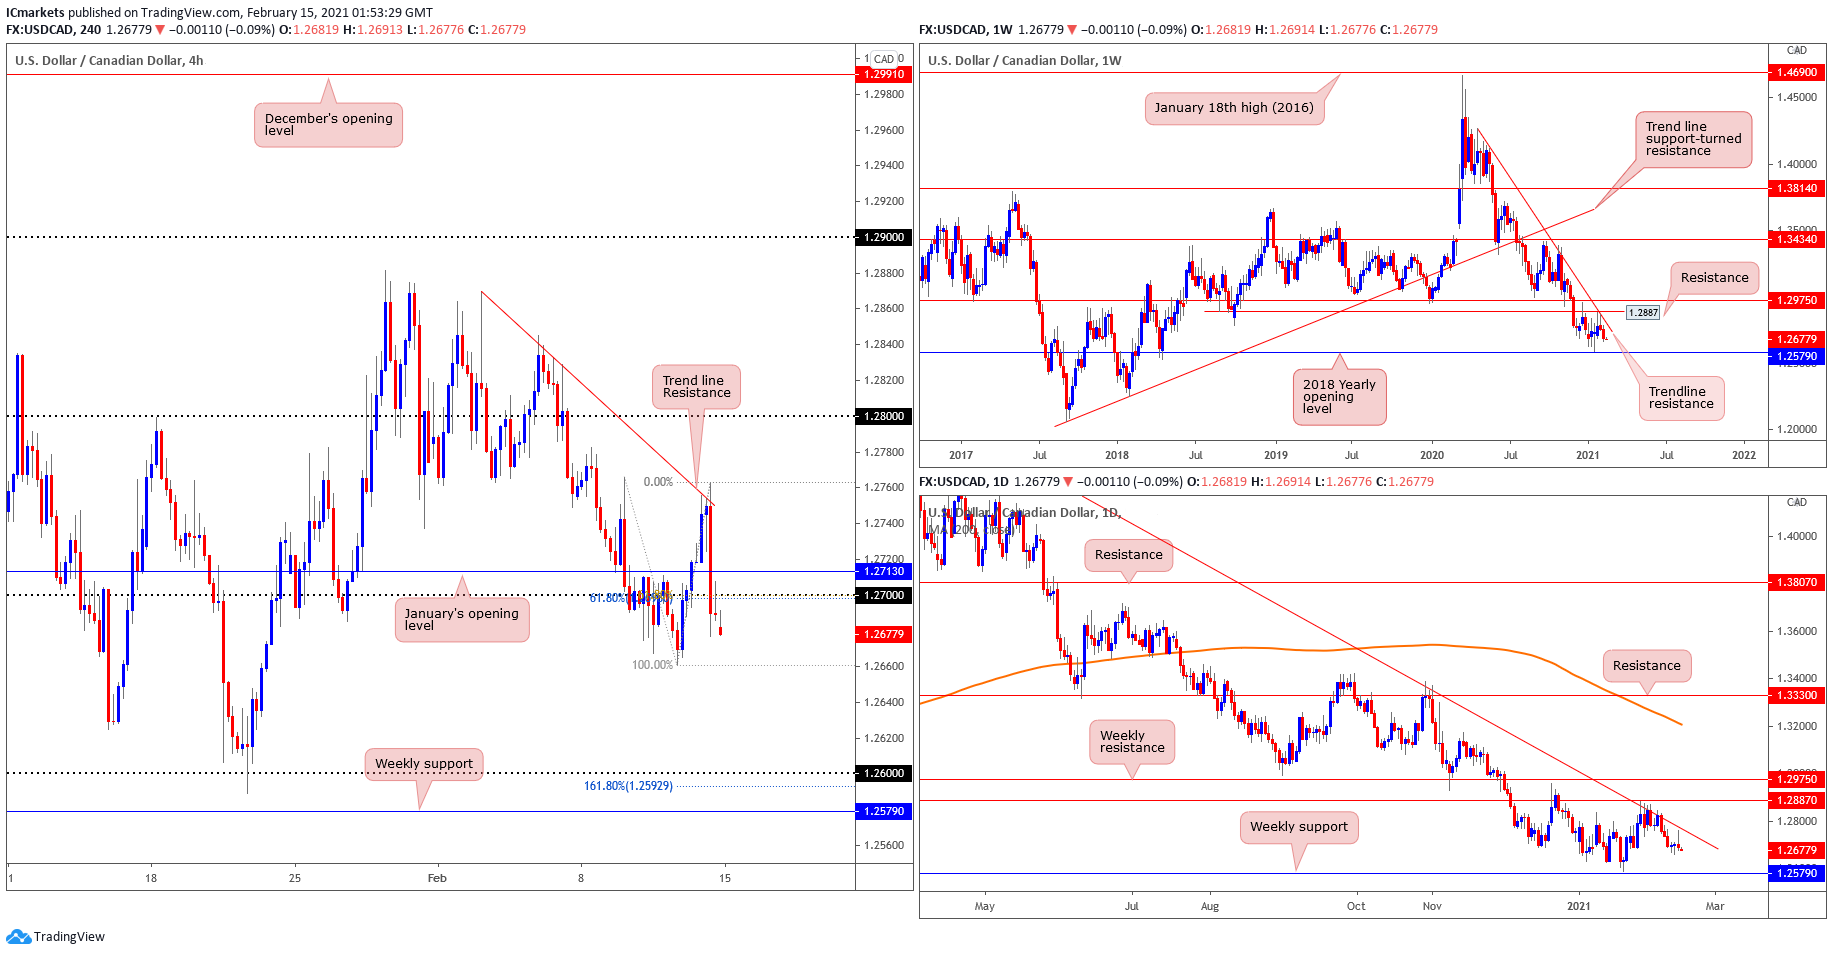
USD/CAD:
Looking at the weekly chart, prices have respected the descending trendline drawn from 13 April (2020) high, which is also the 1.2887 resistance level (a previous Quasimodo support level). It is important to note that the long-term picture has pointed the direction down (trend) since March (2020). In the daily time frame, USD/CAD has made a candlestick with a long upper shadow, this may be buyers attempt to push prices up. However, prices closed beneath opening price. We could see a short-term descending trendline drawn on the H4, from 2nd February (2021) high level. We can also find a fibonacci confluence of 61.8% retracement as well as extension level at the major figure of 1.27, which price has already broken beneath it. A retest of this level may show further bearish move to the downside of 1.266, the recent swing-low.
Areas of consideration:
- On H4, price broken pass major figure of 1.27, in line with Fibonacci 61.8% retracement and extension level. It is currently approaching the previous swing-low of 1.266
- Weekly and Daily time frame both showing strong bearish momentum.
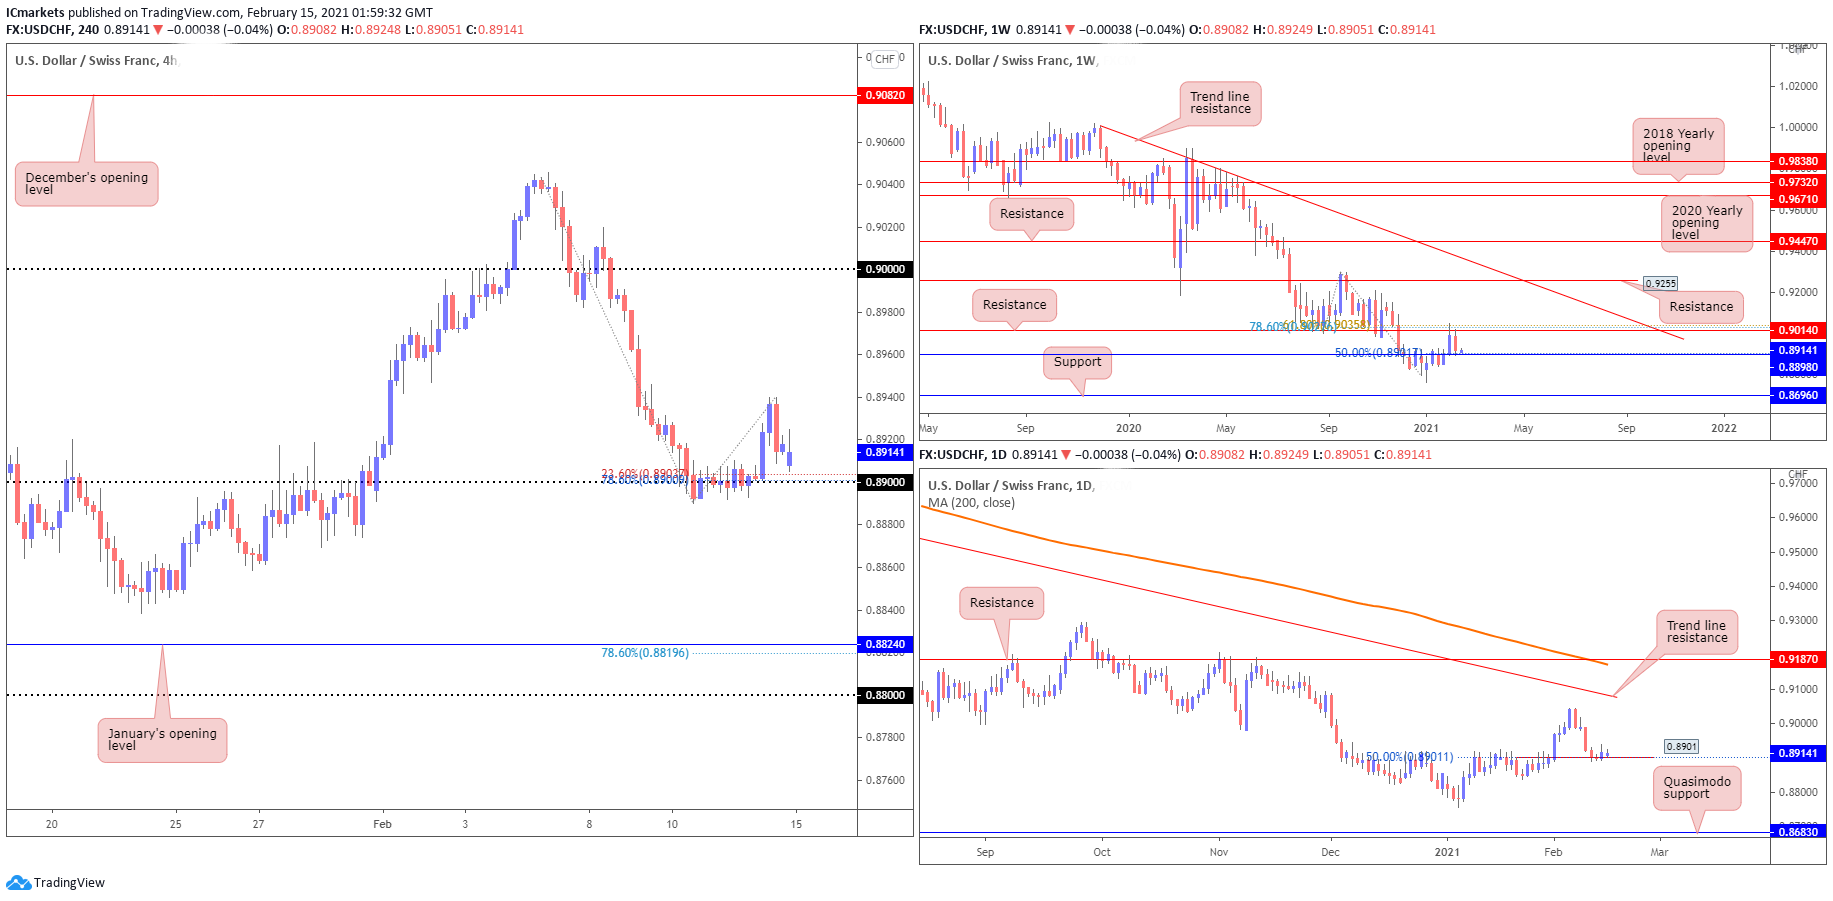
USD/CHF:
USD/CHF continues to show strong bearish momentum at the start of the week, with price holding below the descending trendline resistance and major resistance at 0.90140, in line with our 61.8% Fibonacci retracement and 78.6% Fibonacci extension. Price is showing a slight bounce at the 0.88980 level, which we expect to be a small pullback before a further push down south.
The daily timeframe shows us a similar picture, where price is showing a slight bounce at the 0.89010 level in line with our 50% Fibonacci retracement. As price continues to hold below both the descending trendline and moving average resistances, we maintain a bearish bias on USD/CHF, where we expect price to break below the 0.89010 level and push further down towards the Quasimodo support level at the 0.86830 level.
Looking to the H4 timeframe, we can see that price is testing the support level at 0.89000 level in line with our 78.6% Fibonacci retracement and 23.6% Fibonacci extension levels. In this bearish scenario, we expect to see price break below the 0.89000 level and make a further move towards the downside, with the 0.88240 level, which is January’s opening level, as a possible downside target. Otherwise, should price fail to break below the 0.89000 level, we can expect a strong pullback to the upside to test the 0.90000 level instead.
Areas of consideration:
- USD/CHF continues to show strong bearish pressure, as price holds below the trendline and moving average resistances.
- Price has bounced from, and is now re-testing, the 0.89000 level, which is a strong support level.
- 86830 daily level would be the next downside target should price make a further bearish move down.
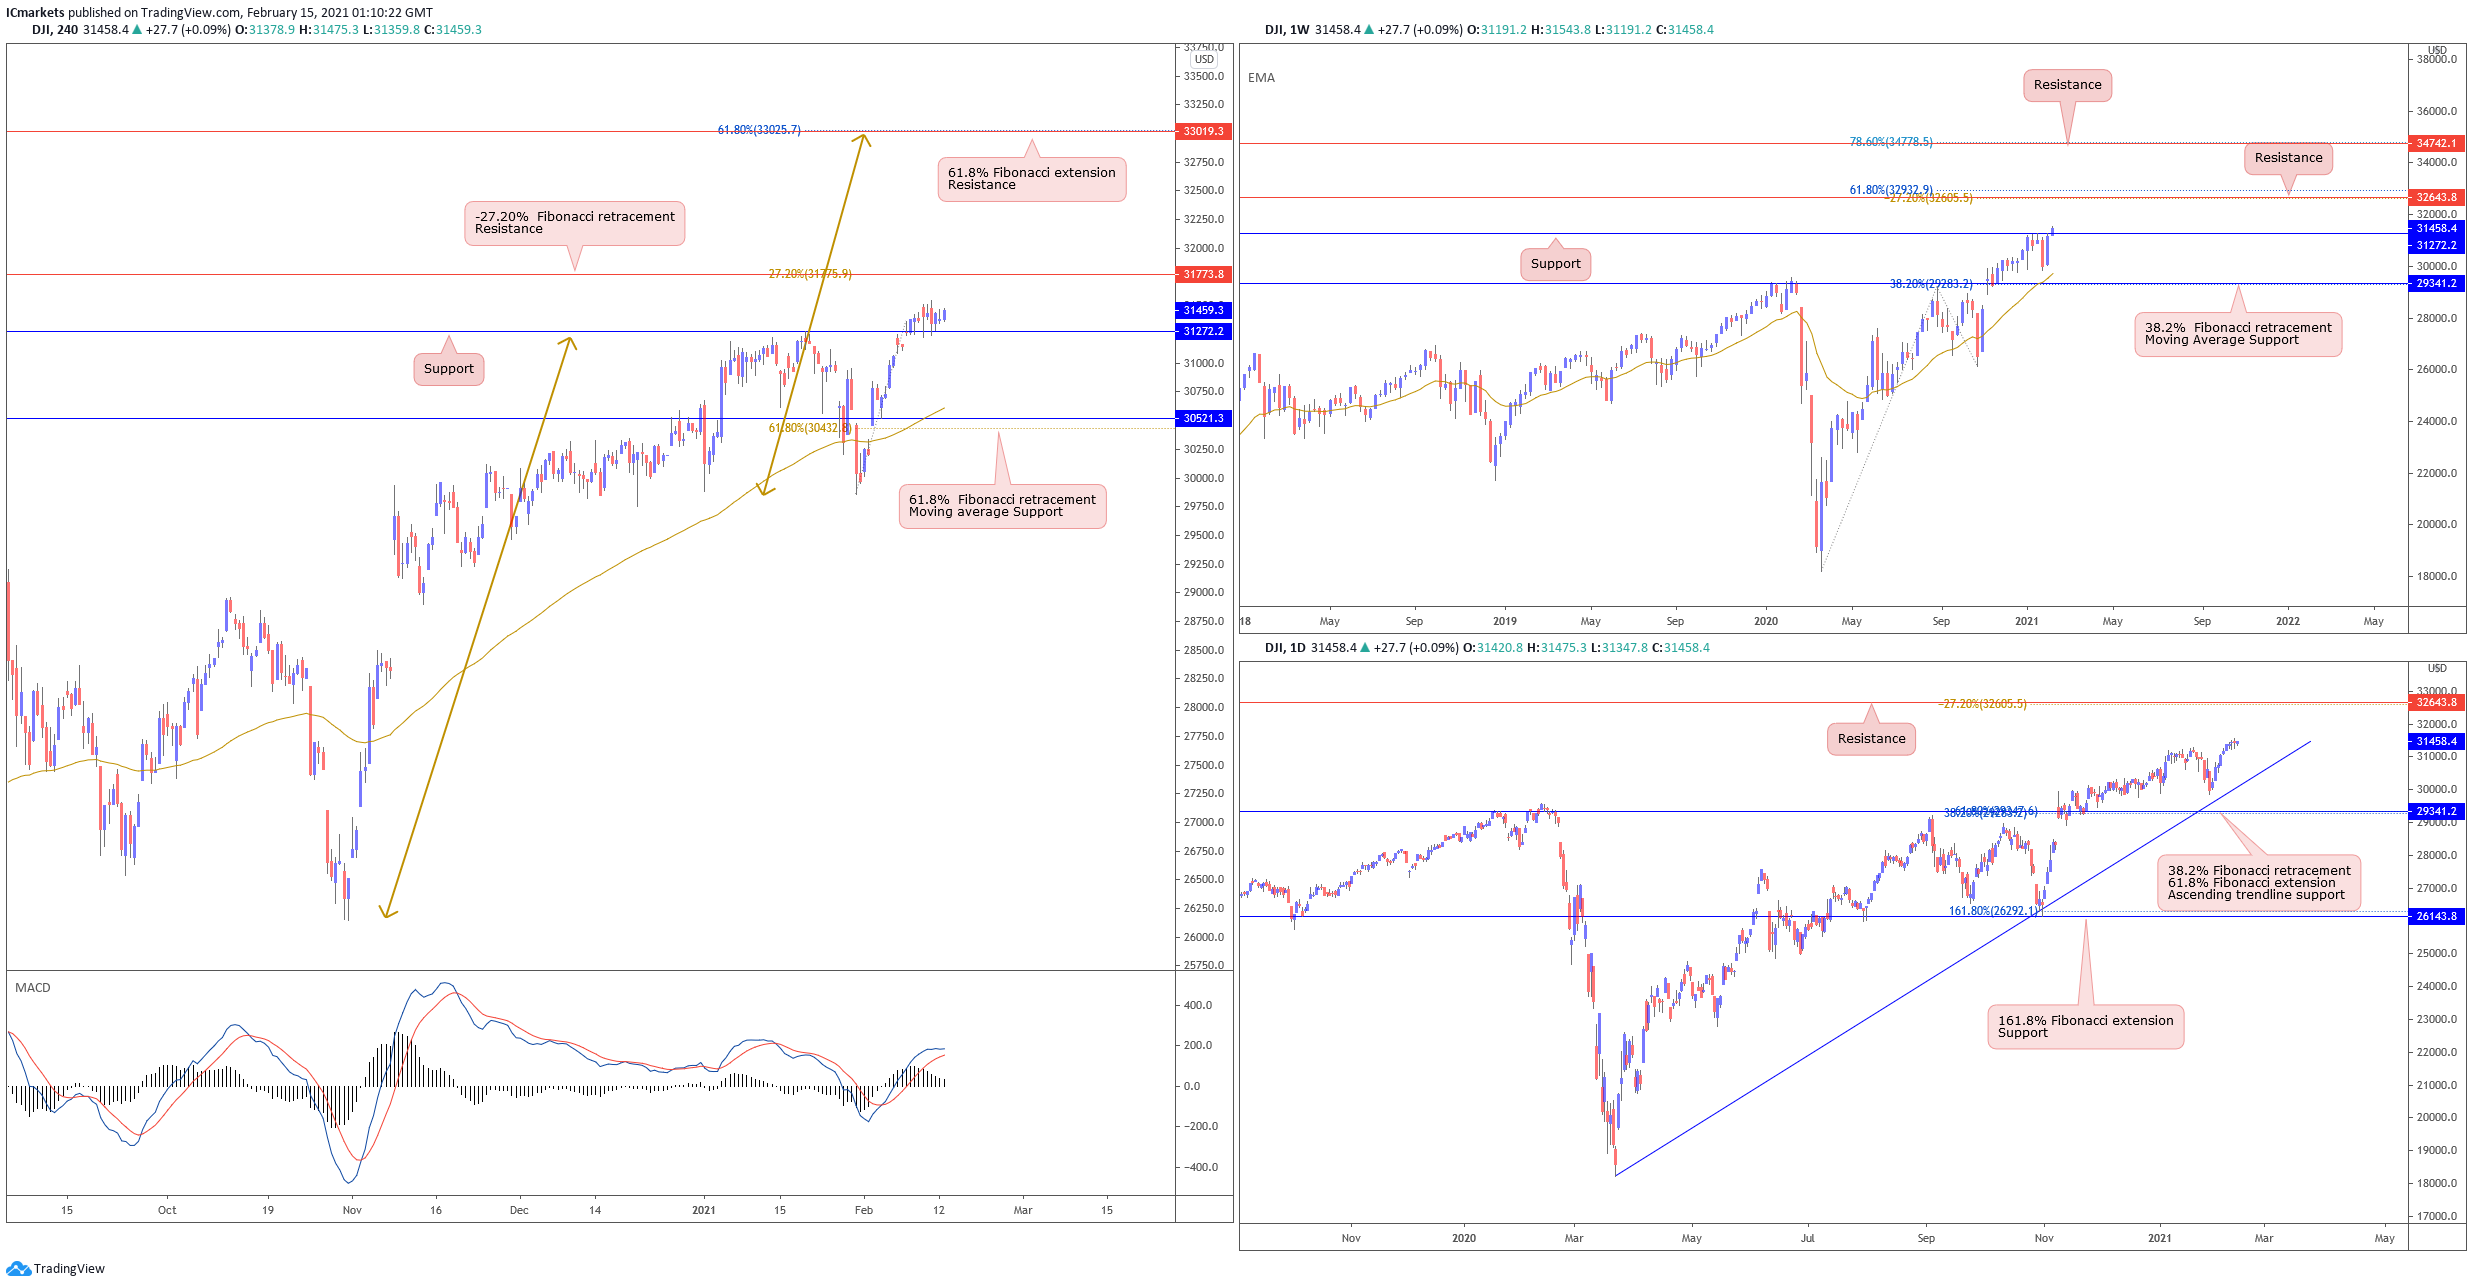
Dow Jones Industrial Average:
Last week, price formed a weekly close above 31272 as markets made a new high. Traders can expect to see price pushing even higher towards the next resistance at 32643. Otherwise, failure to hold above 31272 could mean that this is a fake out and probably pull back towards 29341 support. With no change for the Daily, price continues to hold very strongly above ascending trendline support. Traders should be careful when deciding to trade any short term pullbacks as the bullish momentum on the longer term is very strong.
On the H4, price continues to hold above 31272 support level and is currently drifting sideways. Technical indicators continue to show room for further bullish upside. 31272 is the level where we may possibly see buyers pile in and add to their longs with a possible resistance target at 31773.8. Otherwise, failure to hold above 31272 could see price swing back and come back to the 61.8% Fibonacci retracement level and moving average support at 30521.
Areas of consideration:
- 31272 key support to watch
- Bullish momentum on both the weekly and H4 chart is very strong.
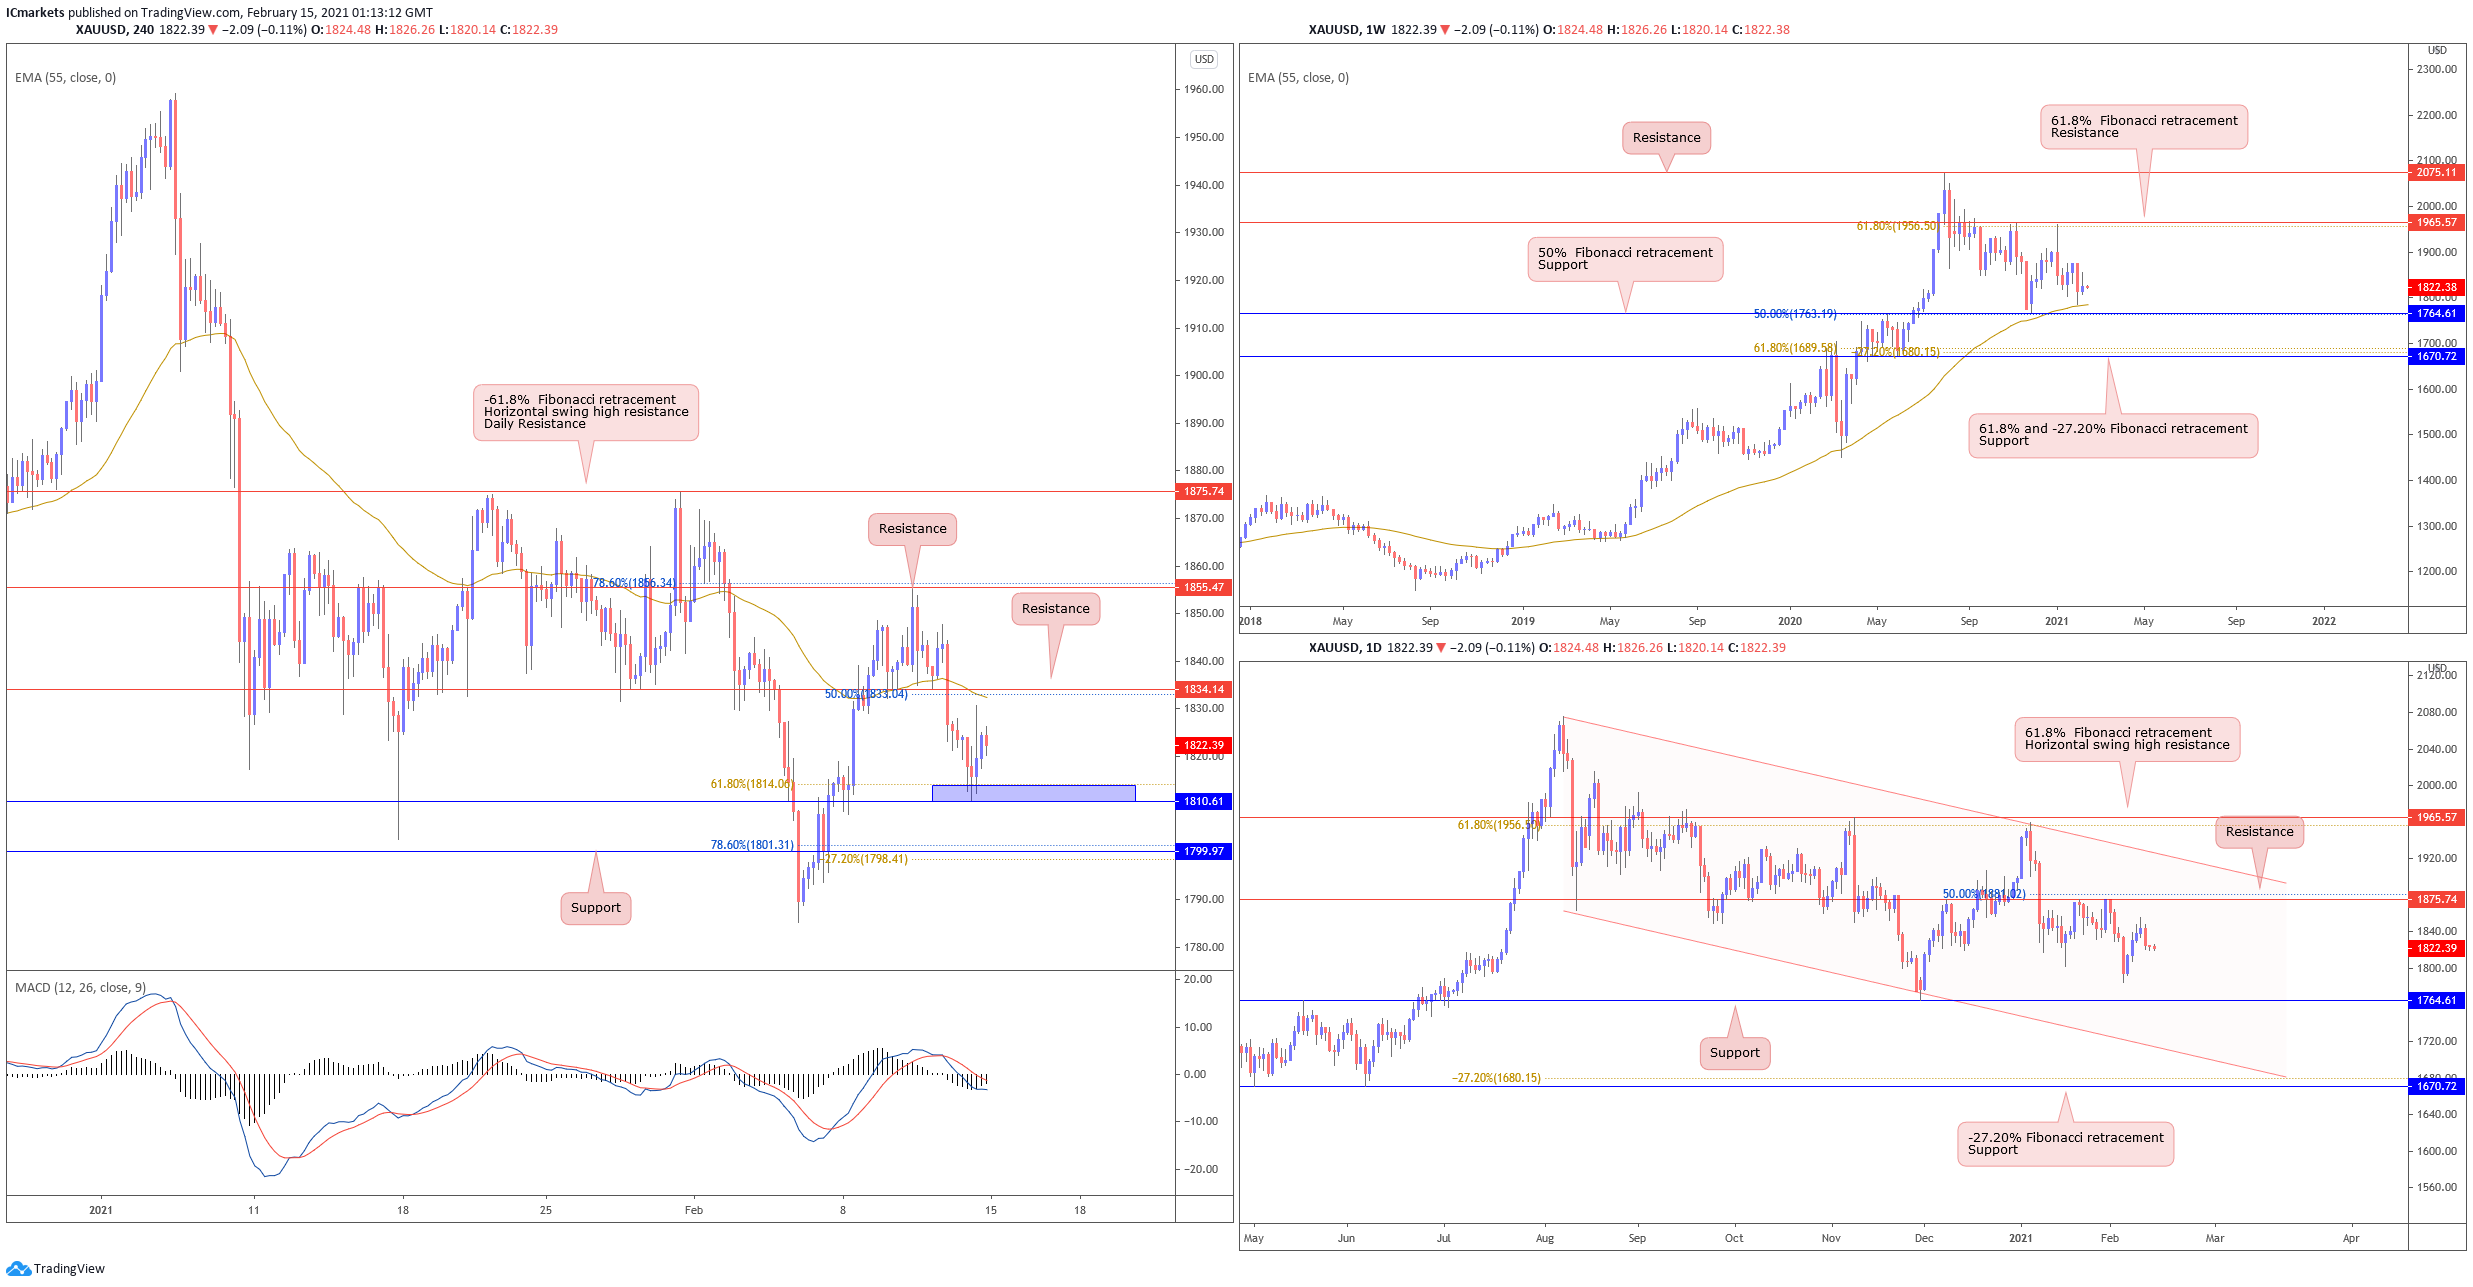
XAU/USD (GOLD):
On the weekly timeframe, gold is still holding above long term moving average support. Traders could possibly see price drift towards 1764 support showing any chance of a bounce reaction above this level. On the daily chart, price drifting sideways between 1764 support and 1875 resistance. Price could still very well be drifting sideways between these two levels until a clear break of the daily descending channel shows any confirmation of a directional bias.
On the 4H timeframe, price tested and reacted above key 61.8% Fibonacci retracement level at 1810 last week. With technical indicators showing a possibility of a bearish scenario, we should see price do a pullback below 1834 resistance. Otherwise, failure to hold below 1834 could see price swing upwards towards next resistance at 1855. Price is currently holding below moving average with MACD indicator just crossing below 0, showing room for further bearish momentum.
Areas of consideration:
- 1834 resistance to watch for a breakout on the H4
- Technical indicators such as moving average and MACD showing room for further bearish momentum on short term
The accuracy, completeness and timeliness of the information contained on this site cannot be guaranteed. IC Markets does not warranty, guarantee or make any representations, or assume any liability regarding financial results based on the use of the information in the site.
News, views, opinions, recommendations and other information obtained from sources outside of www.icmarkets.com.au, used in this site are believed to be reliable, but we cannot guarantee their accuracy or completeness. All such information is subject to change at any time without notice. IC Markets assumes no responsibility for the content of any linked site.
The fact that such links may exist does not indicate approval or endorsement of any material contained on any linked site. IC Markets is not liable for any harm caused by the transmission, through accessing the services or information on this site, of a computer virus, or other computer code or programming device that might be used to access, delete, damage, disable, disrupt or otherwise impede in any manner, the operation of the site or of any user’s software, hardware, data or property.


