EURUSD:
Price bounced yesterday, but ran into strong resistance at 1.05. A clear break and daily close above the aforementioned level could suggest that a larger short squeeze might happen in the near-term, targeting 1.0670 resistance (Dec 14 high).
However, given how weak the bounces have been so far, the probability for that is currently low. Selling interest remains strong, and in the medium-term, a move towards parity seems quite possible.

GBPUSD:
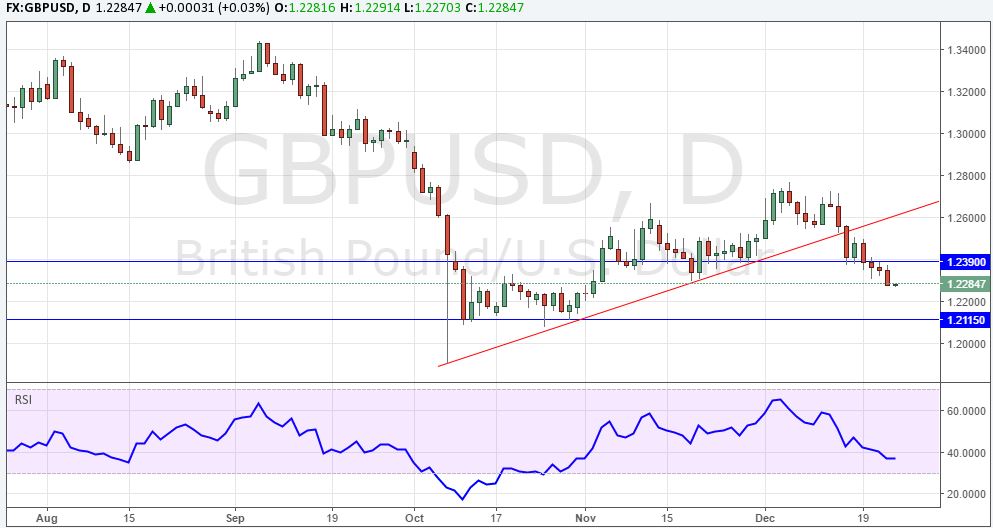
After the break and daily close below 1.23 in GBP/USD, further losses can be expected. A look at the Daily chart reveals that there is now no major technical support until 1.2110/15, and given that the RSI is not yet showing oversold conditions, it is likely that we will see this area tested in the near-term.
However, given that the hourly charts do show oversold conditions, traders might want to wait for a bounce to sell it. The first area to watch is 1.2390/1.24, which previously acted as key support and where the pair already got rejected twice on Wednesday.
USDJPY:
USD/JPY has entered a phase of short-term consolidation. As visible on the H4 chart, it is currently trading within a triangle pattern and a breakout seems imminent. It is also close to testing trendline support from the Dec 8 low. USD/JPY remains in overbought territory on the Daily chart, and even the Weekly RSI is now above 70, suggesting that a deeper retracement could occur soon.
Going back to the H4 chart, traders looking to establish a long position, should look for strong support at 116.10/20, which previously acted as key resistance area.

AUDUSD:
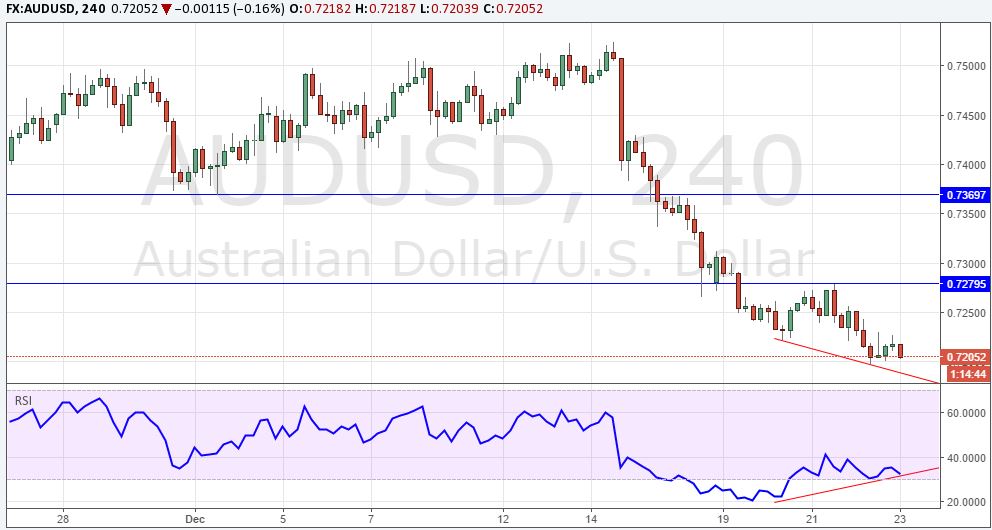
AUD/USD remains under pressure, but the H4 chart is showing positive RSI divergence, suggesting that the down move could run out of momentum soon, and we might see a bounce. How far it will rally is another question, as the technical outlook is clearly negative and the downtrend remains strong overall. Traders should keep an eye on the 0.7280 level.
A clear rejection would suggest that the downtrend will continue immediately, with 0.71 the next bear target. However, a break above would imply that we might see a short squeeze in the short-term, and 0.7370/80 would then be the next key resistance area to watch.
NZDUSD:
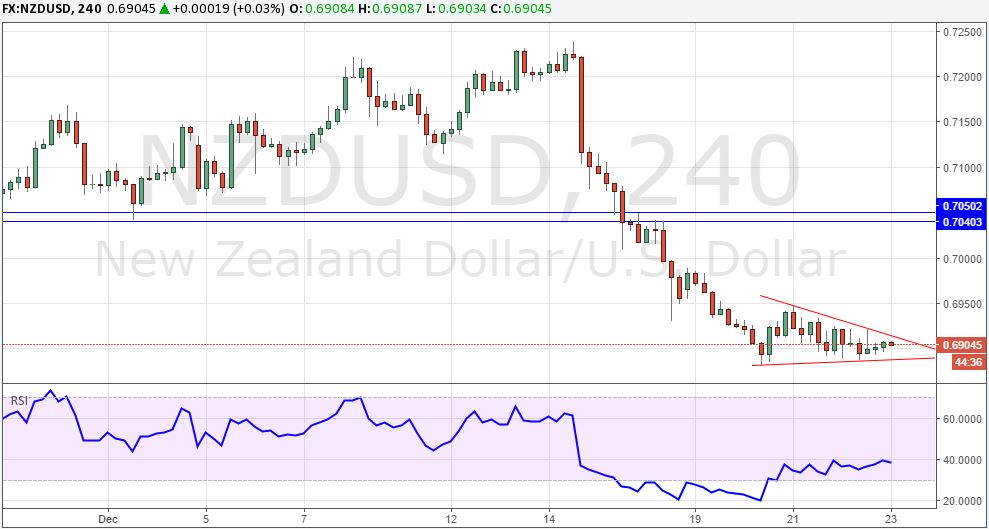
Price action in NZD/USD looks quite similar to the Australian Dollar, and the pair has been consolidating in the past few trading sessions after a sharp decline earlier this week. The break a daily close below 0.6950 is quite bearish and suggests further losses are ahead, although it does look stretched in the short-term, similar to the AUD/USD.
Traders can expect immediate resistance at 0.6950, followed by 0.70. However, the really interesting area to watch is 0.7040/50, and it can be expected that we'll see a strong reaction there, should NZD/USD be able to rally there. To the downside, a look at the Weekly shows that following the break sub-0.69, there is not much support now until 0.6675.
USDCAD:
USD/CAD had a strong rally this week, despite Oil prices still rising (positive CAD-Oil correlation). It almost reached the 1.35 level overnight, and it seems likely that we will see another test of 1.3590 resistance level (November high) in the near-term.
Keep an eye on that level, as a break above would suggest that we will see an extension of the uptrend to at least 1.3860.

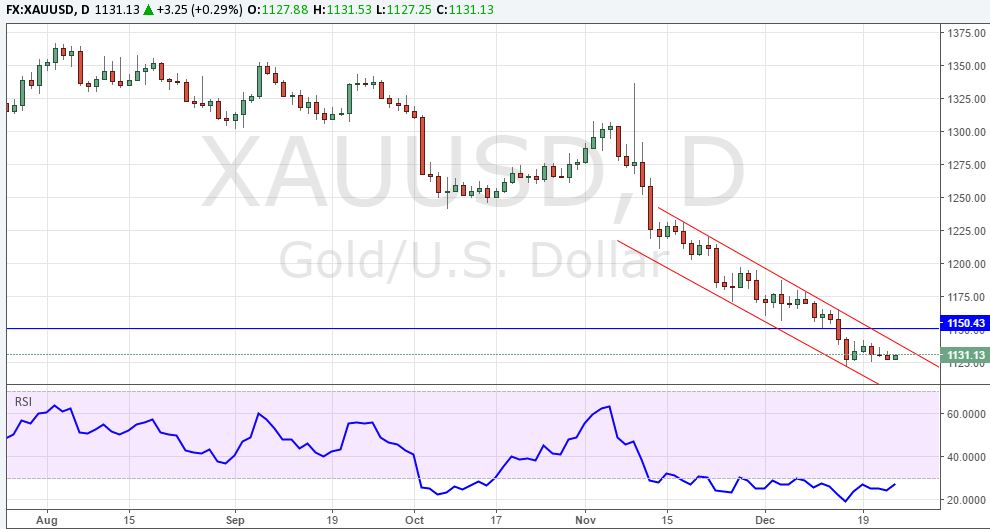
XAUUSD:
The downtrend in Gold is so far not showing any signs of exhaustion, despite being in oversold territory for quite some while already (see Daily chart). Traders looking to short it on rallies, might want to keep an eye on the $1150 level, which previously acted as key support and which we have not retested yet.
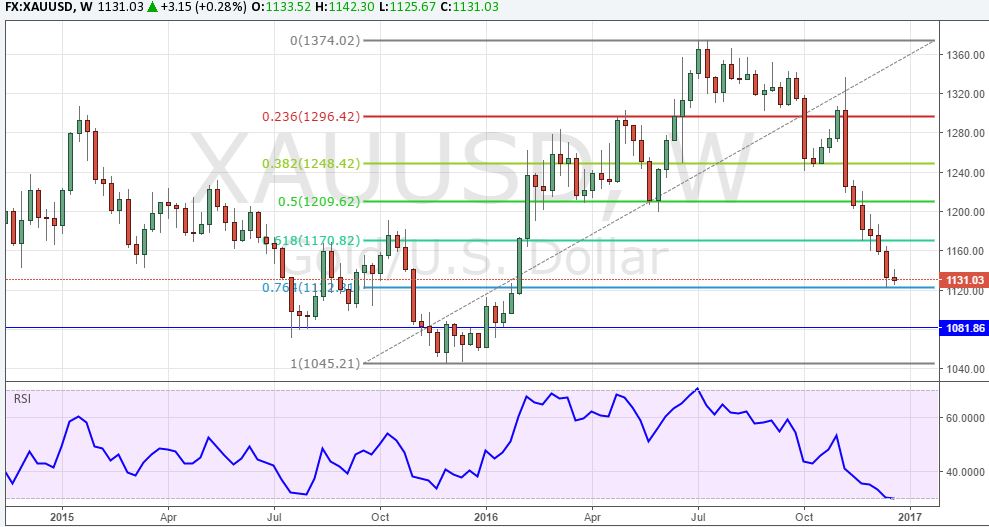
If we zoom out to the Weekly and draw a Fib retracement from the 2015 low to the Summer 2016 high, we see that Gold is trading near the 76.8 % Fib, and has so far found decent support there. A break below would suggest a move to at least $1081, with the next major support level then $1045.