DXY:
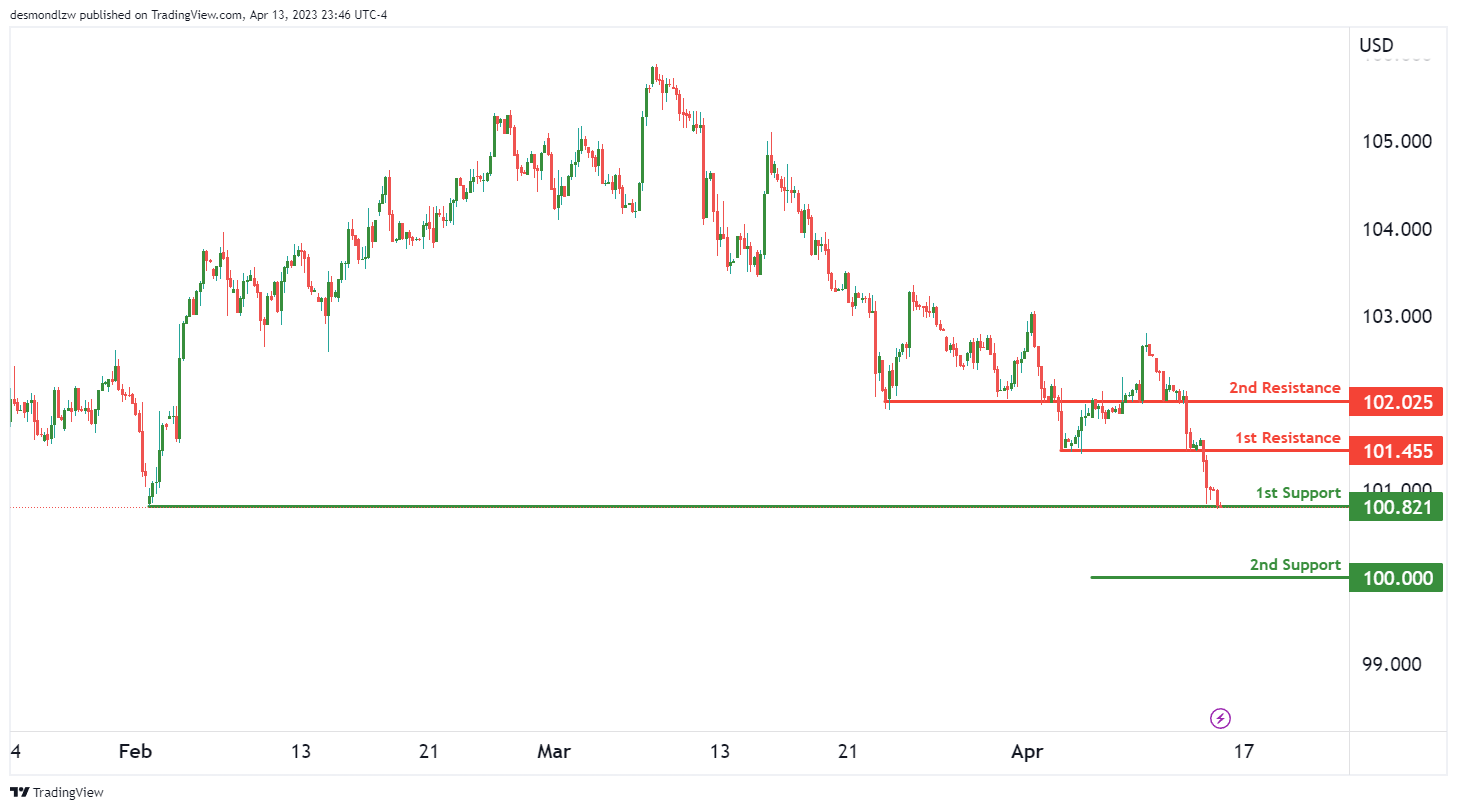
The overall momentum of the DXY chart appears to be bearish. If the bearish trend continues, the price could potentially make a bearish break off the 1st support level at 100.82 and drop towards the 2nd support level at 100.00. The 1st support level is a swing low support, while the 2nd support level is a big figure support.
On the resistance side, we have the 1st resistance level at 101.45, which is a pullback support level that could potentially act as resistance if the price were to bounce up. The 2nd resistance level is at 102.02, which is an overlap resistance that the price has struggled to break through in the past.
Overall, it appears that the price could potentially continue to drop towards the 2nd support level, especially given the bearish momentum on the chart. Traders should keep an eye on these key support and resistance levels and monitor any potential reversals or breakouts that could signal a shift in momentum.
EUR/USD:
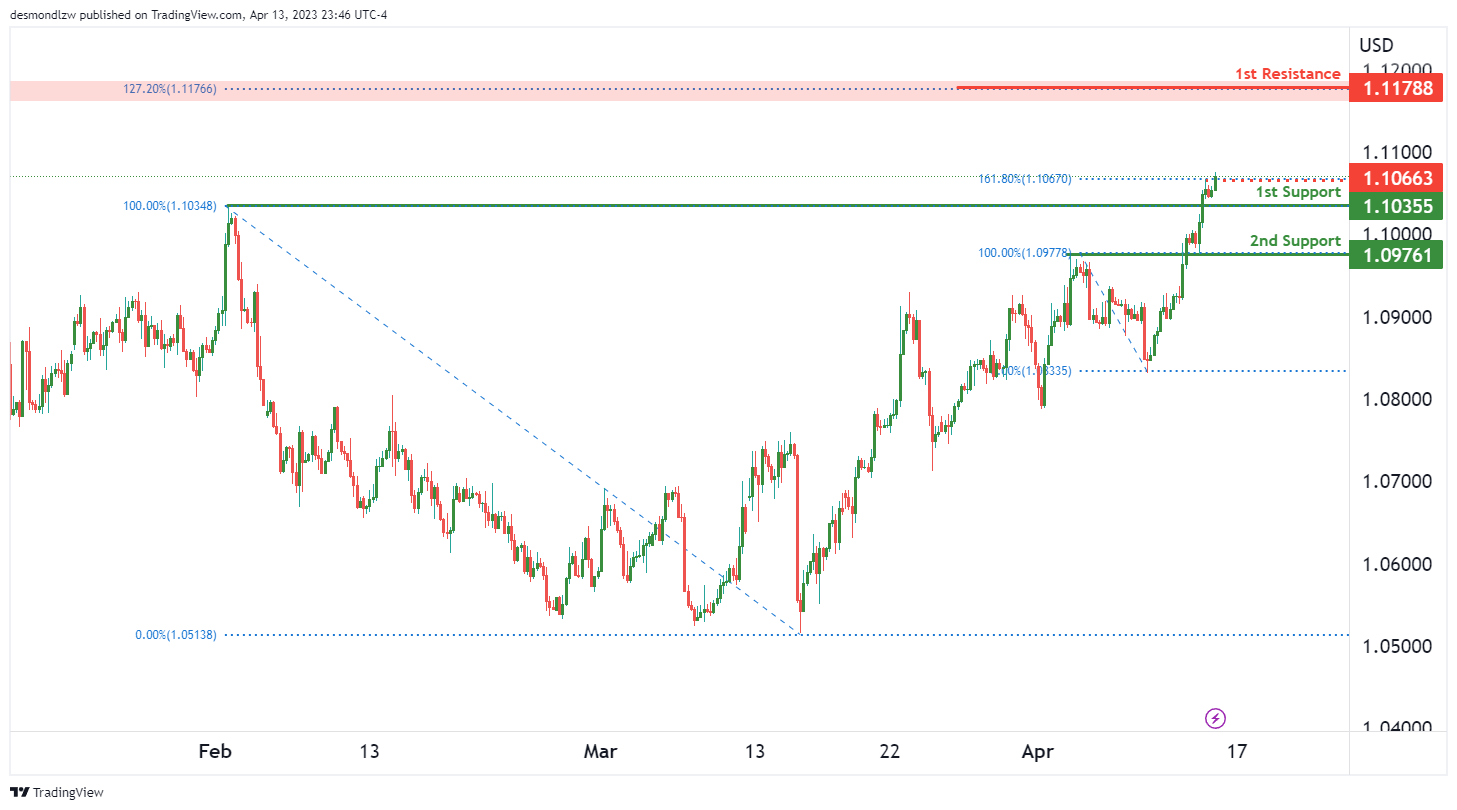
The EUR/USD chart is currently displaying bullish momentum, which suggests that we may see further price increases in the near future. At the time of writing, the price is trading around 1.1105.
If the bullish trend continues, the price could potentially make a bullish breakout above the current level and rise towards the 1st resistance level at 1.1178. This resistance level is a swing high resistance and also coincides with a 127.20% Fibonacci Extension level, making it a strong level of resistance that the price may struggle to break through.
On the support side, we have the 1st support level at 1.1035, which is a pullback support level and has shown strength in holding the price up. If the price were to break through the 1st support level, the next support level is the 2nd support level at 1.0976, which is also an overlap support level that the price has bounced off multiple times in the past.
Additionally, there is an intermediate resistance at 1.1066, which is between the current price and the 1st resistance level. If the price were to break through this intermediate resistance, it could trigger a stronger bullish acceleration towards our 1st resistance.
GBP/USD:
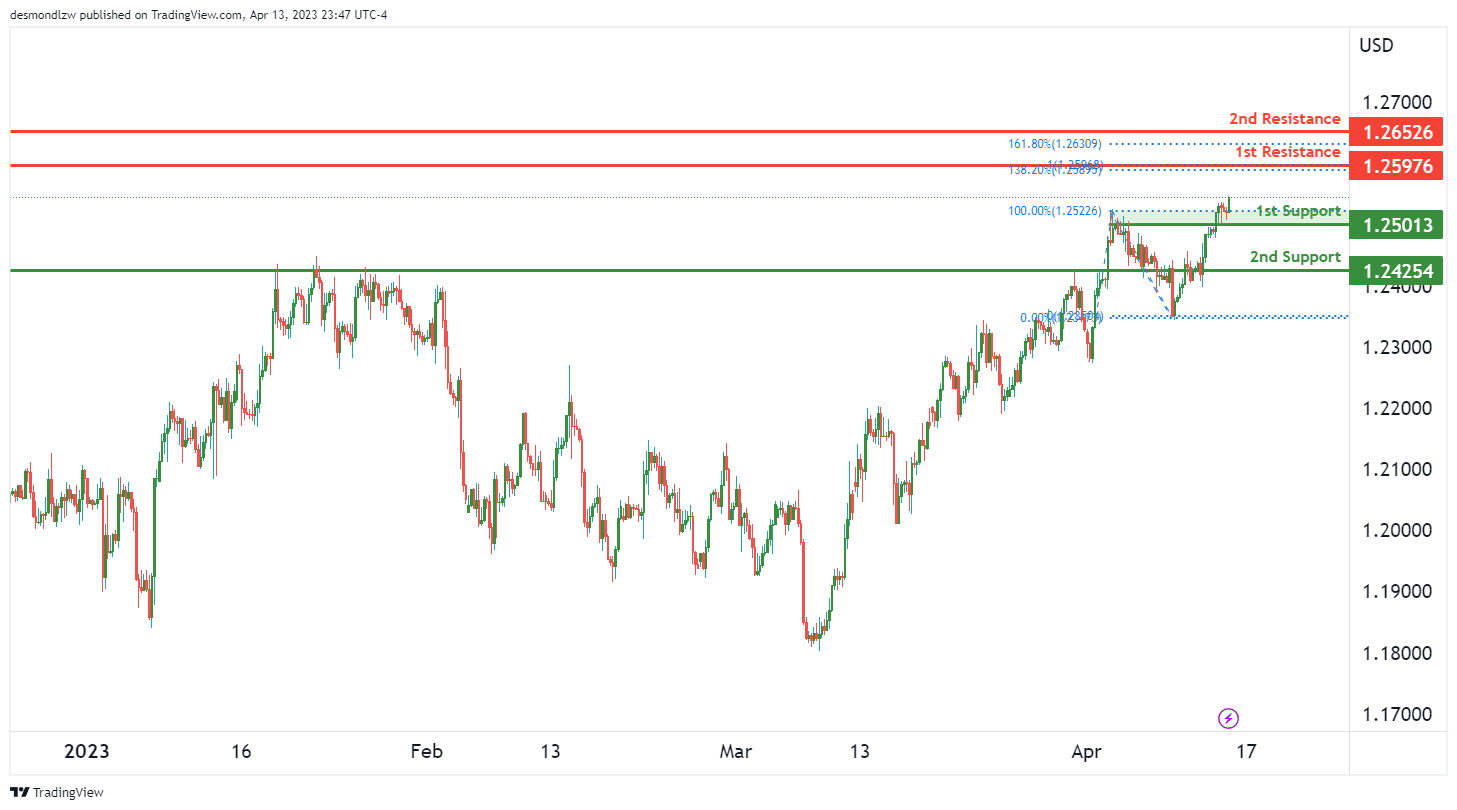
Based on the analysis, the overall momentum of the GBP/USD chart is bullish. There is potential for a bullish continuation towards the 1st resistance level of 1.2597, which is a swing high resistance that coincides with a 138.20% Fibonacci Extension level.
The 1st support level is at 1.2501, which is an overlap support level. If the price were to drop, it could potentially find support at the 2nd support level of 1.2425, which is also an overlap support level.
On the resistance side, there is the 2nd resistance level at 1.2652, which is a swing high resistance that coincides with a 161.80% Fibonacci Extension level.
It’s important to note that prices could fluctuate between the support and resistance levels, but if the bullish momentum continues, we could potentially see prices rise from the 1st support level towards the 1st resistance level.
USD/CHF:
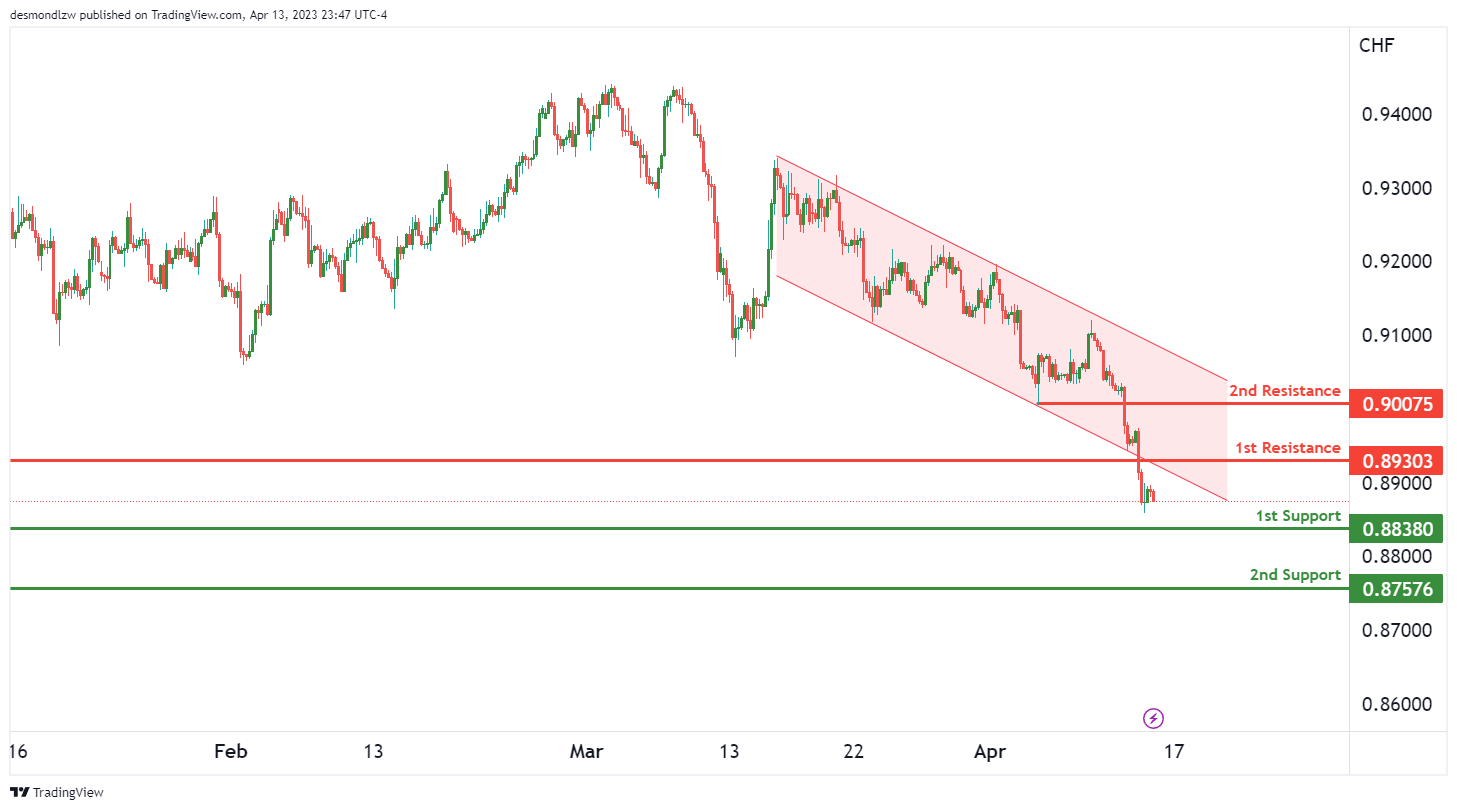
The USD/CHF chart is showing a bearish momentum, as the price has broken from the lower channel line indicating a continuation of the prior bearish trend. In terms of potential price action, there could be a bearish continuation towards the 1st support at 0.8838. This level is a swing low support and could potentially provide a price bounce. If the price were to break this support level, the next level down would be the 2nd support at 0.8757 which is another swing low support.
On the resistance side, the 1st resistance is at 0.8930 which is an overlap resistance. This level could potentially act as a price barrier preventing the price from rising further. The 2nd resistance is at 0.9007 which is a pullback resistance. If the price were to break this resistance level, it could potentially continue to rise further. It’s important to note that the bearish momentum is still strong and could continue to push the price towards the support levels.
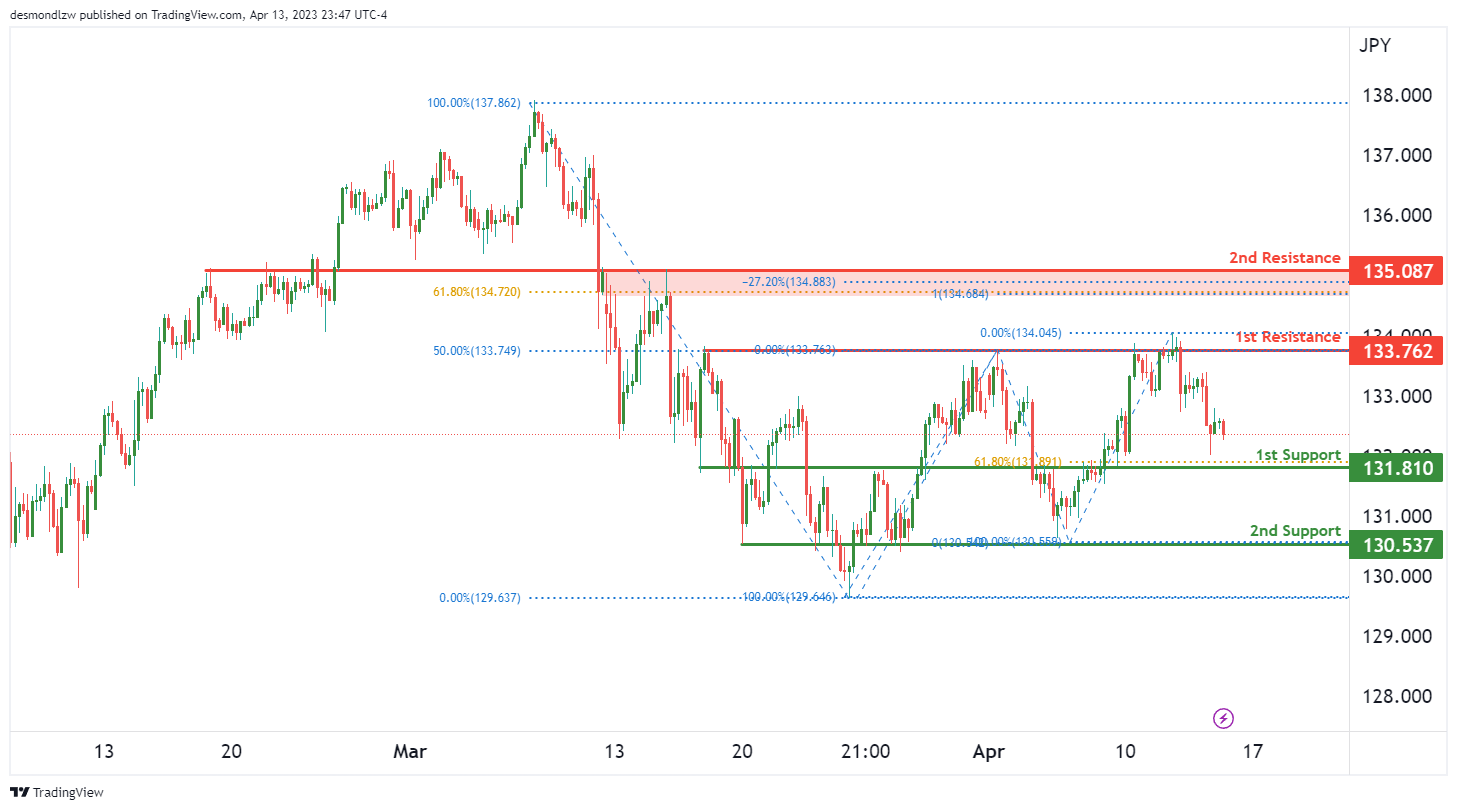
USD/JPY:
USD/JPY is currently experiencing bearish momentum on the chart, which suggests that we might see further drops in the near future. Price could potentially continue to drop towards our 1st support level at 131.81, which is a strong overlap support level that aligns with the 61.80% Fibonacci retracement. This level has been tested multiple times in the past and could potentially provide a strong barrier for prices to drop further.
If prices were to break the 1st support level, the next support level it could drop to is the 2nd support level down at 130.53. This level is also an overlap support level that has been tested in the past and could potentially provide a good level for prices to bounce back up from.
On the other hand, if prices were to rise, our 1st resistance level is at 133.76, which is an overlap resistance level that aligns with the 50% Fibonacci retracement. If prices were to break this level, it could potentially rise further towards our 2nd resistance level at 135.08. This level is a pullback resistance level that aligns with the 61.80% Fibonacci retracement.
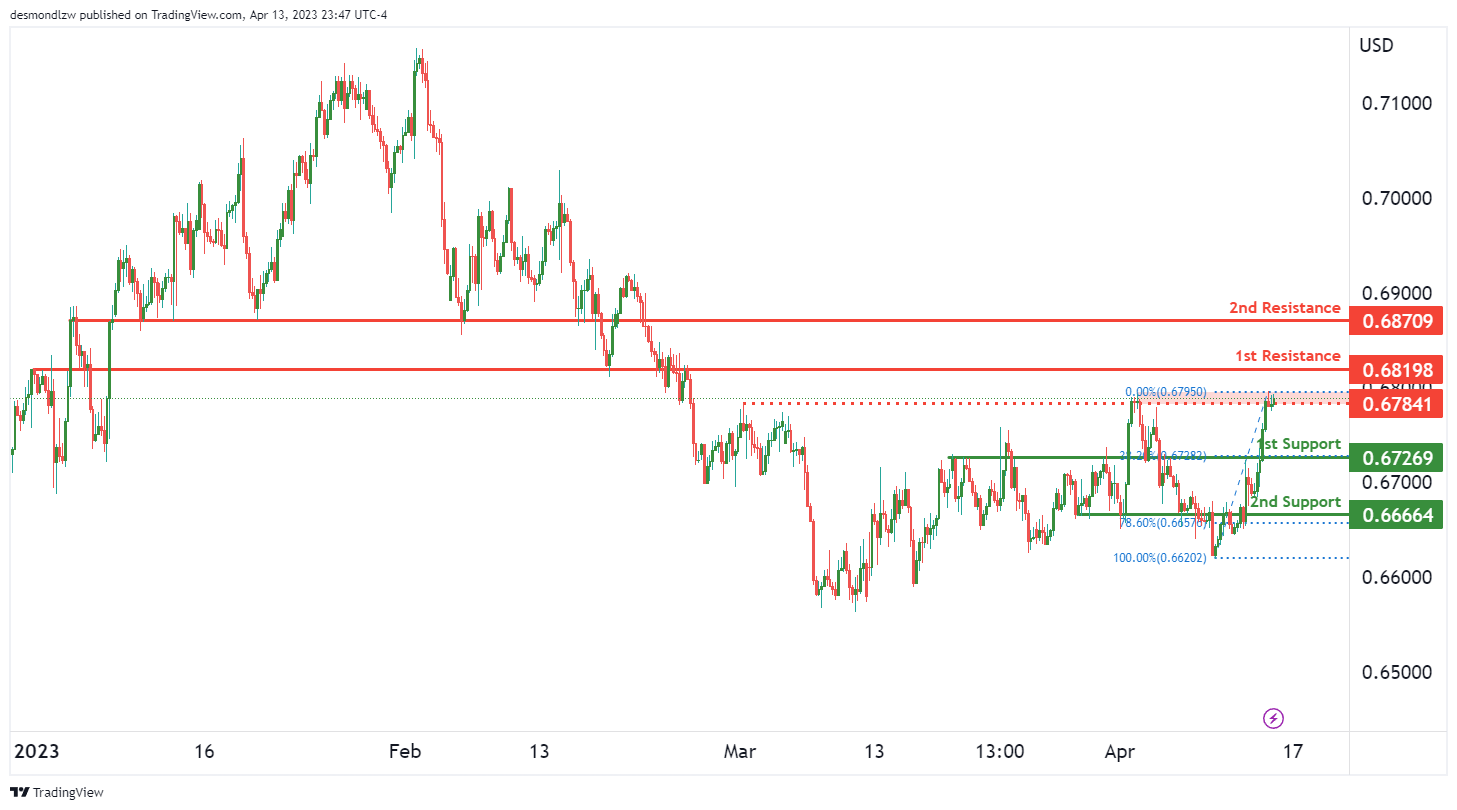
AUD/USD:
The AUD/USD chart is bullish. The current potential for price is to make a bullish continuation towards the 1st resistance level.
The 1st support level is at 0.6726 and it is considered good because it is an overlap support level with a 38.20% Fibonacci retracement. Additionally, the 2nd support level at 0.6666 is also a good level because it is an overlap support level with a 78.60% retracement.
On the other hand, the 1st resistance level is at 0.6819 and it is considered a good level because it is an overlap resistance level. The 2nd resistance level at 0.6870 is also a good level because it is an overlap resistance level. There is also an intermediate resistance level at 0.6784 which is considered a good level as it is a multi-swing high resistance level.
If the price were to break the 1st resistance level, it could potentially rise towards the 2nd resistance level. However, if it were to break the 1st support level, it could drop towards the 2nd support level. It’s worth noting that there is strong bullish momentum and support levels are considered as good buying opportunities. Therefore, there is potential for prices to rise from support to resistance.
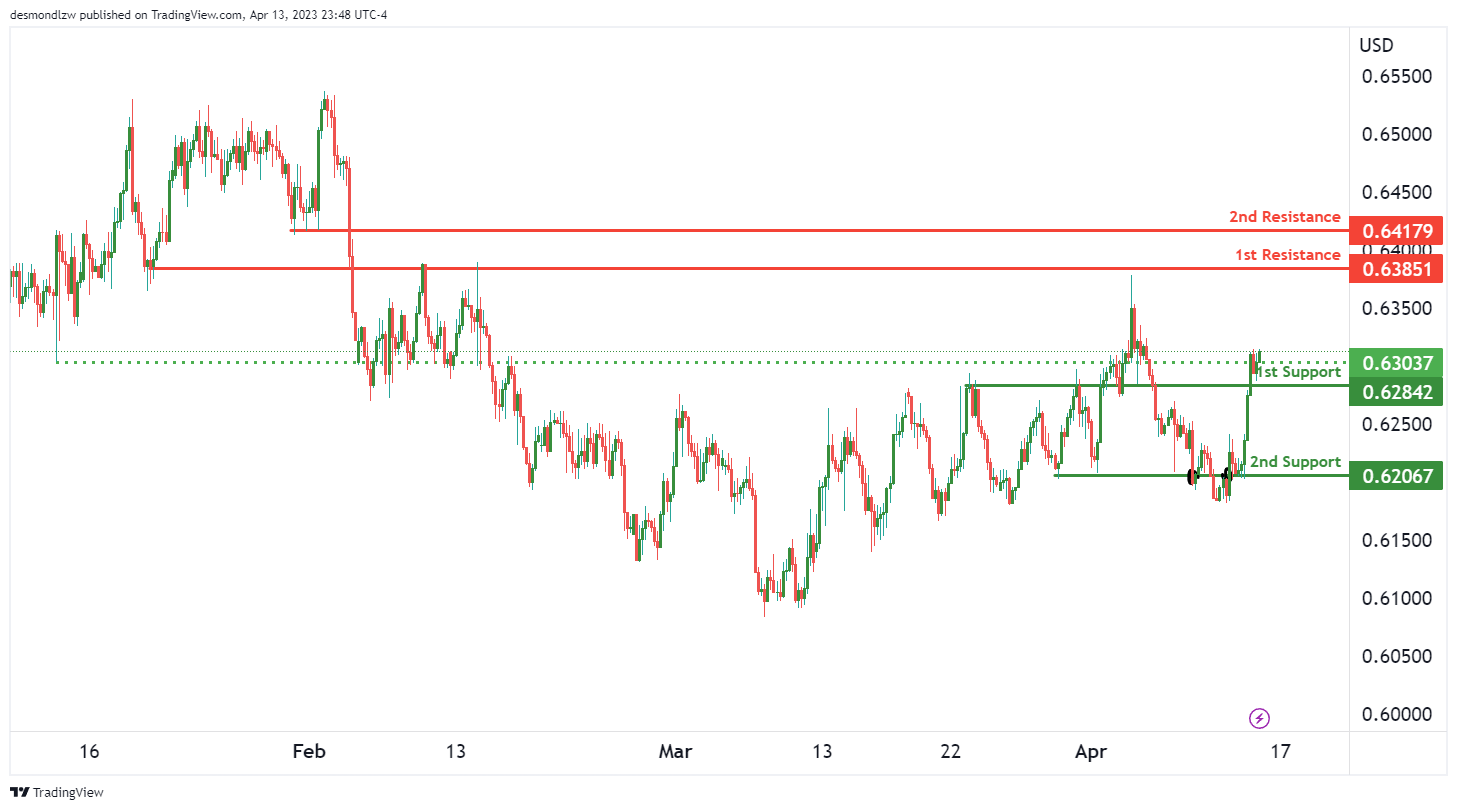
NZD/USD:
The NZD/USD chart is currently exhibiting bullish momentum, and price could potentially continue to rise towards the 1st resistance level. The 1st support level is at 0.6284, which is a strong overlap support. If price were to drop, it could find further support at the 2nd support level of 0.6206, which is another overlap support.
On the other hand, if price were to rise, it could encounter resistance at the 1st resistance level of 0.6385, which is an overlap resistance. If price were to break above this level, it could potentially continue to rise towards the 2nd resistance level of 0.6417, which is a pullback resistance.
Additionally, there is an intermediate support level at 0.6303, which is also an overlap support. This level could potentially provide additional support if price were to drop.
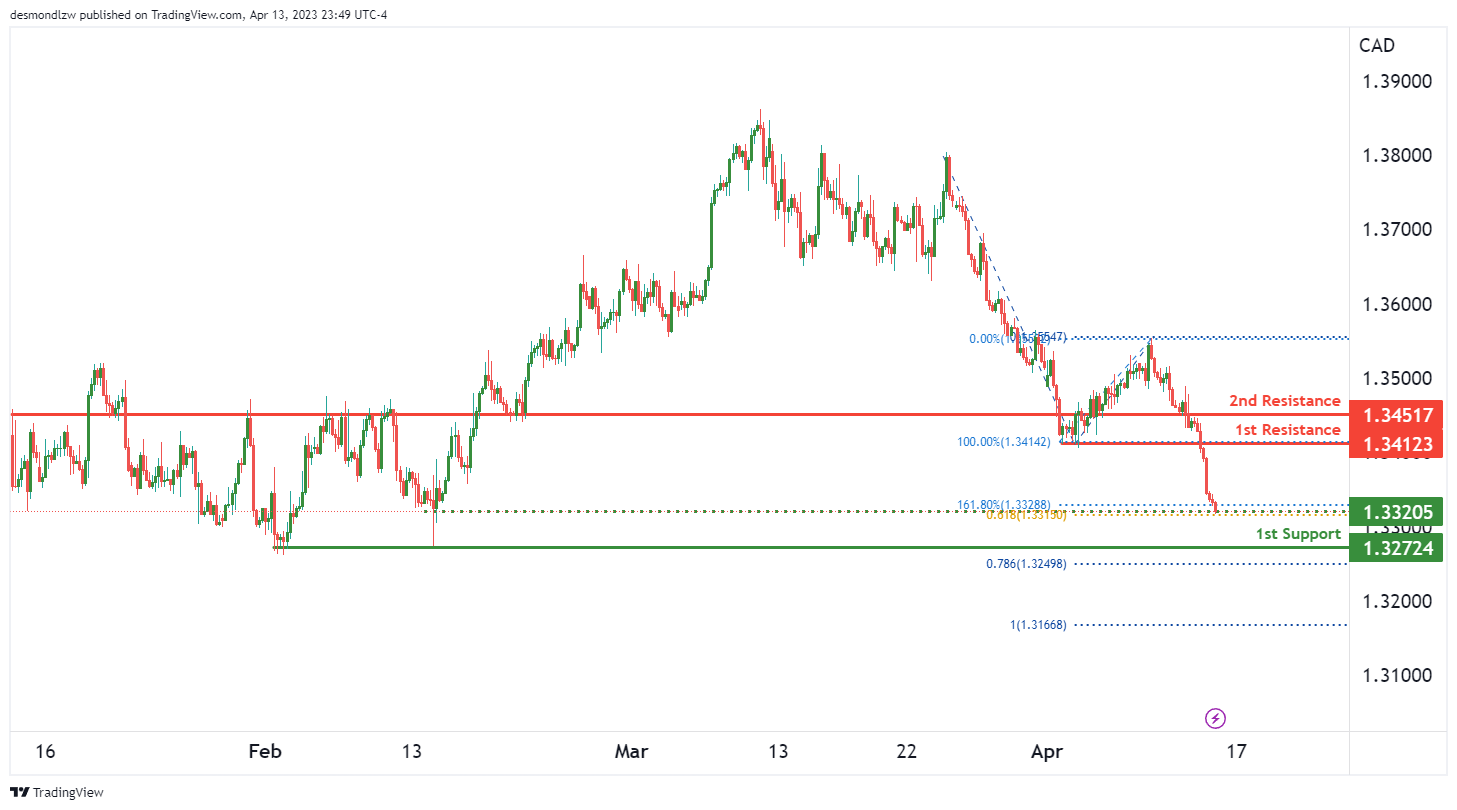
USD/CAD:
The USD/CAD chart is currently showing bearish momentum, which means that prices are more likely to continue to fall. This is due to the price breaking from the lower channel line which suggests the continuation of the prior bearish trend.
If the current trend persists, prices could potentially move towards the 1st support level at 1.3272. This is a multi-swing low support level that could provide some resistance against further price declines.
On the other hand, there are two resistance levels that could limit the potential for price increases. The 1st resistance level at 1.3412 is an overlap resistance, while the 2nd resistance level at 1.3451 is also an overlap resistance that could potentially provide strong resistance against any bullish momentum.
If there is a reversal in trend, the intermediate support level at 1.3320 could provide some support for the price. This level is also a swing low support that lines up with the 61.80% Fibonacci projection.
DJ30:
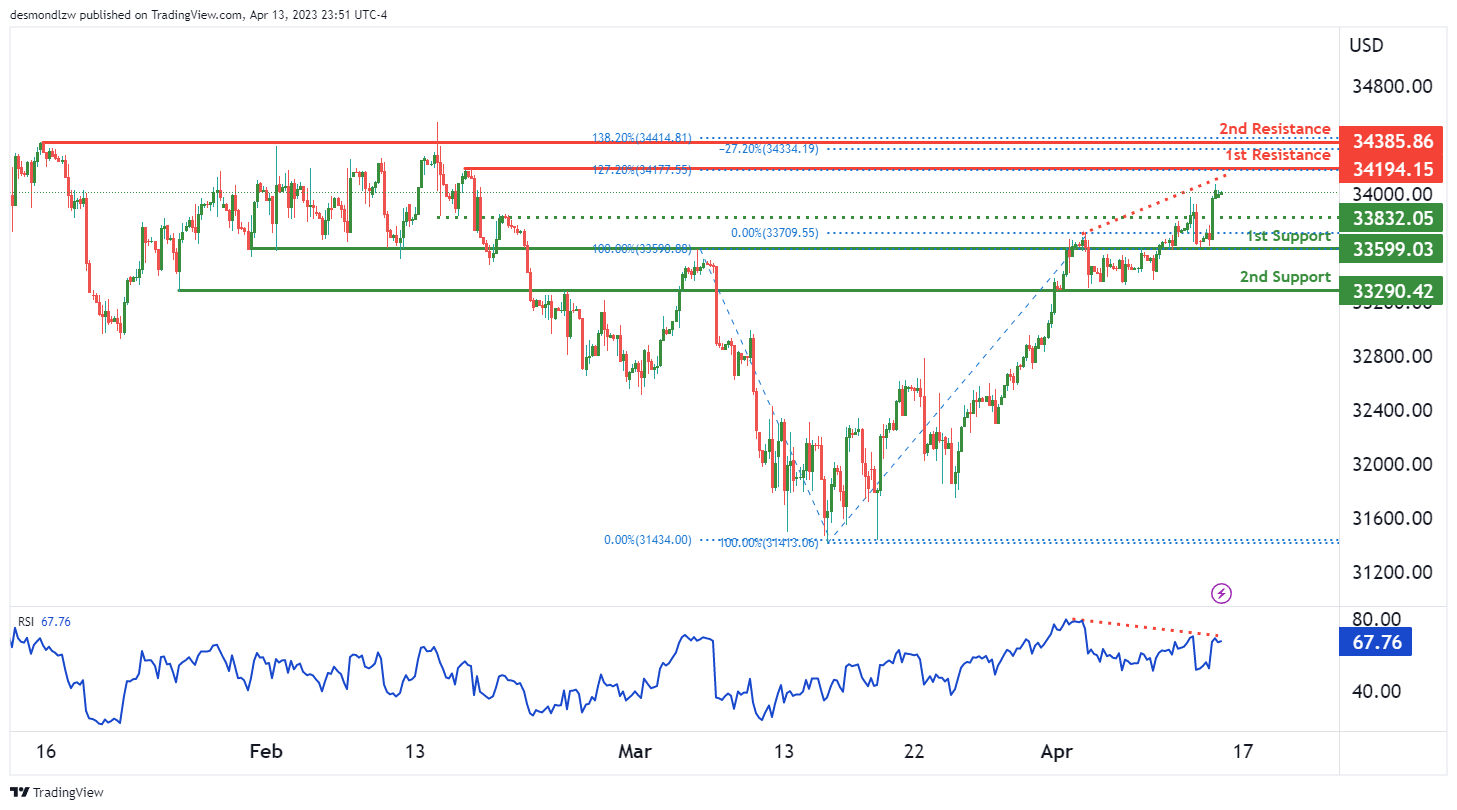
The DJ30 chart is currently displaying bearish momentum with a potential short-term rise towards the 1st resistance before reversing off and dropping towards the 1st support.
The 1st support is located at 33599.03, which is a strong overlap support level. In case price drops below this level, the 2nd support can be found at 33290.42, which is another overlap support level.
On the upside, the 1st resistance level is at 34194.15, which is a significant swing high resistance level. It also lines up with a 127.20% Fibonacci Expansion, making it a strong resistance level. If price manages to break through this level, the 2nd resistance at 34385.86 may come into play. This level is a multi-swing high resistance and coincides with a 138.20% Fibonacci Extension.
However, it’s worth noting that the RSI is showing bearish divergence versus price, indicating that a reversal may occur soon. This suggests that even if price manages to break through the 1st resistance, it may not sustain the bullish momentum and instead reverse towards the downside.
If this reversal occurs, the intermediate support at 33832.05 may provide a pullback support level for price.
GER30:
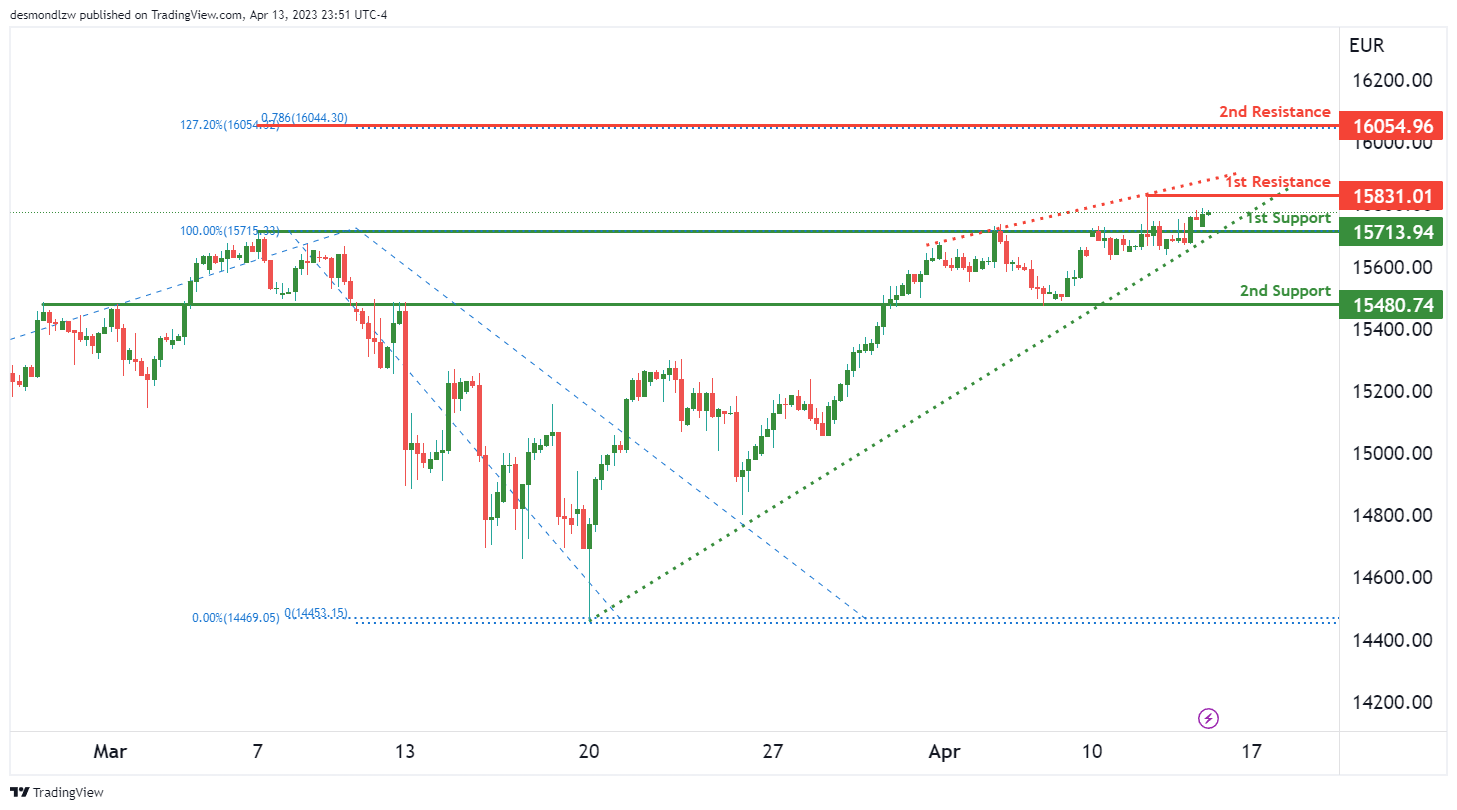
The German DAX 30 (GER30) index has been displaying bearish momentum due to the rising wedge chart pattern. This pattern indicates that an imminent breakout to the downside is likely. With this in mind, price could potentially make a short-term rise towards the 1st resistance before reversing off it and dropping towards the 1st support.
The 1st support is at 15713.94 and is a good level due to it being an overlap support. The 2nd support is at 15480.74 and is also an overlap support. If price were to break the 1st support, it could drop to the 2nd support level.
On the other hand, the 1st resistance is at 15831.01 and is a good level due to it being a swing high resistance. The 2nd resistance is at 16054.96 and is a swing high resistance, coinciding with a 78.60% Fibonacci projection. If price were to rise towards the 1st resistance, it could potentially reverse off it and drop towards the 1st support.
BTC/USD:
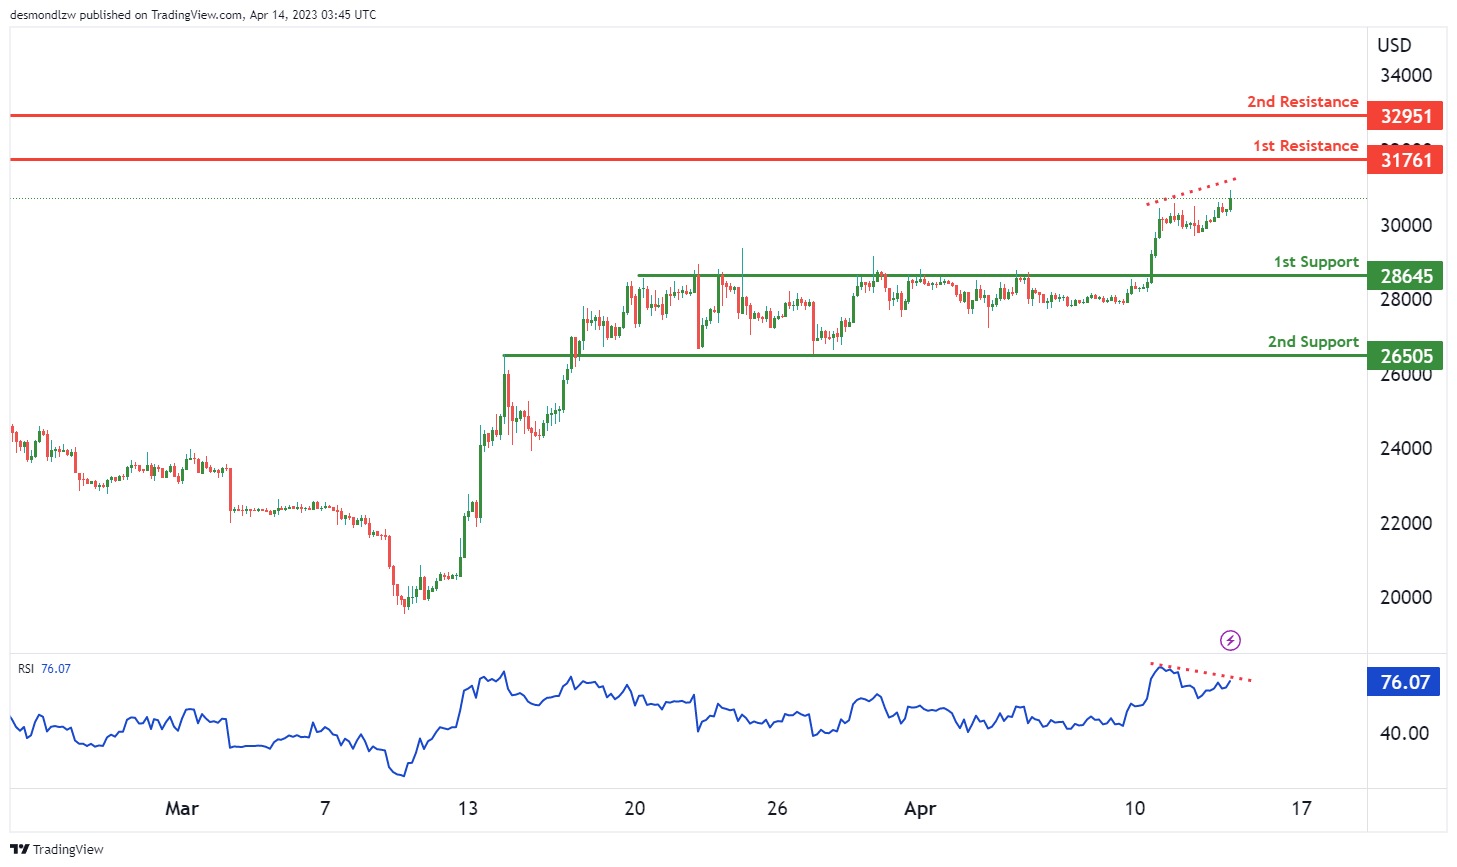
The overall momentum of the Bitcoin/USD chart remains bearish. Price has the potential to rise towards the 1st resistance in the short term before reversing off it and dropping towards the 1st support.
The 1st support level is at 28645 and it is a pullback support level. The 2nd support level is at 26505 and it is an overlap support level.
On the other hand, the 1st resistance level is at 31761 and it is a swing high resistance level. The 2nd resistance level is at 32951 and it is also a swing high resistance level.
RSI is currently displaying bearish divergence versus price, indicating that a reversal might occur soon.
It’s worth noting that a rise towards the 1st resistance level is possible in the short term. However, the overall momentum of the chart remains bearish, and a reversal off the 1st resistance level could lead to a drop towards the 1st support level.
US500
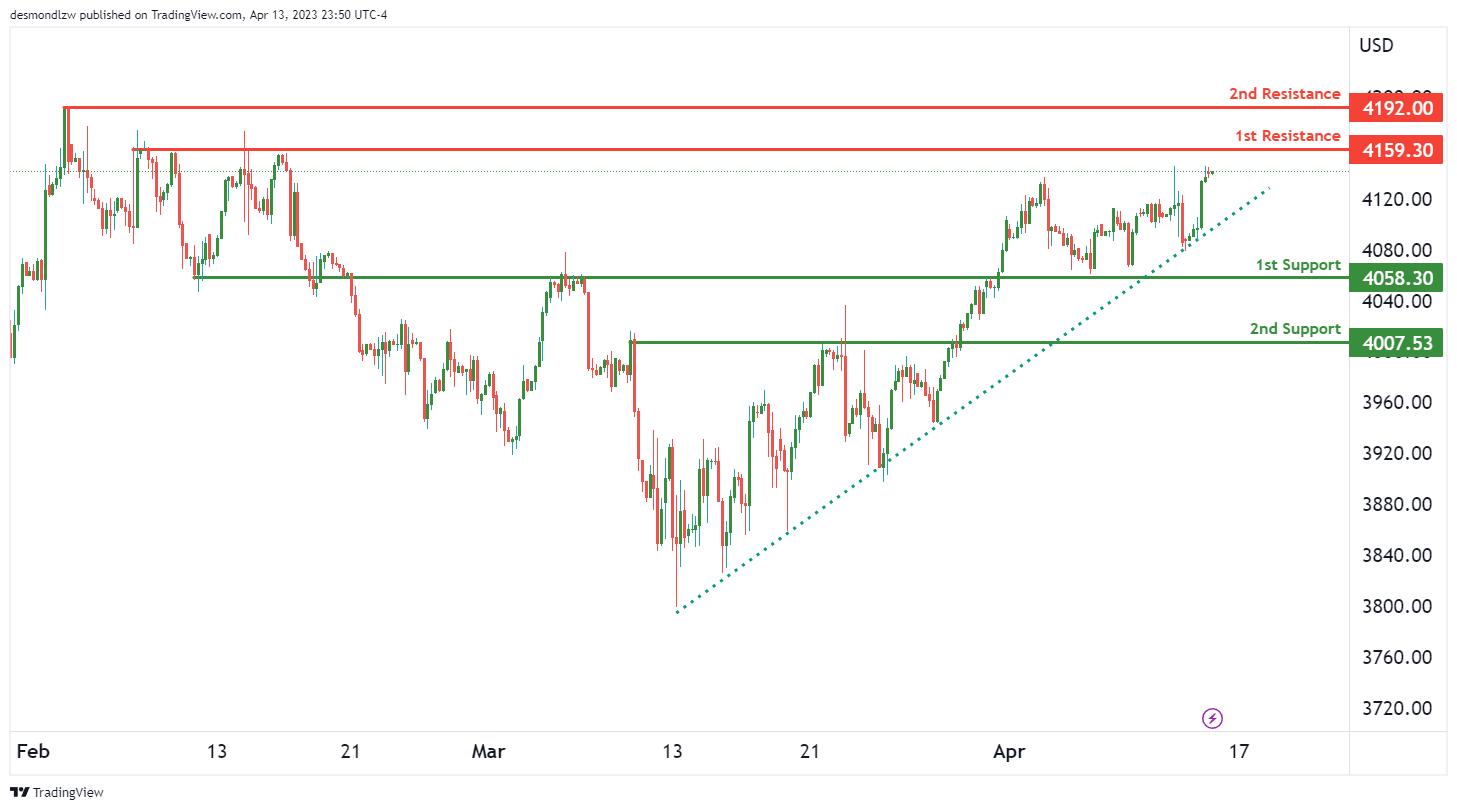
The US500 chart currently shows bullish momentum, with price above a major ascending trend line indicating the potential for further bullish momentum. If this momentum continues, price could potentially rise towards the 1st resistance level.
The 1st support level is at 4058, and it is a strong overlap support level. In the past, price has bounced off this level multiple times, making it a good potential support level in the future. The 2nd support level is at 4008, and it is a pullback support level. This level has also been tested multiple times in the past, adding to its credibility as a potential support level.
On the other hand, the 1st resistance level is at 4159, and it is a multi-swing high resistance level. This level has been tested multiple times in the past, making it a strong level of resistance for price to break through. The 2nd resistance level is at 4192, and it is a swing high resistance level. This level has also been tested in the past, and could potentially provide resistance for price to overcome.
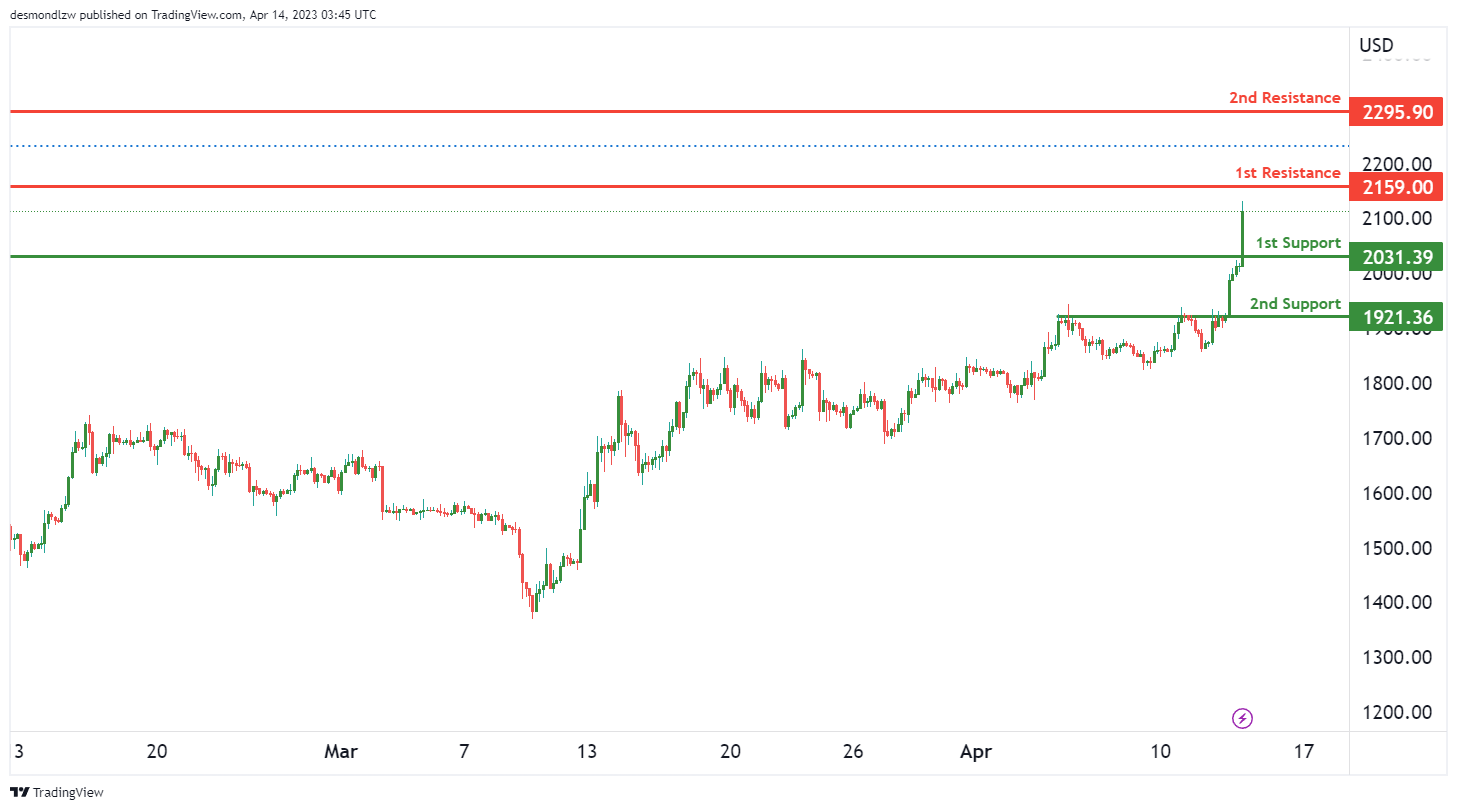
ETH/USD:
The overall momentum of the ETH/USD chart is bullish, with price showing potential for a bullish continuation towards the 1st resistance level. Price is currently above a major ascending trend line, suggesting that further bullish momentum is on the cards.
The 1st support level is at 2031.39, and it is a good level because it is a pullback support. The 2nd support level is at 1921.36, and it is also a pullback support.
The 1st resistance level is at 2159.00, and it is a good level because it is a swing high resistance. The 2nd resistance level is at 2295.90, and it is also a swing high resistance.
If price were to bounce from the 1st support level, it could rise to the 1st resistance level. The intermediate support level at 1983.00 is between the current price and the 1st support level. A break of this intermediate support level could trigger a strong bearish acceleration towards the 2nd support level.
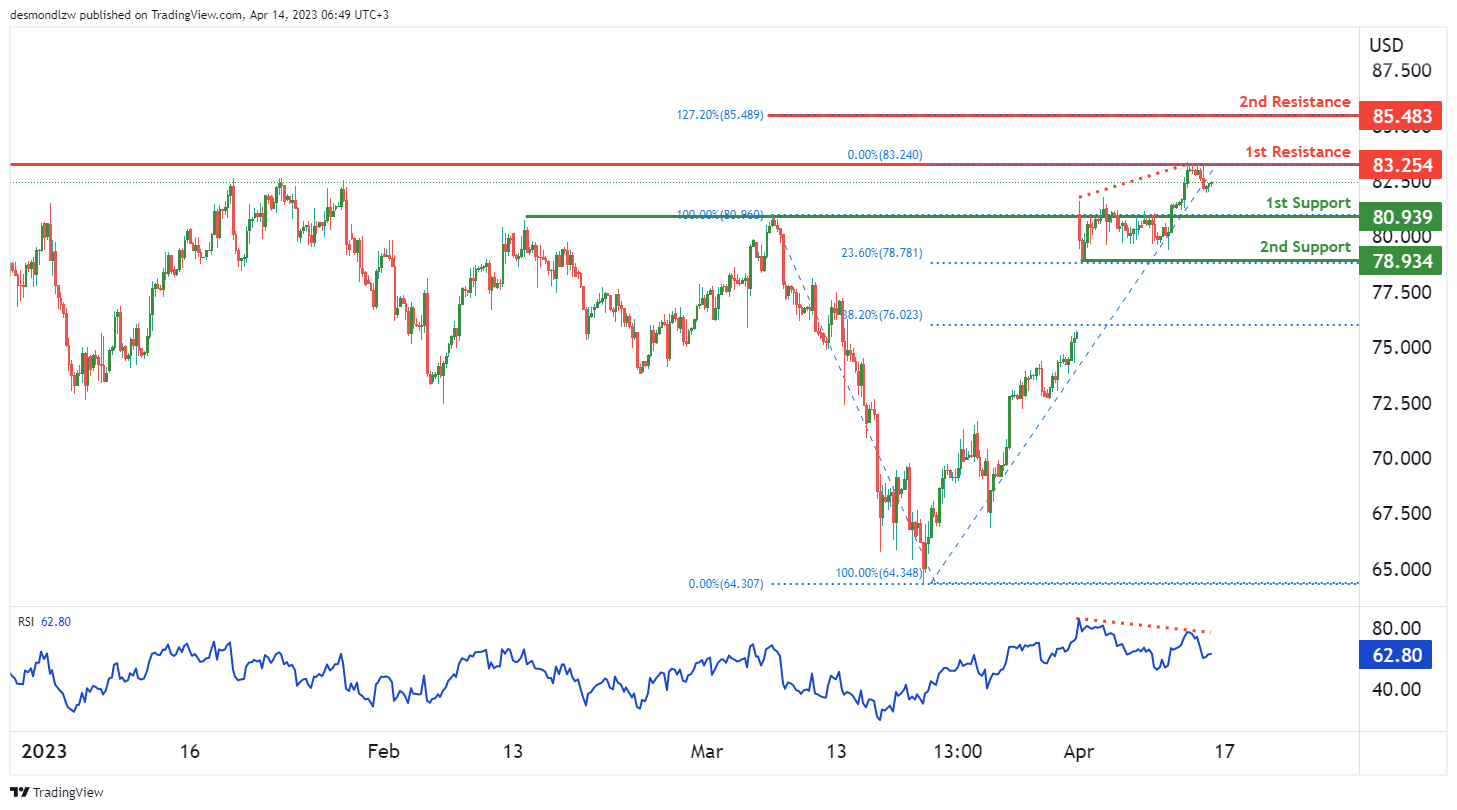
WTI/USD:
WTI oil prices have been showing bearish momentum on the chart, with potential for a continuation towards the 1st support level at $80.93. This level is a strong pullback support, coinciding with the 100% Fibonacci projection. If the price were to break below this level, the next support level is at $78.93, which is a swing low support.
On the resistance side, the first level to watch is at $83.25, which is a swing high resistance. If price manages to break above this level, the next resistance is at $85.48, which coincides with a swing high resistance as well as the 127.20% Fibonacci extension.
It is worth noting that the RSI indicator is showing bearish divergence versus the price, which suggests that a potential reversal might occur soon. This could result in a drop in prices towards the support levels.
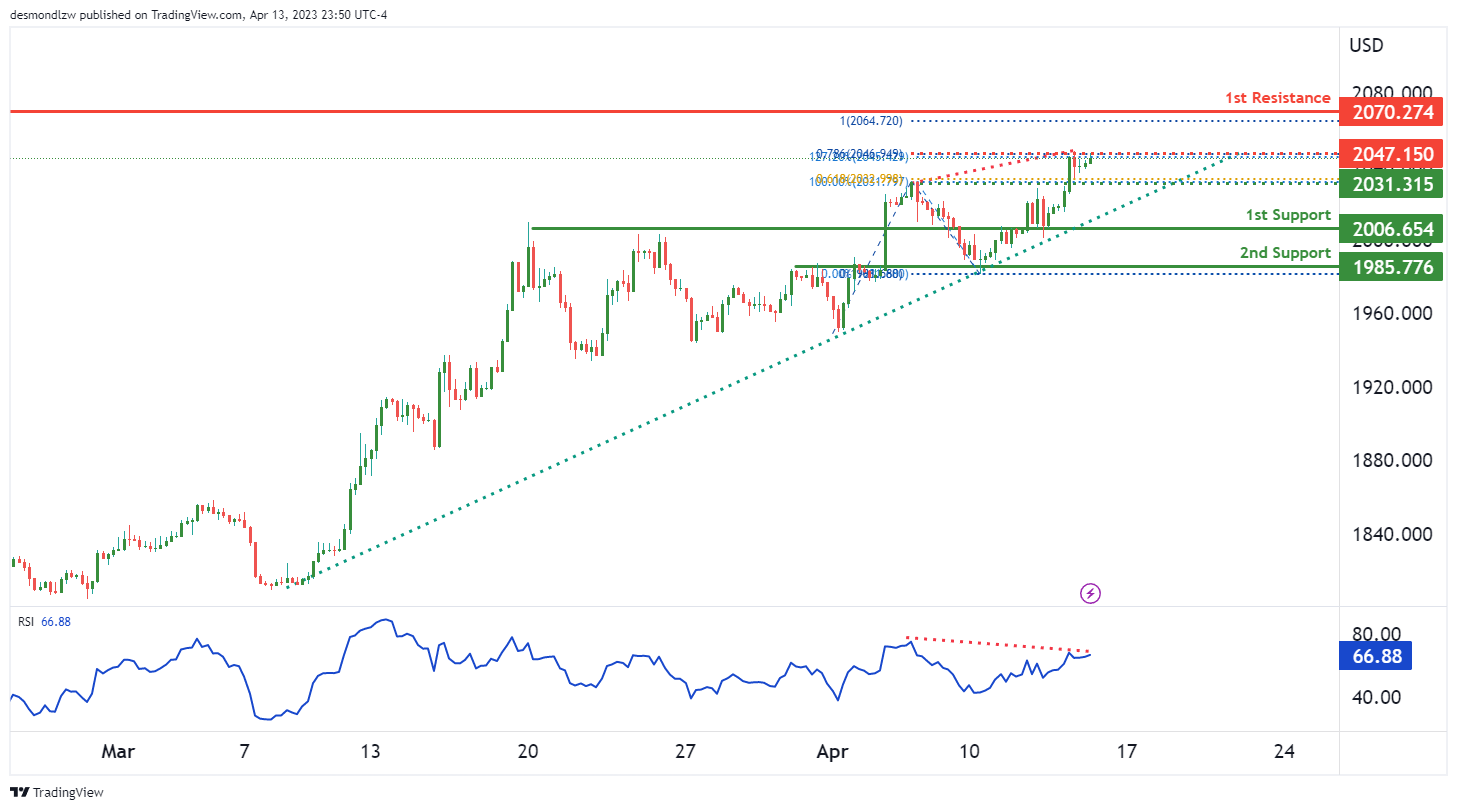
XAU/USD (GOLD):
XAU/USD chart shows bearish momentum, but an ascending trend line gives hope for bullish potential. Prices could potentially drop to the first support level at 2023.03 if there is a bearish reaction off the first resistance level of 2070.27.
The first support level at 2023.03 is a good level to watch as it lines up with a 61.80% Fibonacci projection and a pullback support. A break below this level could push prices to the next support level of 2006.65, which is an overlap support.
On the other hand, if prices break above the first resistance level of 2070.27, it could indicate further bullish momentum towards the intermediate resistance level of 2047.15. This level is a multi-swing high resistance and coincides with a 78.60% Fibonacci projection.
It’s worth noting that the RSI is displaying bearish divergence versus price, suggesting that a reversal might occur soon. This further supports the possibility of prices dropping to the first support level.
The accuracy, completeness and timeliness of the information contained on this site cannot be guaranteed. IC Markets does not warranty, guarantee or make any representations, or assume any liability regarding financial results based on the use of the information in the site.
News, views, opinions, recommendations and other information obtained from sources outside of www.icmarkets.com, used in this site are believed to be reliable, but we cannot guarantee their accuracy or completeness. All such information is subject to change at any time without notice. IC Markets assumes no responsibility for the content of any linked site.
The fact that such links may exist does not indicate approval or endorsement of any material contained on any linked site. IC Markets is not liable for any harm caused by the transmission, through accessing the services or information on this site, of a computer virus, or other computer code or programming device that might be used to access, delete, damage, disable, disrupt or otherwise impede in any manner, the operation of the site or of any user’s software, hardware, data or property.


