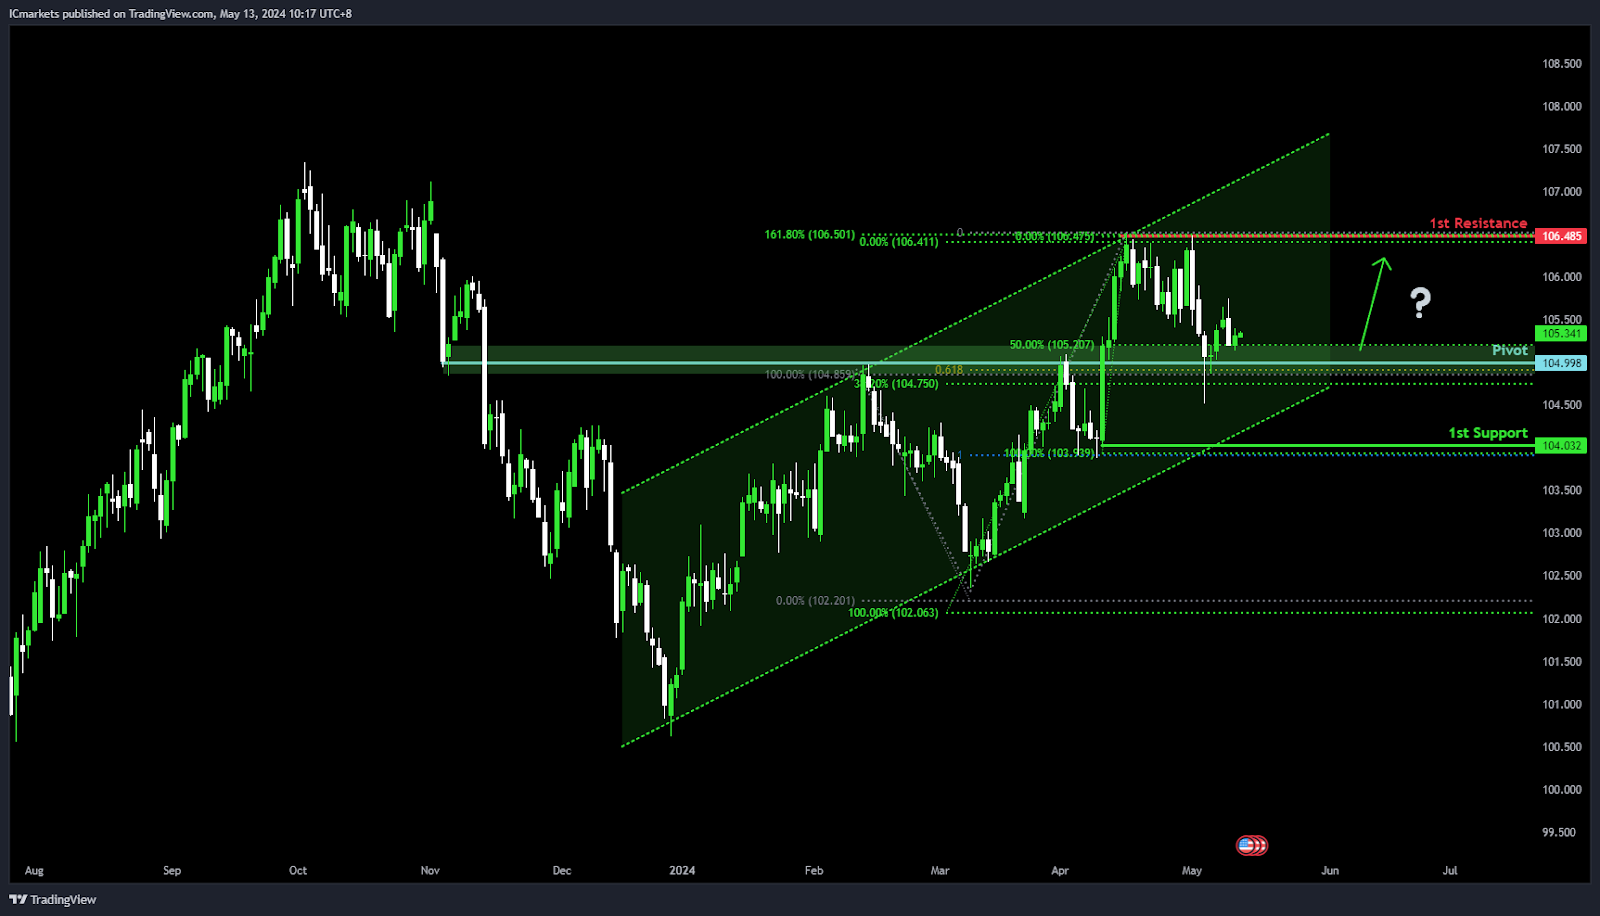
DXY (US Dollar Index):
Potential Direction: Bullish
Overall momentum of the chart: Bullish
Factors contributing to the momentum are that the price is in a bullish ascending channel.
Price could potentially make a bullish bounce off pivot and head towards 1st resistance.
Pivot: 104.99
Supporting reasons: An Overlap support, coinciding with the 61.80% Fibonacci Projection.
1st support: 104.03
Supporting reasons: Swing low support, indicating a level where buyers might step in to support the price.
1st resistance: 106.48
Supporting reasons: Multi-swing high resistance, suggesting a significant level where selling pressure might intensify, also coinciding with the 161.80% Fibonacci Extension.
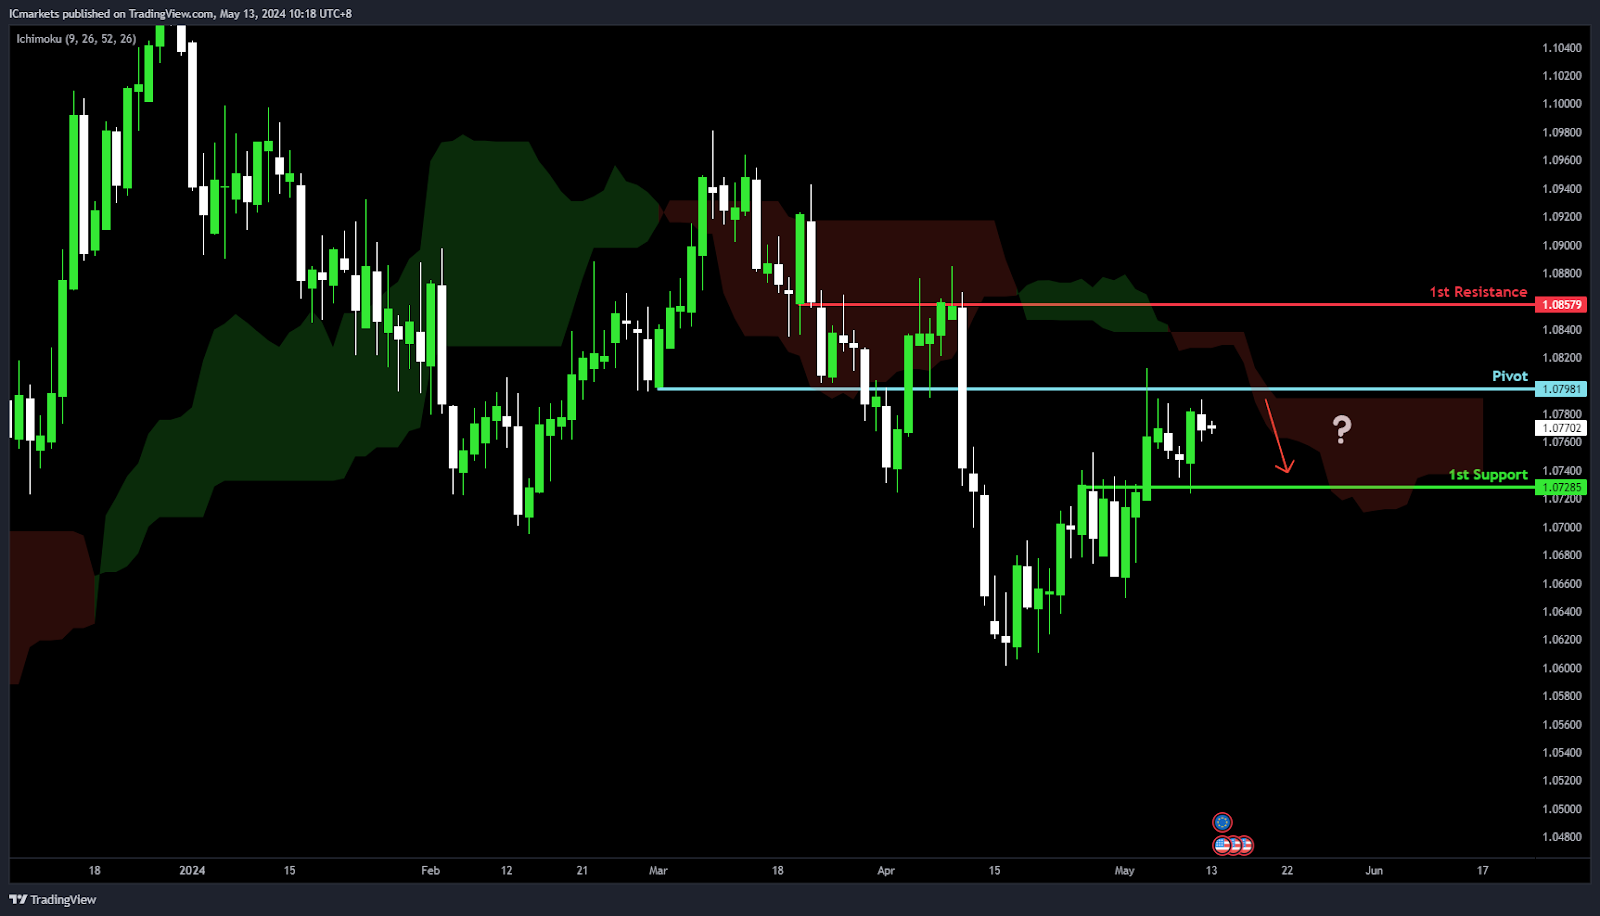
EUR/USD:
Potential Direction: Bearish
Overall momentum of the chart: Bearish
Factors contributing to the momentum are that the price is below the bearish Ichimoku cloud.
Price could potentially make a bearish reaction off pivot and drop to 1st support.
Pivot: 1.0798
Supporting reasons: An Overlap resistance, indicating a significant level where selling pressure might intensify.
1st support: 1.0728
Supporting reasons: An Overlap support, suggesting a level where buyers might step in to support the price.
1st resistance: 1.0857
Supporting reasons: An Overlap resistance, coinciding with the 61.80% Fibonacci Retracement level, which could act as a barrier to further upside movement.
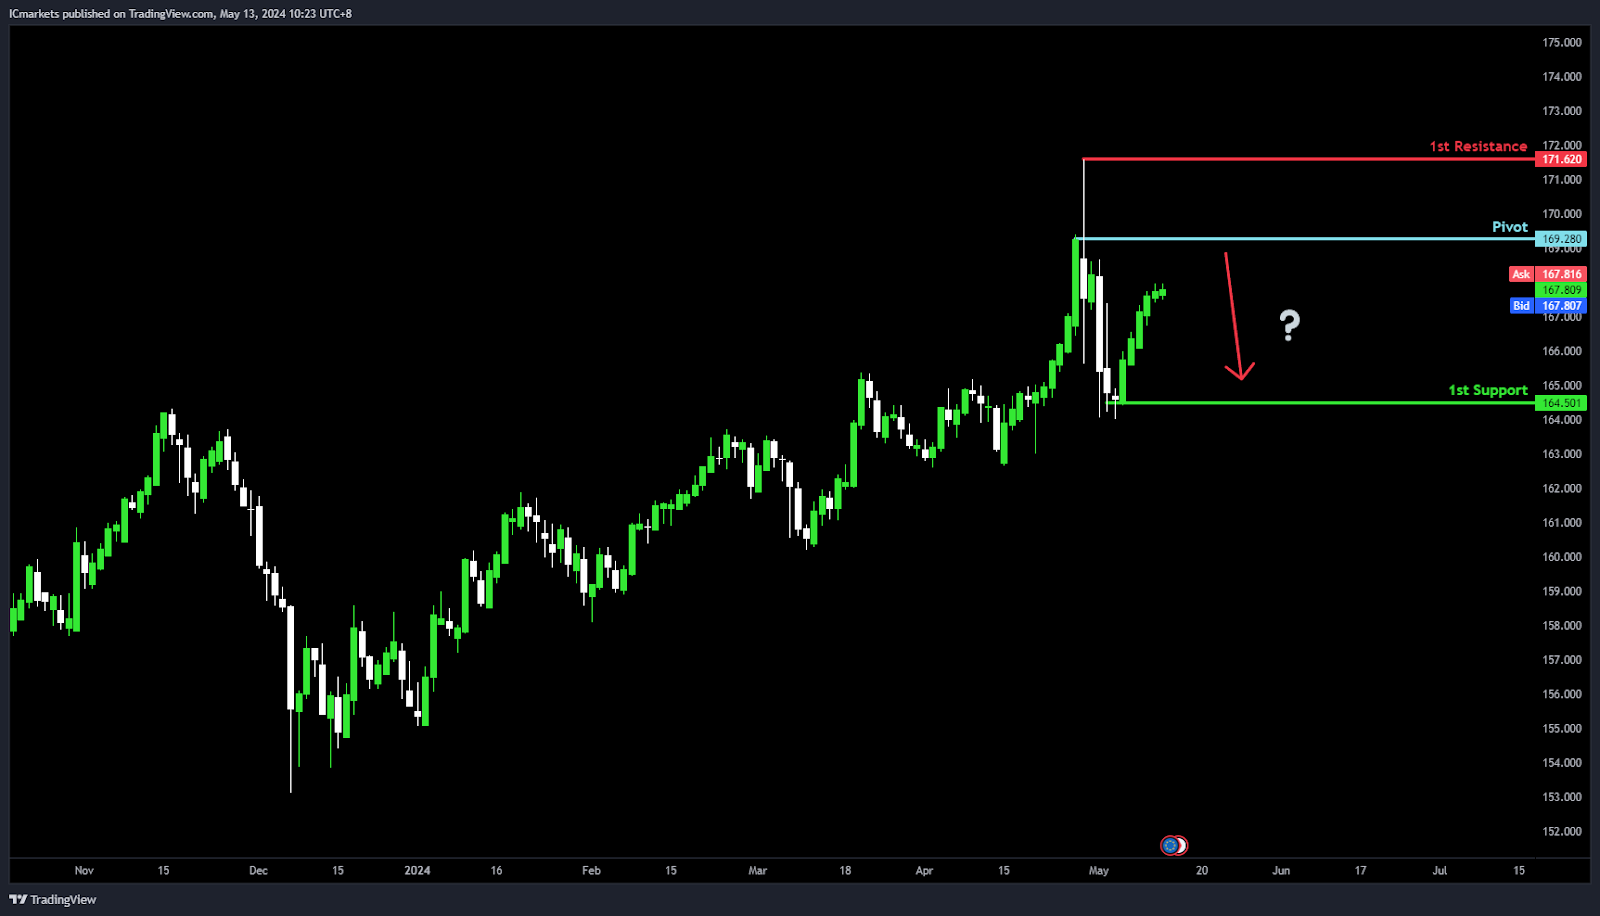
EUR/JPY:
Potential Direction: Bearish
Overall momentum of the chart: Bullish
Price could potentially make a bearish reaction off pivot and drop to 1st support.
Pivot: 169.28
Supporting reasons: An Overlap resistance, indicating a significant level where selling pressure might intensify.
1st support: 164.50
Supporting reasons: Swing low support, suggesting a level where buyers might step in to support the price.
1st resistance: 171.62
Supporting reasons: Swing high resistance, representing a level where selling pressure might increase, potentially acting as a barrier to further upside movement.
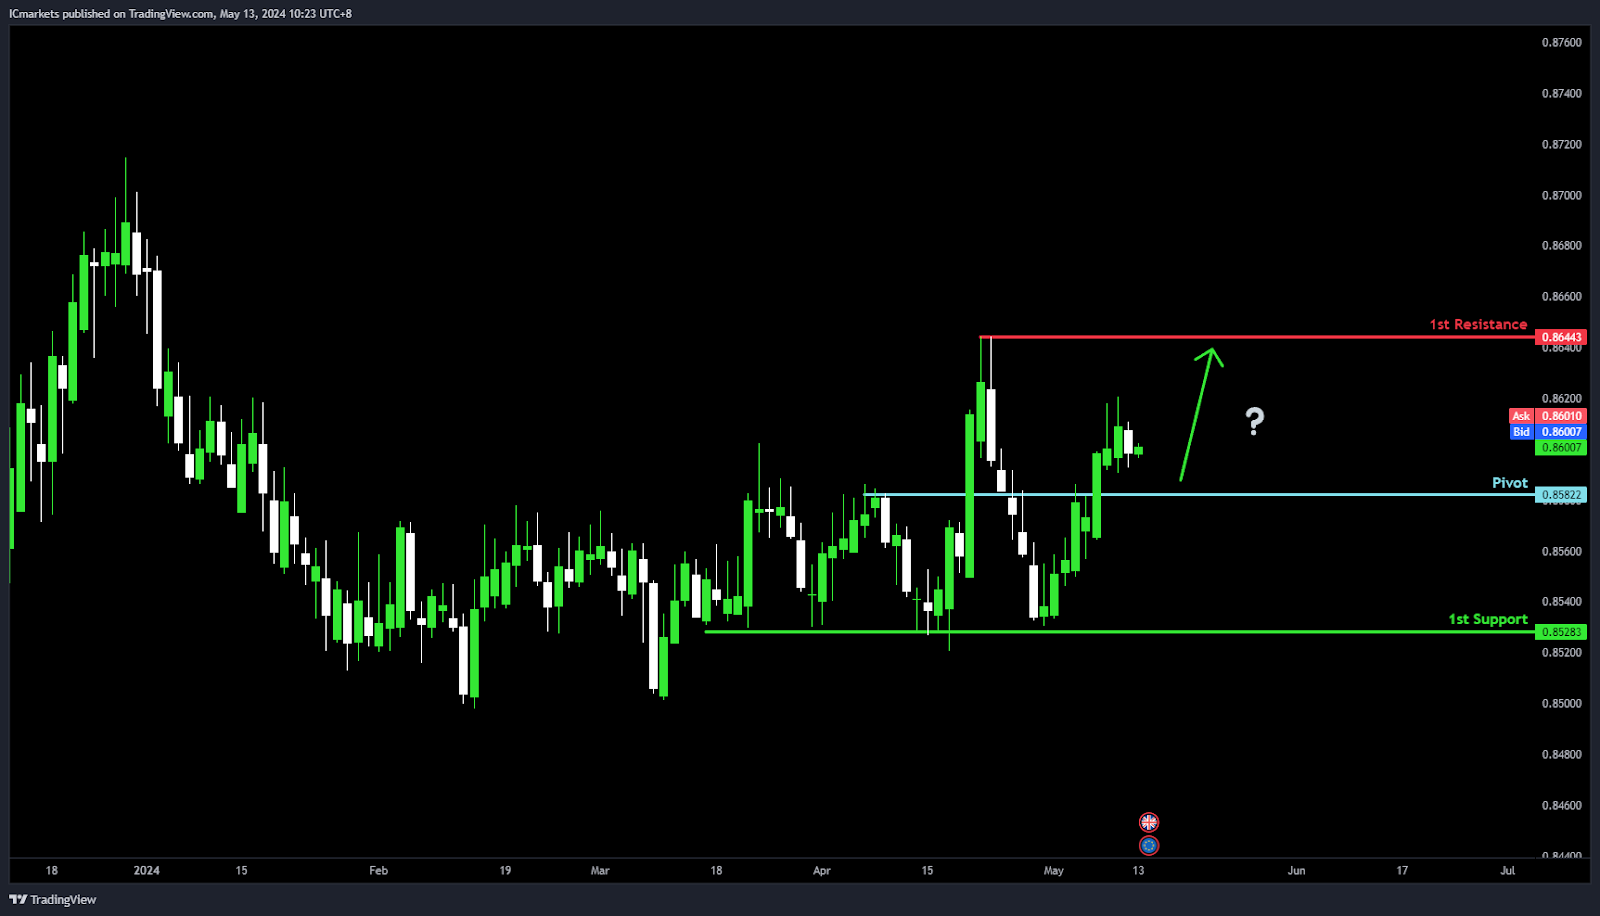
EUR/GBP:
Potential Direction: Bullish
Overall momentum of the chart: Bullish
Price could potentially make a bullish bounce off pivot and head towards 1st resistance.
Pivot: 0.8582
Supporting reasons: Pullback support, suggesting a level where buyers might enter the market.
1st support: 0.8528
Supporting reasons: Multi-swing low support, indicating a level where buying interest has previously been strong.
1st resistance: 0.8644
Supporting reasons: Swing high resistance, representing a level where selling pressure might increase, potentially acting as a barrier to further upside movement.
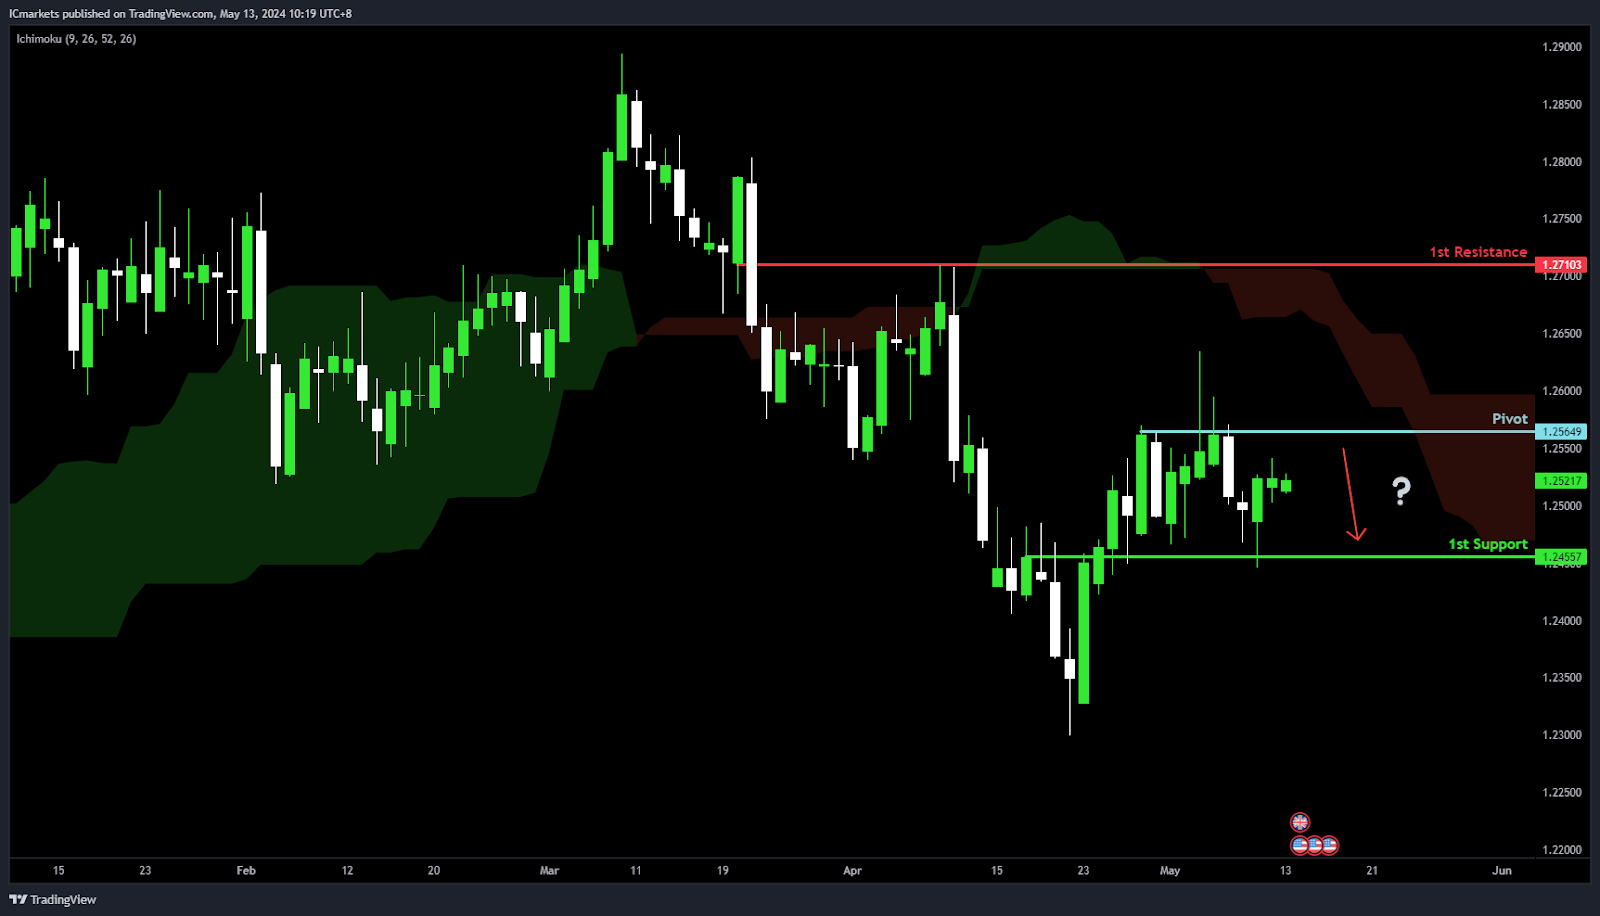
GBP/USD:
Potential Direction: Bearish
Overall momentum of the chart: Bearish
Factors contributing to the momentum: Price is below the bearish Ichimoku cloud.
Price could potentially make a bearish reaction off pivot and drop to 1st support.
Pivot: 1.2564
Supporting reasons: Multi-swing high resistance, indicating a significant level where selling pressure might intensify.
1st support: 1.2455
Supporting reasons: An Overlap support, suggesting a level where buying interest could emerge.
1st resistance: 1.2710
Supporting reasons: An Overlap resistance, representing a level where selling pressure might increase, potentially acting as a barrier to further upside movement.
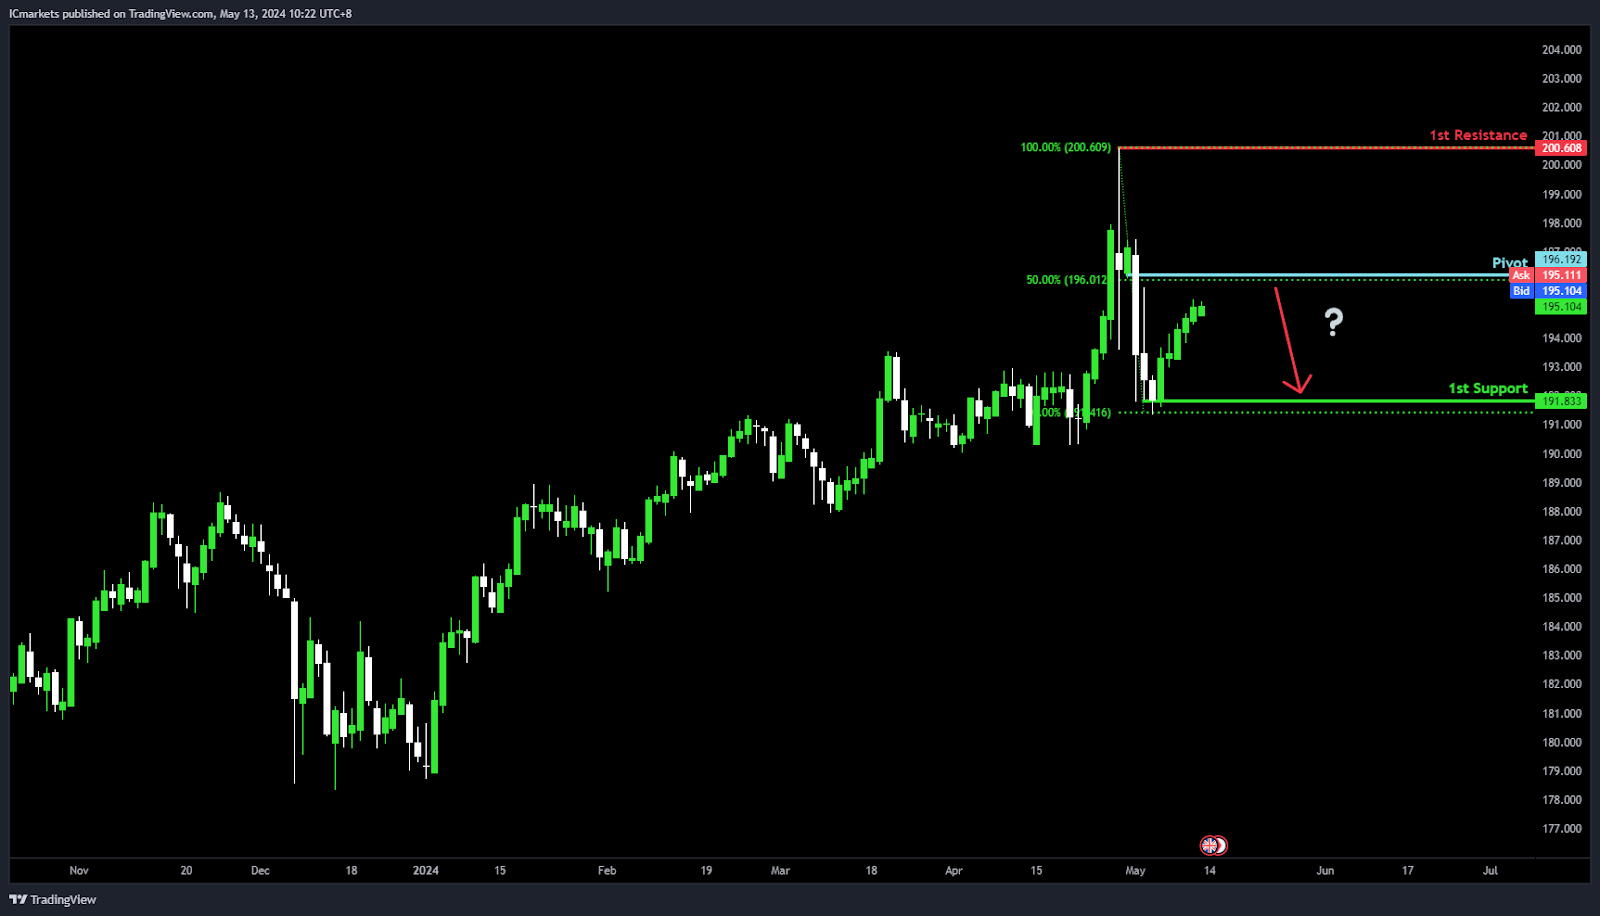
GBP/JPY:
Potential Direction: Bearish
Overall momentum of the chart: Bullish
Price could potentially make a bearish reaction off pivot and drop to 1st support.
Pivot: 196.19
Supporting reasons: Pullback resistance, coinciding with the 50% Fibonacci Retracement level, indicating a potential area of selling pressure.
1st support: 191.83
Supporting reasons: Swing low support, suggesting a level where buyers might step in to support the price.
1st resistance: 200.60
Supporting reasons: Swing high resistance, representing a level where selling pressure might increase, potentially acting as a barrier to further upside movement.
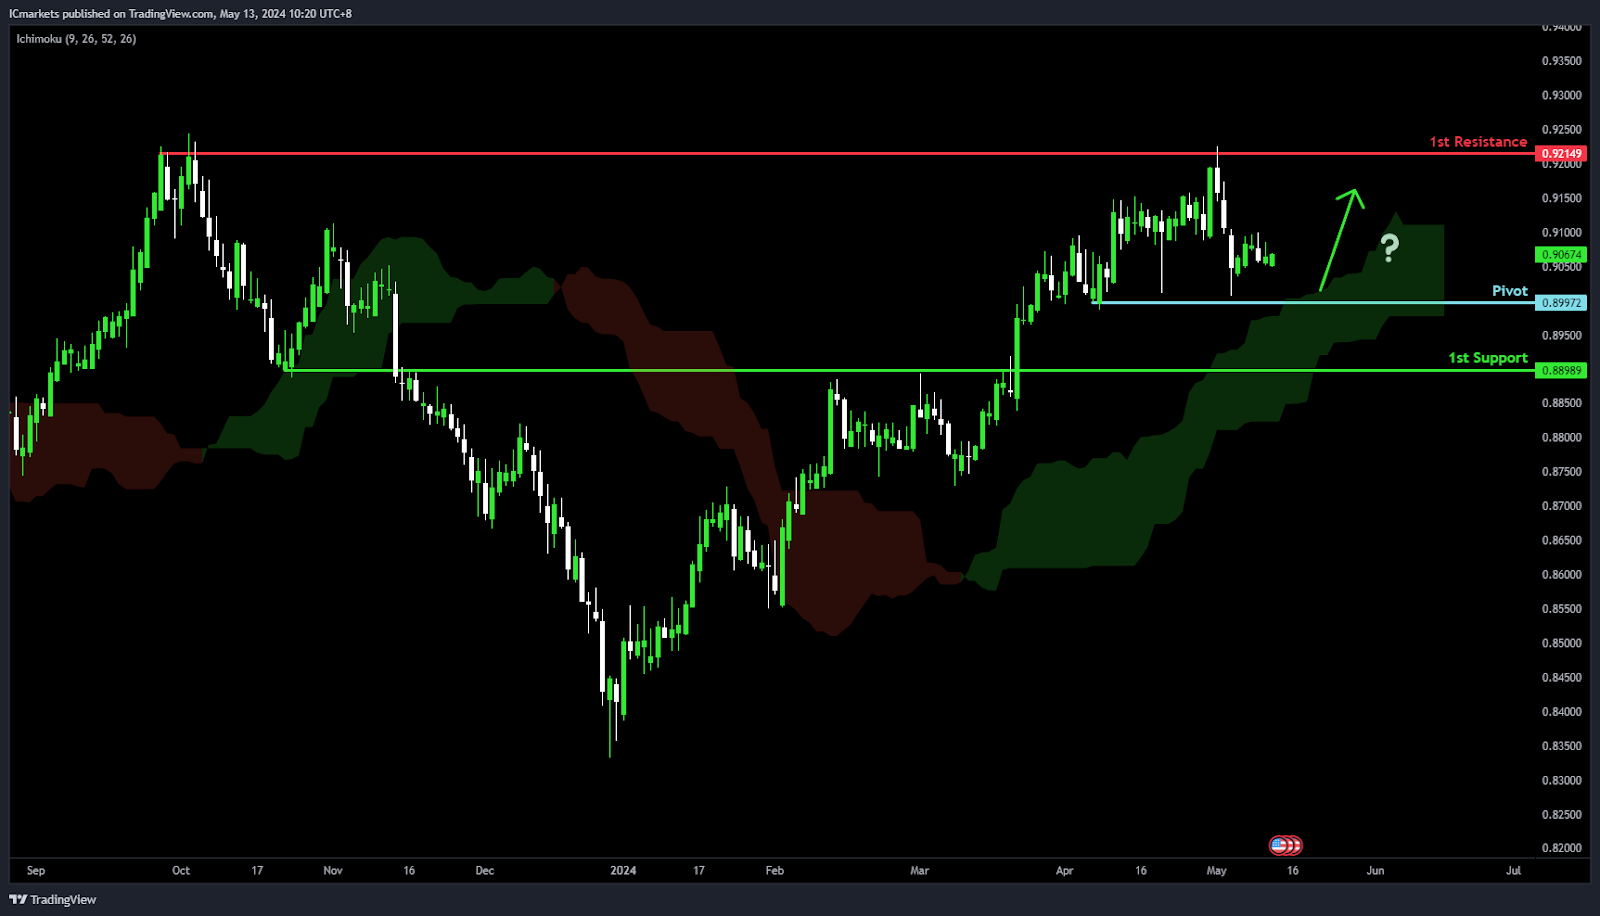
USD/CHF:
Potential Direction: Bullish
Overall momentum of the chart: Bullish
Factors contributing to the momentum is that price is: Above the bullish Ichimoku cloud
Price could potentially make a bullish bounce off pivot and head towards 1st resistance.
Pivot: 0.8997
Supporting reasons: Multi-swing low support, indicating a level where buyers might be interested in entering the market.
1st support: 0.8898
Supporting reasons: Pullback support, suggesting a level where buyers could potentially step in to support the price.
1st resistance: 0.9214
Supporting reasons: Multi-swing high resistance, representing a level where selling pressure might increase, potentially acting as a barrier to further upside movement.
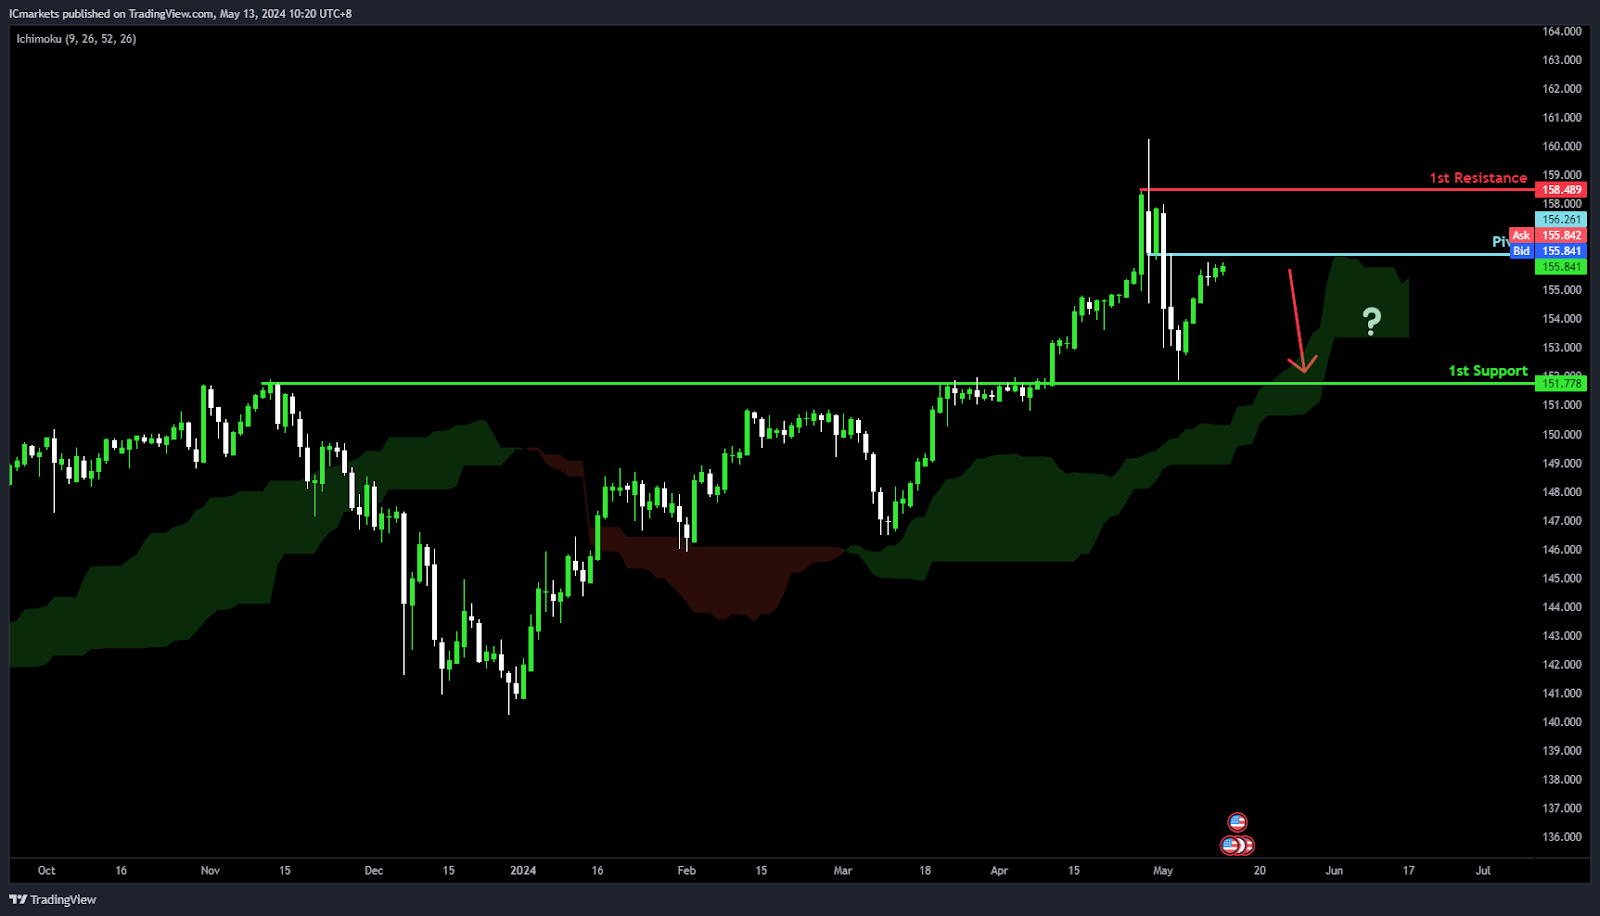
USD/JPY:
Potential Direction: Bearish
Overall momentum of the chart: Bullish
Factors contributing to the momentum is that price is: Within the bullish Ichimoku cloud
Price could potentially make a bearish reaction off pivot and drop to 1st support.
Pivot: 156.26
Supporting reasons: Pullback resistance, indicating a level where selling pressure might intensify.
1st support: 151.77
Supporting reasons: An Overlap support, suggesting a level where buyers might step in to support the price.
1st resistance: 158.48
Supporting reasons: Swing high resistance, representing a level where selling pressure might increase, potentially acting as a barrier to further upside movement.
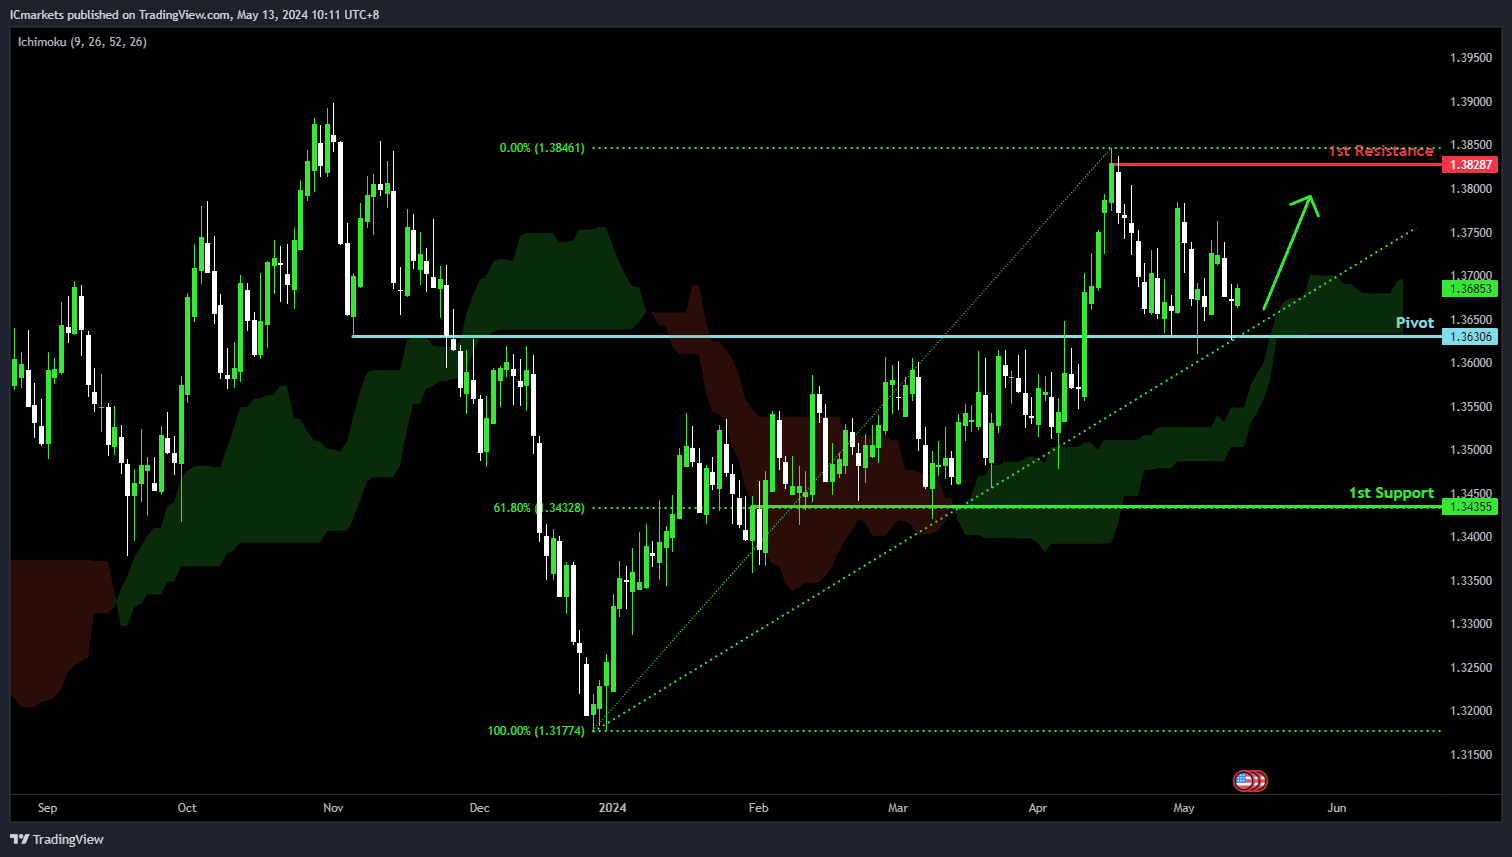
USD/CAD:
Potential Direction: Bullish
Overall momentum of the chart: Bullish
Price has made a bullish reaction off the pivot and could potentially rise towards the 1st resistance.
Pivot: 1.3630
Supporting reasons: Acts as an overlap support, suggesting a significant area where buying interests have increased recently.
1st support: 1.3435
Supporting reasons: Identified as a pullback support that aligns with a 61.8% Fibonacci retracement level, suggesting an area where price could find strong buying interests to potentially halt any further downward movement.
1st resistance: 1.3828
Supporting reasons: Identified as a pullback resistance, marking a significant barrier that could cap further upward movements.
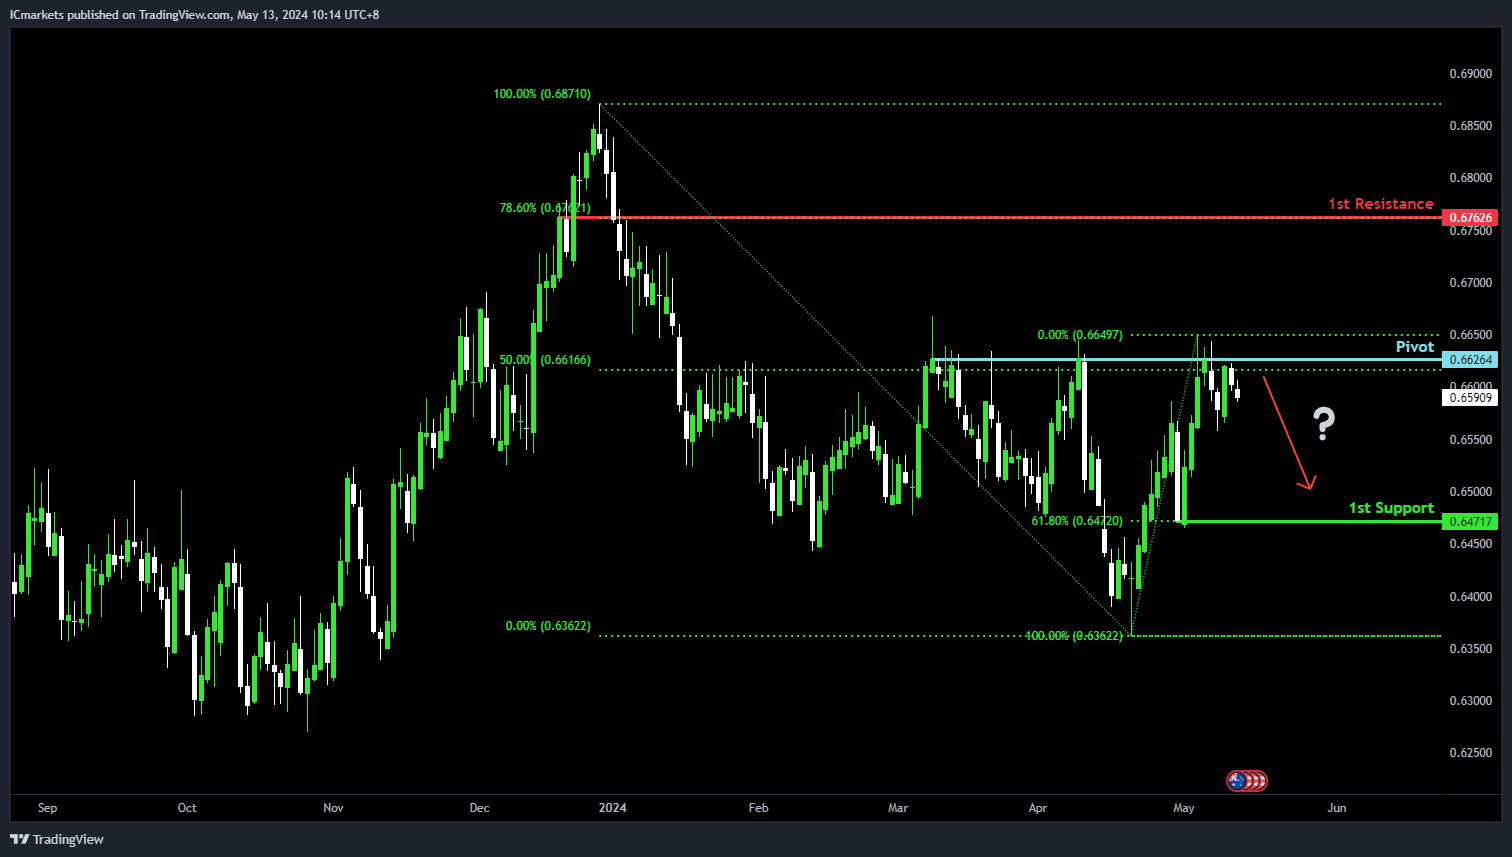
AUD/USD:
Potential Direction: Bearish
Overall momentum of the chart: Neutral
Price could rise towards the pivot and potentially make a bearish reaction off this level to drop towards the 1st support.
Pivot: 0.6626
Supporting reasons: Acts as a pullback resistance that aligns with a 50% Fibonacci retracement level, suggesting an area where selling pressures have intensified recently.
1st support: 0.6471
Supporting reasons: Acts as a pullback support that aligns with a 61.8% Fibonacci retracement level, suggesting a significant area where price has found strong support in the past to provide a basis to halt further downward movement.
1st resistance: 0.6762
Supporting reasons: Identified as a pullback resistance that aligns with a 78.6% Fibonacci retracement level, marking a barrier that has previously capped upward movements.
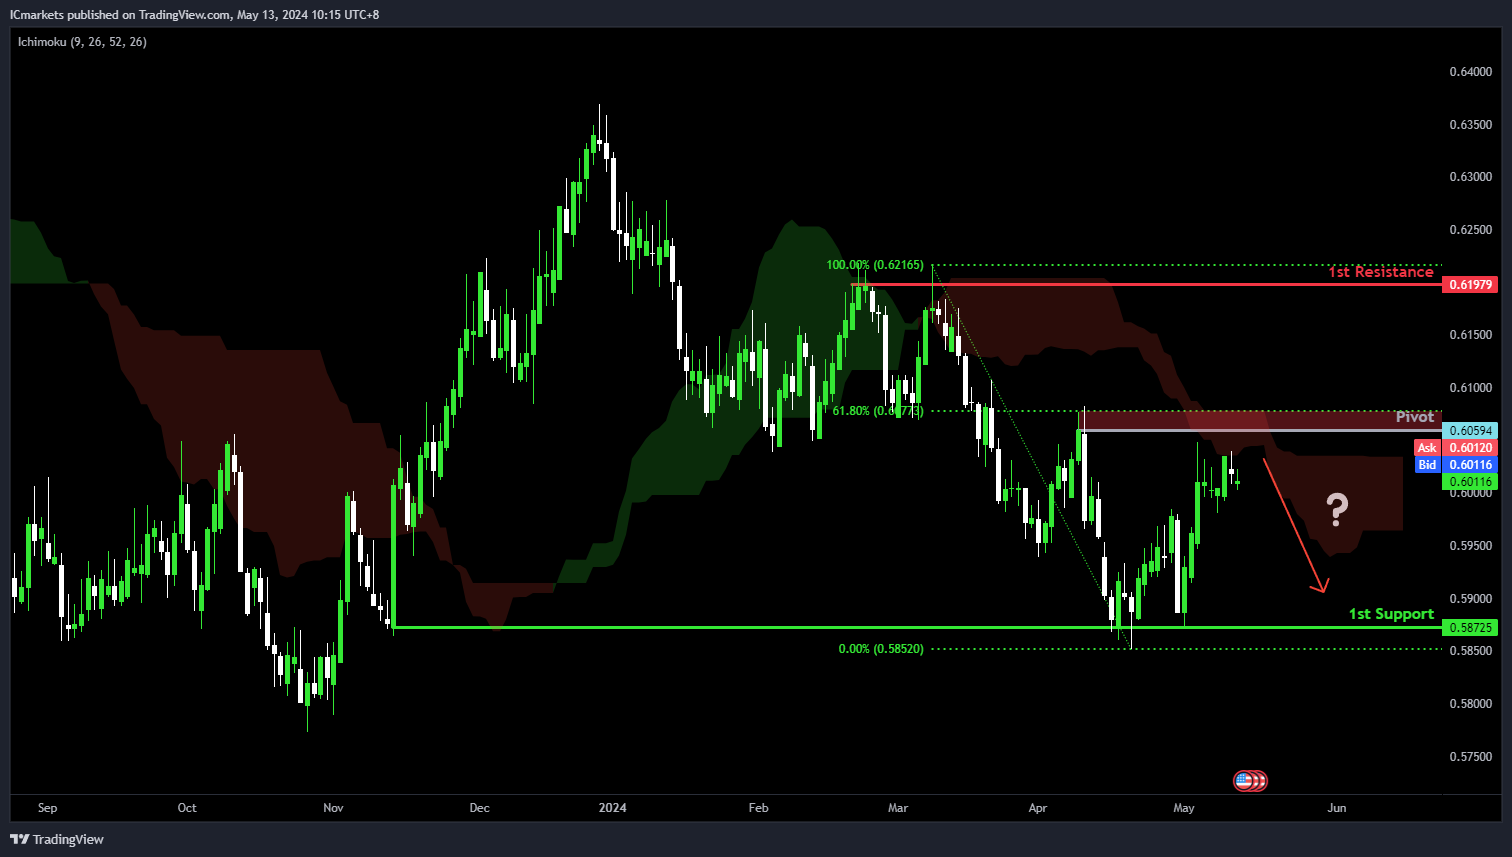
NZD/USD
Potential Direction: Bearish
Overall momentum of the chart: Neutral
Price could rise towards the pivot and potentially make a bearish reaction off this level to drop towards the 1st support.
Pivot: 0.6059
Supporting reasons: Acts as a pullback resistance that align close to a 61.8% Fibonacci retracement level, suggesting an area where selling pressures have intensified recently.
1st support: 0.5872
Supporting reasons: Acts as a pullback support, suggesting a potential area where price has found strong support in the past to provide a basis to halt further downward movement.
1st resistance: 0.6197
Supporting reasons: Identified as a pullback resistance, marking a barrier that has previously capped upward movements.
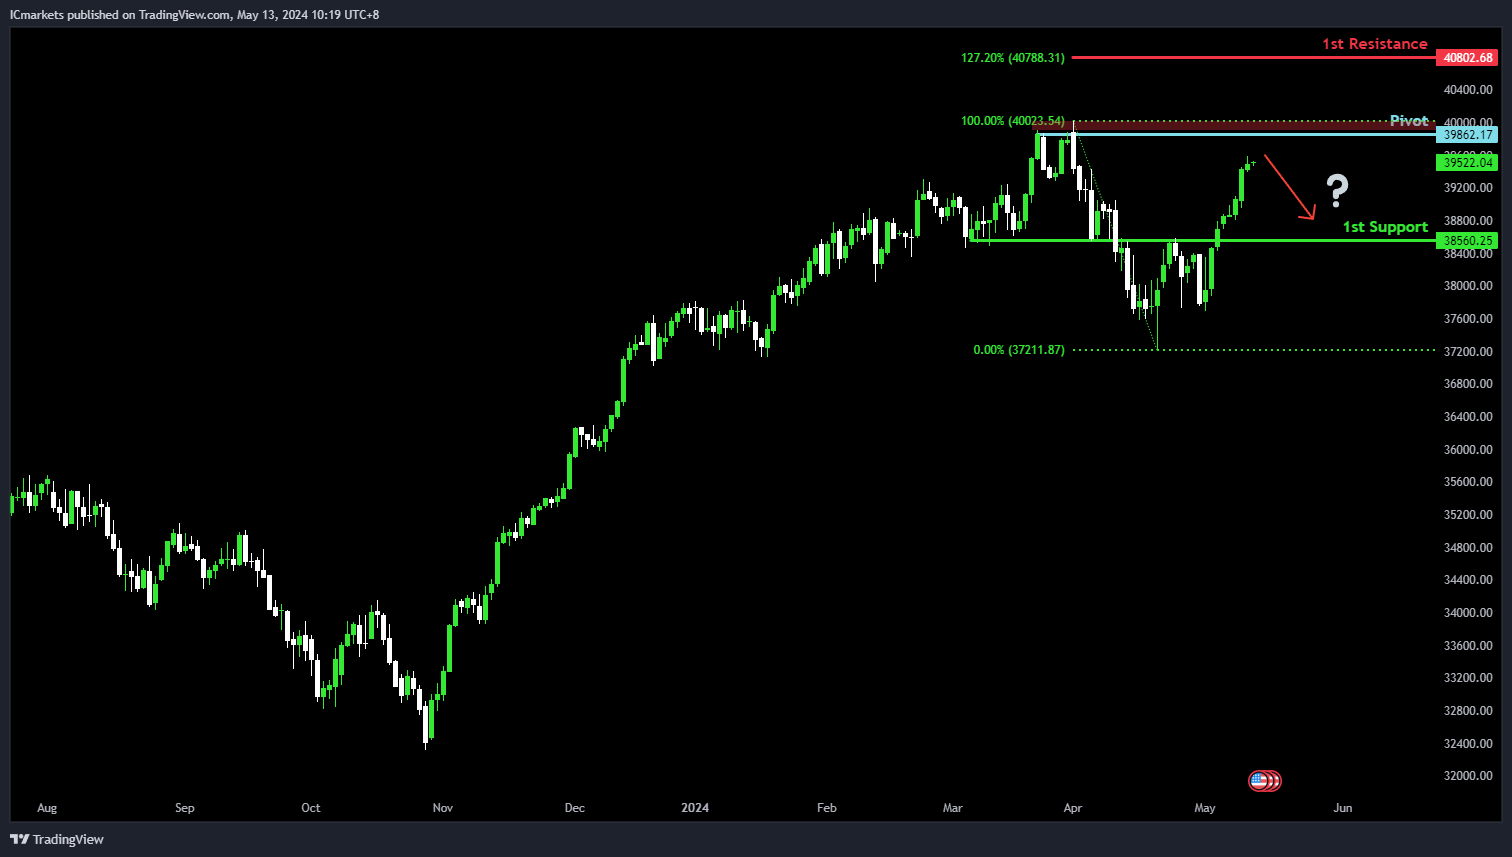
US30 (DJIA):
Potential Direction: Bearish
Overall momentum of the chart: Bullish
Price is rising towards the pivot and could potentially make a bearish reaction off this level to drop towards the 1st support.
Pivot: 39,862.17
Supporting reasons: Identified as a ppullback resistance that aligns close to the all-time high.
1st support: 38,560.25
Supporting reasons: Identified as an overlap support, suggesting a significant area where price could find strong buying interest to could provide a solid foundation to halt further downward movement.
1st resistance: 40,802.68
Supporting reasons: Identified as a resistance that aligns with a 127.2% Fibonacci extension level, indicating a potential barrier that could cap any upward movements.
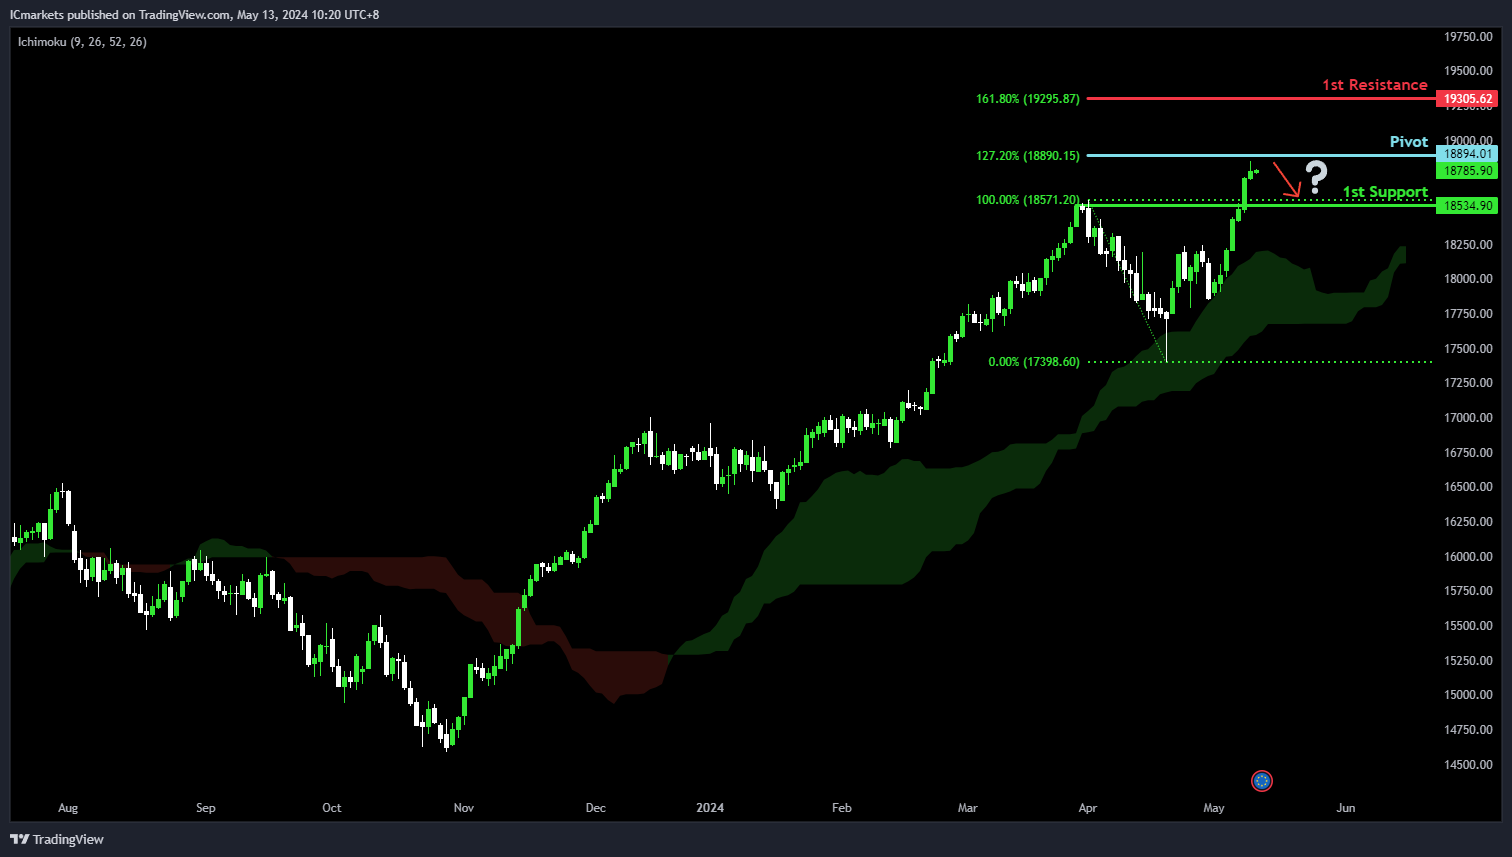
DE40 (DAX):
Potential Direction: Bearish
Overall momentum of the chart: Bullish
Price is rising towards the pivot and could potentially make a bearish reaction off this level to drop towards the 1st support.
Pivot: 18,894.01
Supporting reasons: Identified as a resistance that aligns with a 127.2% Fibonacci extension level.
1st support: 18,534.90
Supporting reasons: Acts as a pullback support, suggesting an area where buying interests could pick up to halt further downward movement.
1st resistance: 19,305.62
Supporting reasons: Identified as a resistance that aligns with a 161.8% Fibonacci extension level, potentially functioning as a barrier that could cap any upward movements.
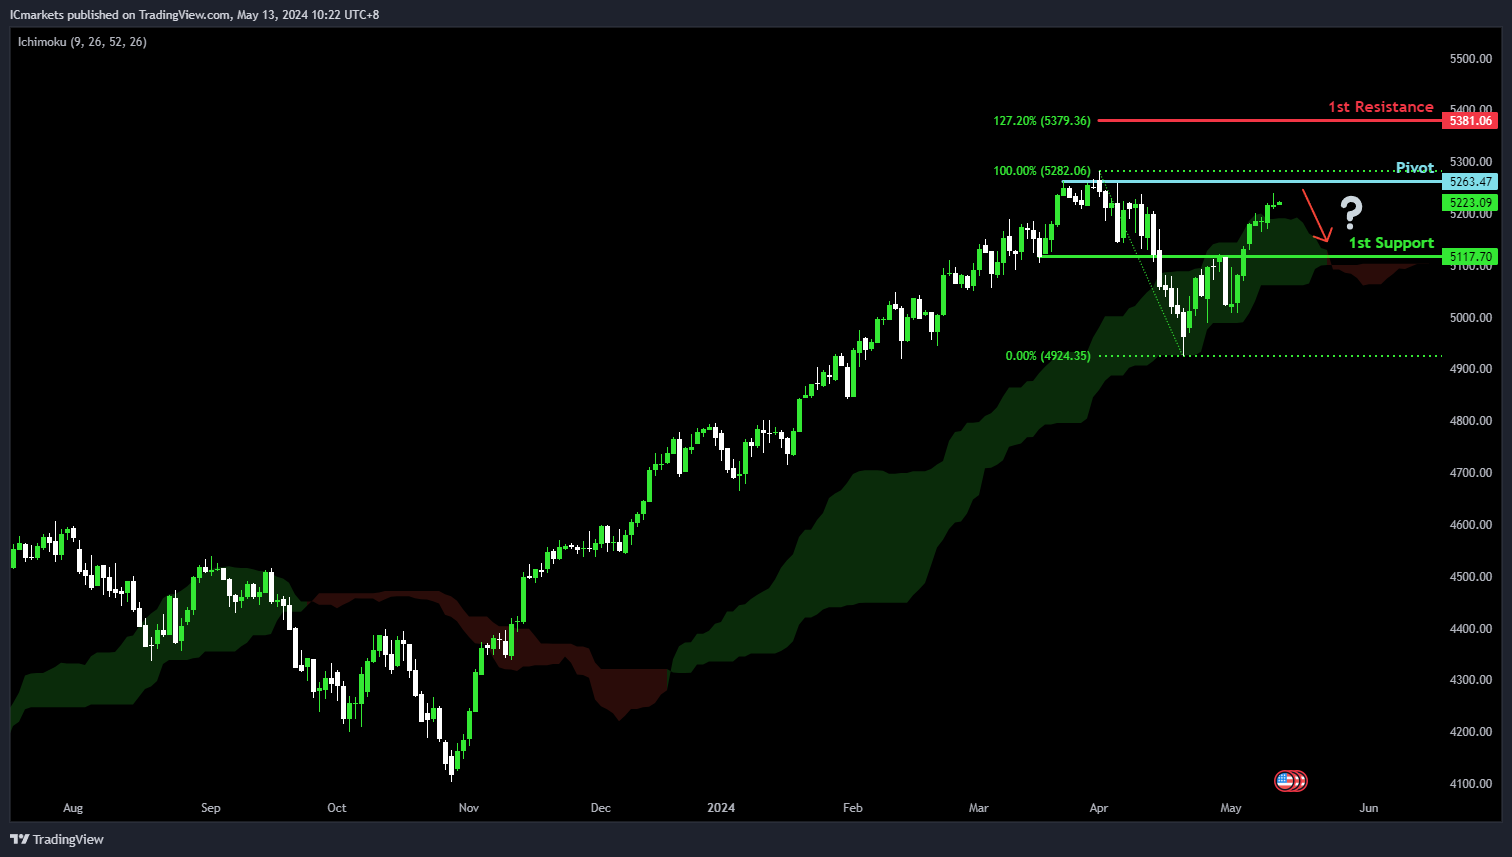
US500 (S&P 500):
Potential Direction: Bearish
Overall momentum of the chart: Bullish
Price is rising towards the pivot and could potentially make a bearish reaction off this level to drop towards the 1st support.
Pivot: 5,263.47
Supporting reasons: Identified as a pullback resistance that aligns close to the all-time high.
1st support: 5,117.70
Supporting reasons: Acts as an overlap support, suggesting a significant area where buying interests could increase for a potential rebound in price.
1st resistance: 5,381.06
Supporting reasons: Acts as resistance that aligns with a 127.2% Fibonacci extension level, suggesting a significant area where selling pressures could intensify.
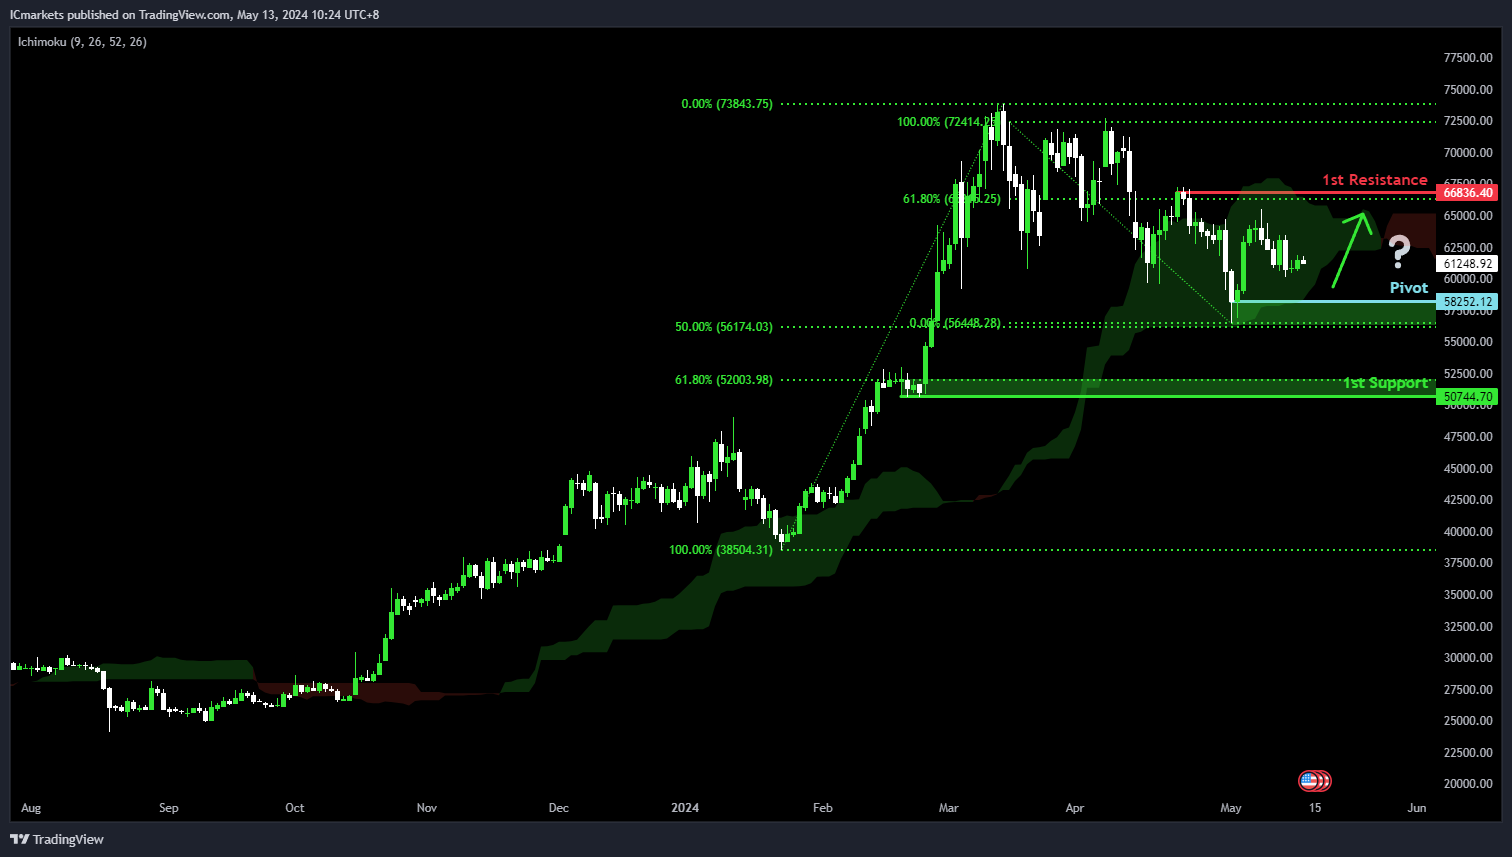
BTC/USD (Bitcoin):
Potential Direction: Bullish
Overall momentum of the chart: Neutral
Price is falling towards the pivot and could potentially make a bullish reaction off this level to rise towards the 1st resistance.
Pivot: 58,252.12
Supporting reasons: Identified as a pullback support that aligns close to a 50% Fibonacci retracement level, suggesting an area where buying interests could increase.
1st support: 50,744.70
Supporting reasons: Acts as an overlap support that aligns close to a 61.8% Fibonacci retracement level, suggesting an area where buying interests could pick up to halt further downward movements.
1st resistance: 66,836.40
Supporting reasons: Marked by a pullback resistance that aligns close to a 61.8% Fibonacci retracement level, indicating a significant barrier that could cap further upward movements.
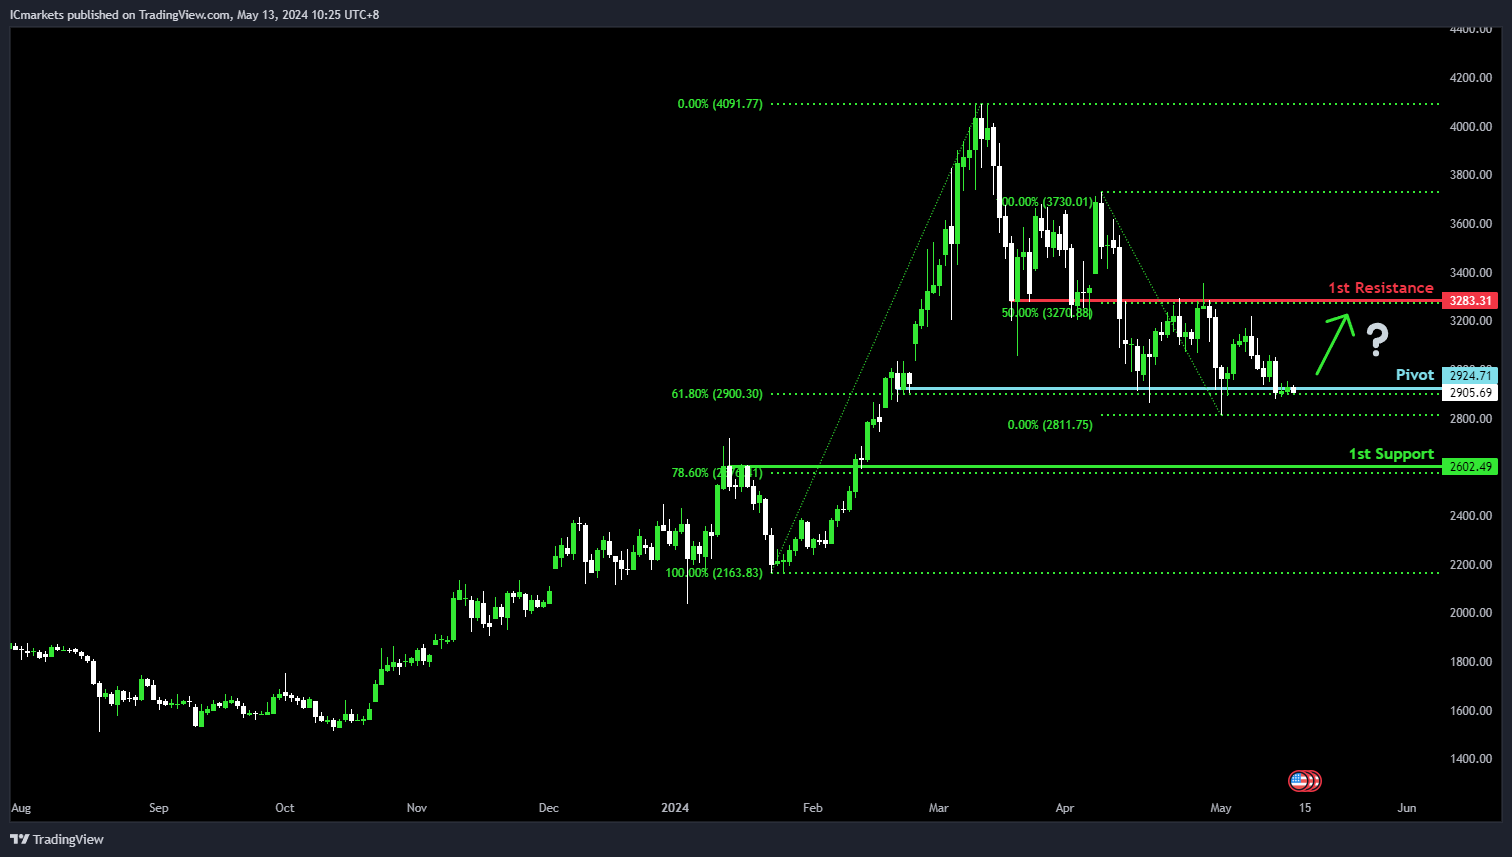
ETH/USD (Ethereum):
Potential Direction: Bullish
Overall momentum of the chart: Bearish
Price is trading close to the pivot and could potentially make a bullish reaction off this level to rise towards the 1st resistance.
Pivot: 2,924.71
Supporting reasons: Acts as a pullback support that aligns with a 61.8% Fibonacci retracement level, suggesting a significant area where buying interests could increase.
1st support: 2,602.49
Supporting reasons: Identified as a pullback support that aligns with a 78.6% Fibonacci retracement level, suggesting a significant area which could provide a strong foundation to halt further downward movements.
1st resistance: 3,283.31
Supporting reasons: Identified as an overlap resistance that aligns with a 50% Fibonacci retracement level, marking a significant barrier that could cap further upward movements.
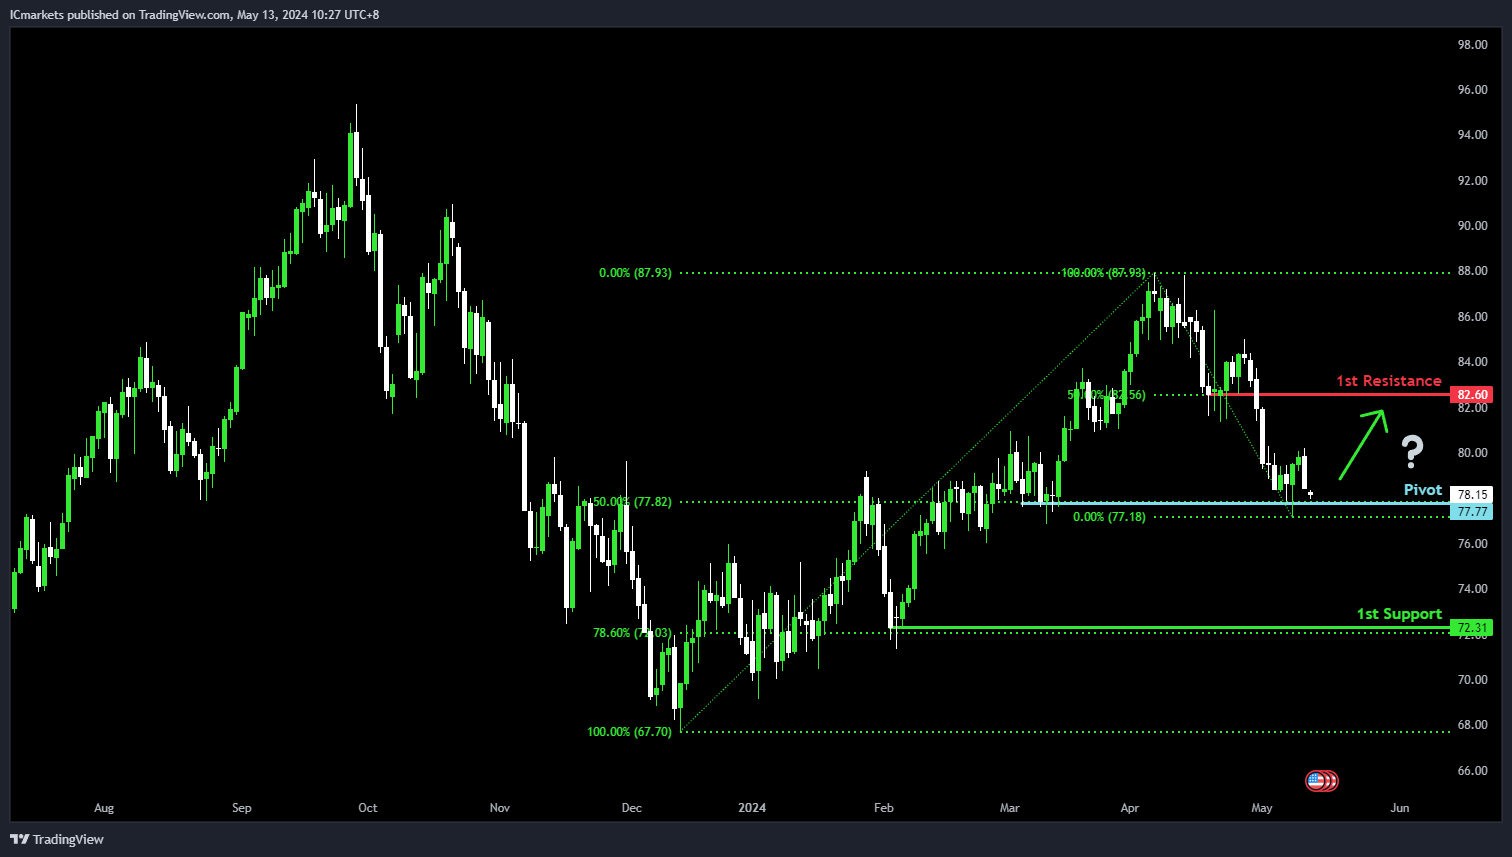
WTI/USD (Oil):
Potential Direction: Bullish
Overall momentum of the chart: Bearish
Price is trading close to the pivot and could potentially make a bullish reaction off this level to rise towards the 1st resistance.
Pivot: 77.77
Supporting reasons: Acts as a pullback support that aligns with a 50% Fibonacci retracement level, suggesting a significant area where buying interests have increased recently.
1st support: 72.31
Supporting reasons: Identified as a pullback support that aligns with a 78.6% Fibonacci retracement level, suggesting a significant area where price has previously found strong buying interest recently and could provide a solid foundation to halt further downward movements.
1st resistance: 82.60
Supporting reasons: Identified as a pullback resistance that aligns with a 50% Fibonacci retracement level, marking a significant barrier that could cap further upward movements.
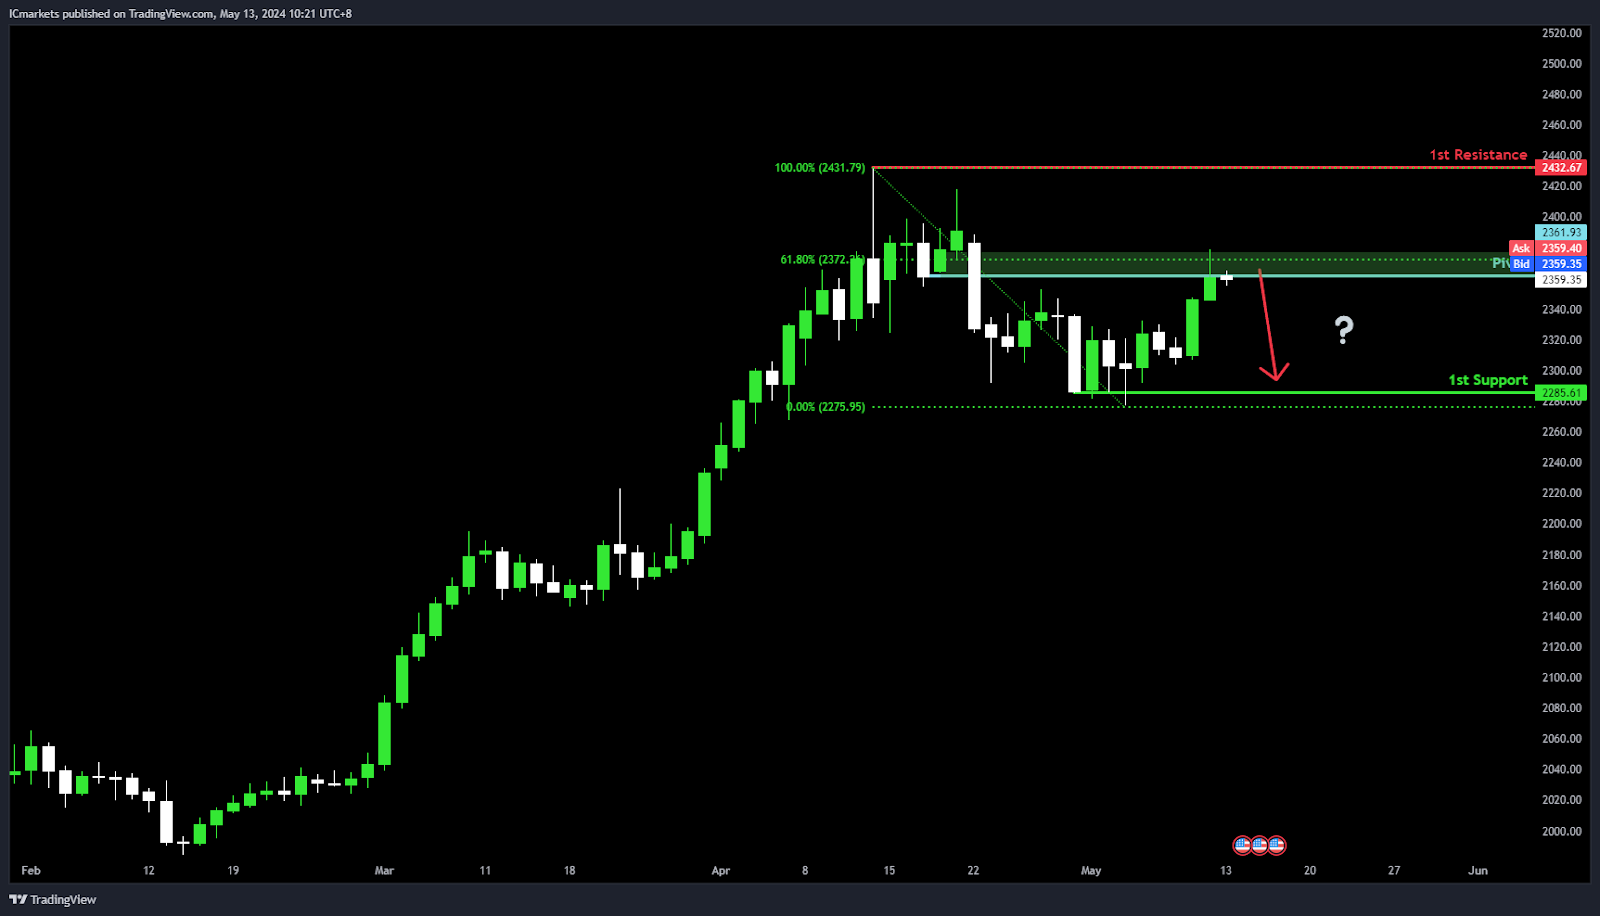
XAU/USD (GOLD):
Potential Direction: Bearish
Overall momentum of the chart: Bullish
Price could potentially make a bearish reaction off pivot and drop to 1st support.
Pivot: 2361.00
Supporting reasons: An Overlap resistance combined with the 61.80% Fibonacci Retracement, indicating a significant level where selling pressure might intensify.
1st support: 2285.61
Supporting reasons: Multi-swing low support, suggesting a level where buyers might step in to support the price.
1st resistance: 2432.67
Supporting reasons: Swing high resistance, representing a level where selling pressure might increase, potentially acting as a barrier to further upside movement.
The accuracy, completeness and timeliness of the information contained on this site cannot be guaranteed. IC Markets does not warranty, guarantee or make any representations, or assume any liability regarding financial results based on the use of the information in the site.
News, views, opinions, recommendations and other information obtained from sources outside of www.icmarkets-vng.com, used in this site are believed to be reliable, but we cannot guarantee their accuracy or completeness. All such information is subject to change at any time without notice. IC Markets assumes no responsibility for the content of any linked site.
The fact that such links may exist does not indicate approval or endorsement of any material contained on any linked site. IC Markets is not liable for any harm caused by the transmission, through accessing the services or information on this site, of a computer virus, or other computer code or programming device that might be used to access, delete, damage, disable, disrupt or otherwise impede in any manner, the operation of the site or of any user’s software, hardware, data or property.


