DXY:
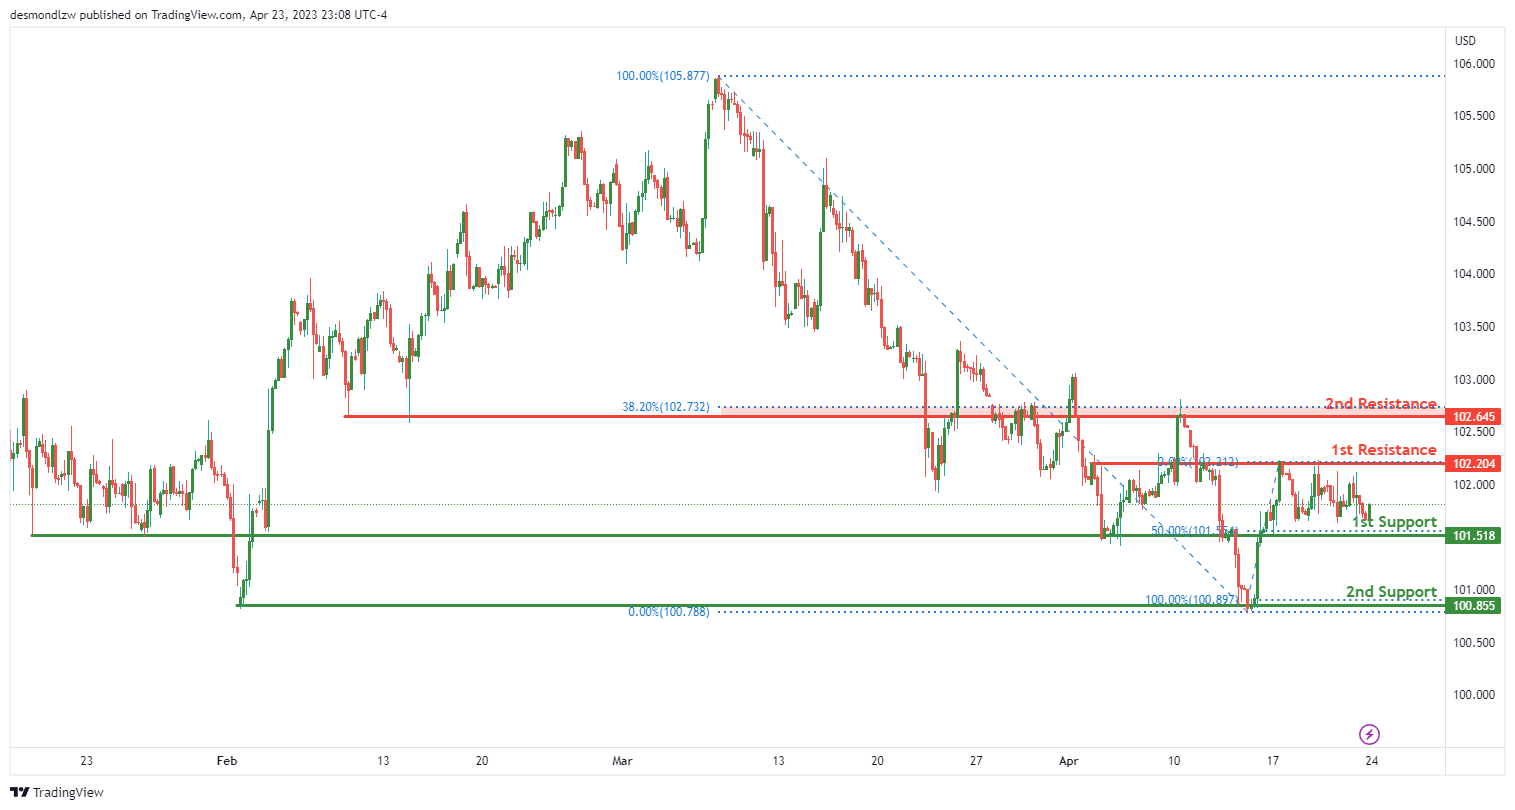
The DXY chart is currently exhibiting a neutral momentum, indicating that there is no clear bullish or bearish sentiment in the market. The price may potentially fluctuate between the 1st resistance and support levels.
The 1st support level is at 101.51 and is a strong level for potential support. This level coincides with the 50% Fibonacci retracement and is also an overlap support, providing a strong level of potential support for the price if it were to drop.
The next support level is at 100.85, which is a multi-swing low support that has previously acted as a support level for the price.
On the other hand, if the price were to rise, the 1st resistance level at 102.20 is a good level for potential resistance. This level is an overlap resistance, meaning that it has previously acted as a resistance level for the price.
If the price were to break through the 1st resistance level, the next potential resistance level is also at 102.20, which is also an overlap resistance level. This level coincides with the 38.20% Fibonacci retracement, making it a strong level for potential resistance.
EUR/USD:
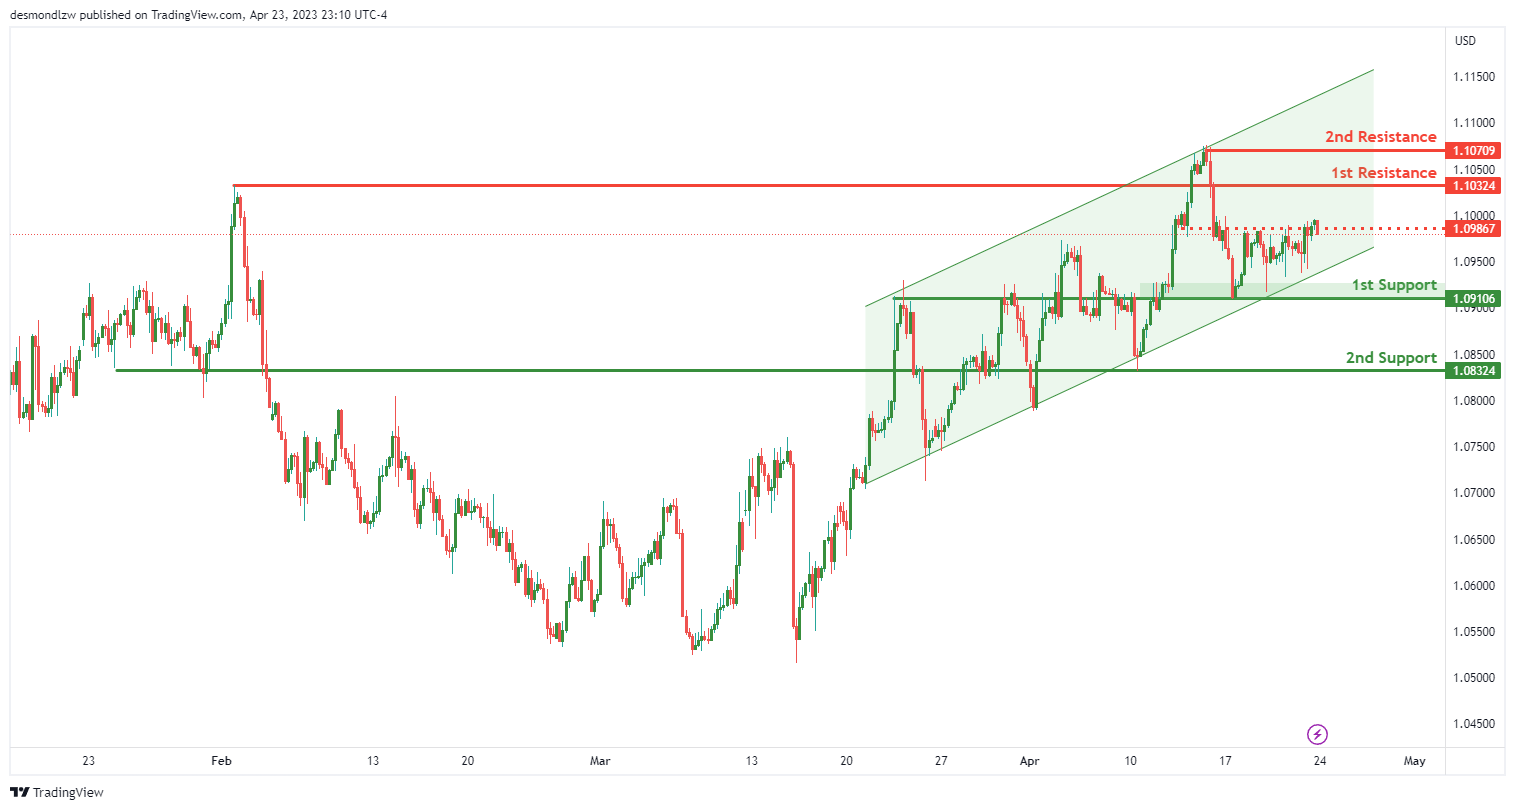
The EUR/USD chart exhibits a bullish overall momentum, supported by the fact that the price is in a bullish ascending channel. This channel suggests that the price may continue to rise due to its bullish momentum.
The price may potentially make a bullish continuation towards the 1st resistance level, which is at 1.1032. This level is a pullback resistance, meaning that it has previously acted as a resistance level for the price. A breakout above this level may indicate a bullish continuation for the price.
The 1st support level is at 1.0910 and is a good level for potential support. This level is an overlap support and may provide support for the price if it were to drop.
If the price were to drop below the 1st support level, the next potential support level is at 1.0832. This level is also an overlap support and has previously acted as a support level for the price.
On the other hand, if the price were to rise, the 2nd resistance level is at 1.1070. This level is a swing high resistance, meaning that it has previously acted as a resistance level for the price and may provide strong resistance if the price were to approach it.
If the price were to break through the 1st resistance level, there is an intermediate resistance level at 1.0986. This level is an overlap resistance and may provide resistance for the price before it reaches the 2nd resistance level.
GBP/USD:
The GBP/USD chart exhibits a bullish overall momentum, indicating that the price may continue to rise towards the 1st resistance level.
The 1st support level is at 1.2346, which is a good level for potential support. This level is an overlap support and coincides with the 23.60% Fibonacci retracement, providing a strong level of potential support for the price if it were to drop.
The next potential support level is at 1.2273, which is also an overlap support and coincides with the 38.20% Fibonacci retracement. This level has previously acted as a support level for the price.
On the other hand, if the price were to rise, the 1st resistance level is at 1.2471. This level is a multi-swing high resistance and coincides with the 61.80% Fibonacci retracement, providing a strong level of potential resistance for the price.
If the price were to break through the 1st resistance level, the next potential resistance level is at 1.2528. This level is also a multi-swing high resistance and has previously acted as a resistance level for the price.
USD/CHF:
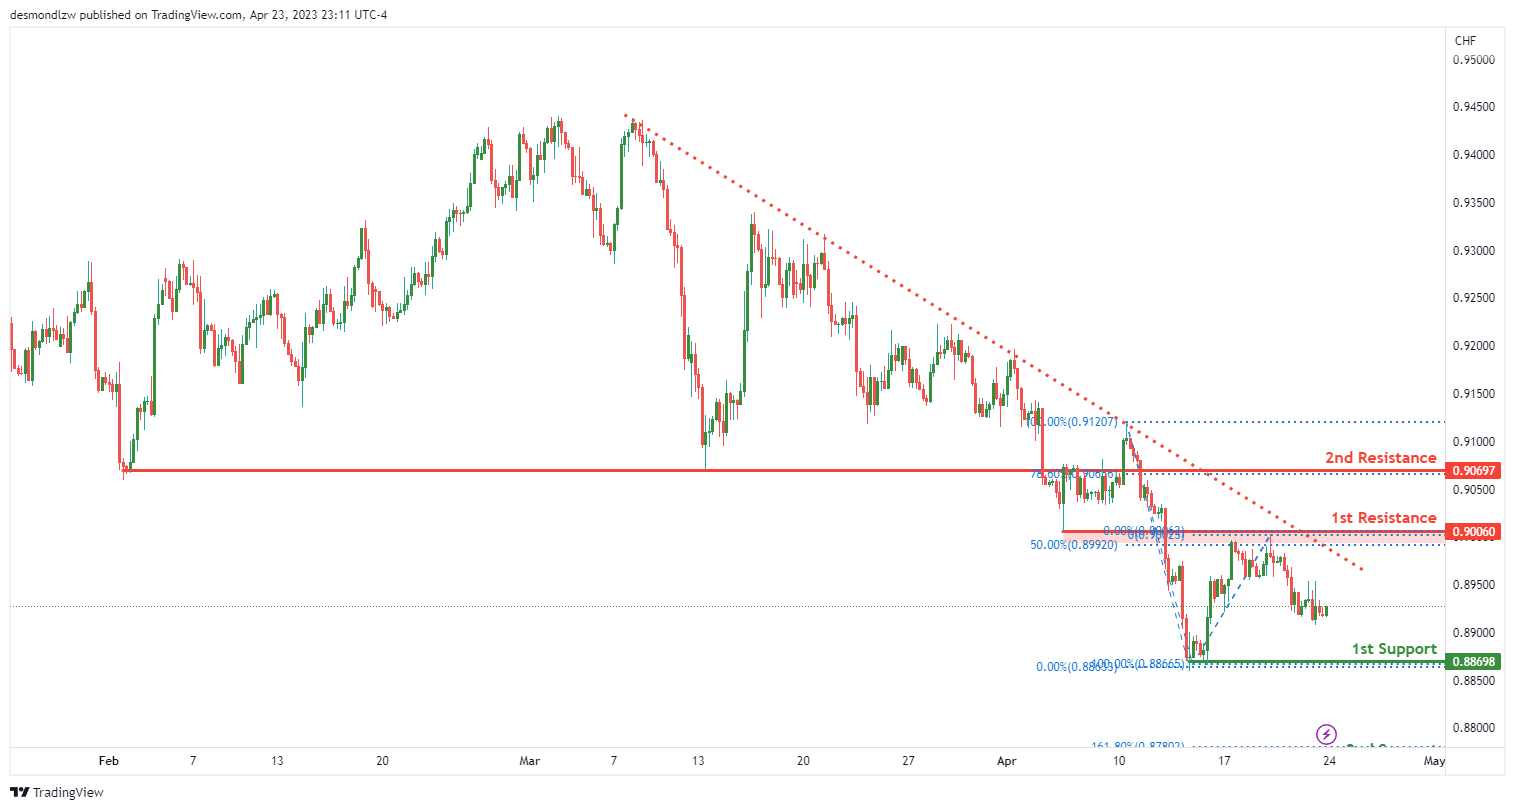
The USD/CHF chart is bearish, with the price currently below a major descending trend line, suggesting that bearish momentum is likely to continue. Therefore, it is expected that price may potentially make a bearish continuation towards the first support level at 0.8869.
The 0.8869 level is a multi-swing low support, which means that it has been an area of buying interest in the past. Additionally, this support level coincides with the 50% Fibonacci retracement level, which is a key level in technical analysis.
In terms of resistance levels, the first resistance level is at 0.9006, which is a multi-swing high resistance. This level has been a significant area of selling interest in the past. The second resistance level is at 0.9069, which is a pullback resistance and coincides with the 78.60% Fibonacci retracement level. This resistance level is significant as it may potentially act as a barrier to any upward movements in the price.
If price were to break below the 0.8869 support level, the next support level it could drop to is the 2nd support level at 0.8699, which is a multi-swing low support and has been an area of buying interest in the past.
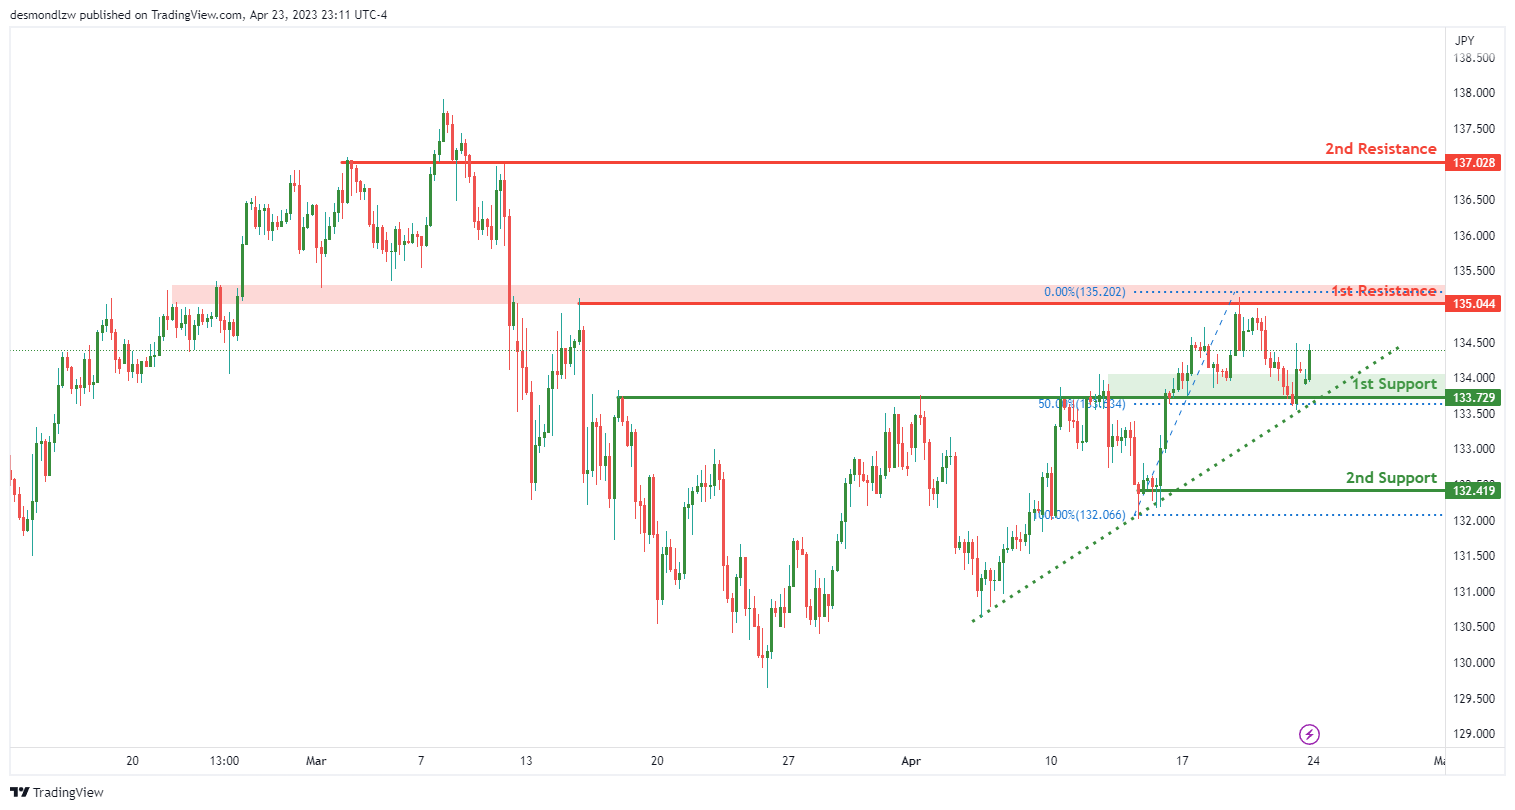
USD/JPY:
the USD/JPY chart is bullish, with the price currently above a major ascending trend line and also on an ascending trend line which acts as support, suggesting that further bullish momentum is on the cards. Therefore, it is expected that the price could potentially make a bullish continuation towards the first resistance level at 135.04.
The 133.72 level is the first support level, and it is considered good due to being an overlap support and also coinciding with the 50% Fibonacci retracement level. This support level has been an area of buying interest in the past, making it a significant level for traders.
The second support level is at 132.41, but no specific reason is given as to why it is considered good. Nonetheless, this level can potentially act as a further support level in case the price drops further.
In terms of resistance levels, the first resistance level is at 135.04, which is an overlap resistance. This level has been a significant area of selling interest in the past, and a breakout above this level may trigger further bullish momentum.
The second resistance level is at 137.02, which is also an overlap resistance. If the price were to break above the first resistance level, this level may potentially act as a further barrier to any upward movements in the price.
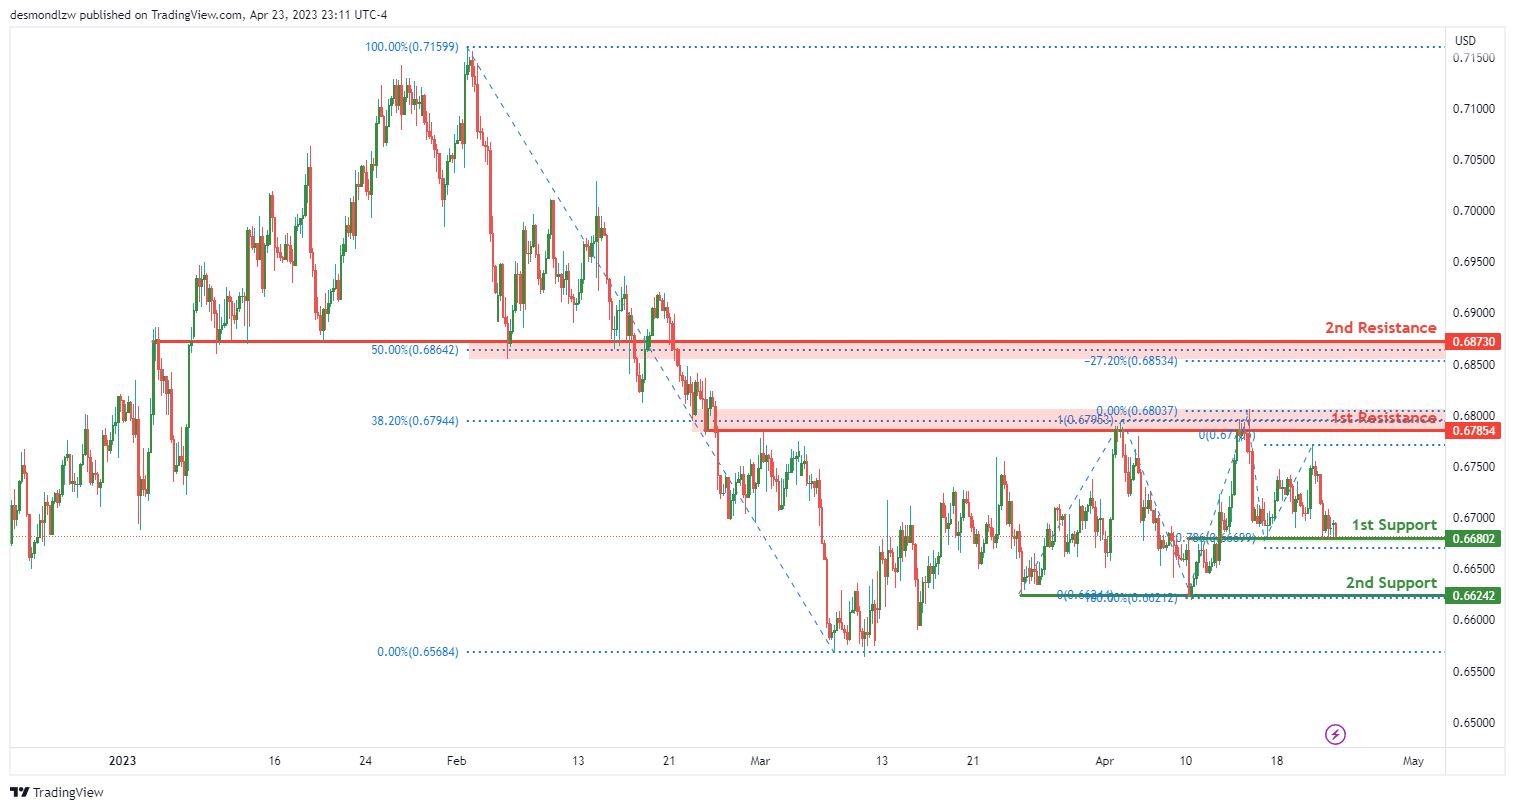
AUD/USD:
The AUD/USD chart is bearish, suggesting that prices may potentially continue to drop. Therefore, it is expected that the price could potentially make a bearish break off the first support level at 0.6680 and drop towards the second support level at 0.6624.
The 0.6680 level is the first support level, and it is considered good due to being an overlap support and also coinciding with the 78.60% Fibonacci projection level. This support level has been an area of buying interest in the past, making it a significant level for traders.
The second support level is at 0.6624, which is a multi-swing low support. This level has also been an area of buying interest in the past and could potentially act as a further support level in case the price drops further.
In terms of resistance levels, the first resistance level is at 0.6785, which is an overlap resistance and also coincides with the 38.20% Fibonacci retracement level. This level has been a significant area of selling interest in the past.
The second resistance level is at 0.6873, which is a pullback resistance and coincides with the 50% Fibonacci retracement level. This resistance level is significant as it may potentially act as a barrier to any upward movements in the price.
NZD/USD:
The NZD/USD chart is bullish, suggesting that prices may potentially continue to rise. Therefore, it is expected that the price could potentially make a bullish bounce off the first support level at 0.6133 and head towards the first resistance level at 0.6214.
The 0.6133 level is the first support level, and it is considered good due to being an overlap support and also coinciding with the 78.60% Fibonacci retracement level. This support level has been an area of buying interest in the past, making it a significant level for traders.
The second support level is at 0.6093, which is a multi-swing low support. This level has also been an area of buying interest in the past and could potentially act as a further support level in case the price drops further.
In terms of resistance levels, the first resistance level is at 0.6214, which is a multi-swing high resistance and also coincides with the 50% Fibonacci retracement level. This level has been a significant area of selling interest in the past, and a breakout above this level may trigger further bullish momentum.
The second resistance level is at 0.6280, which is a pullback resistance. This resistance level is significant as it may potentially act as a barrier to any upward movements in the price.
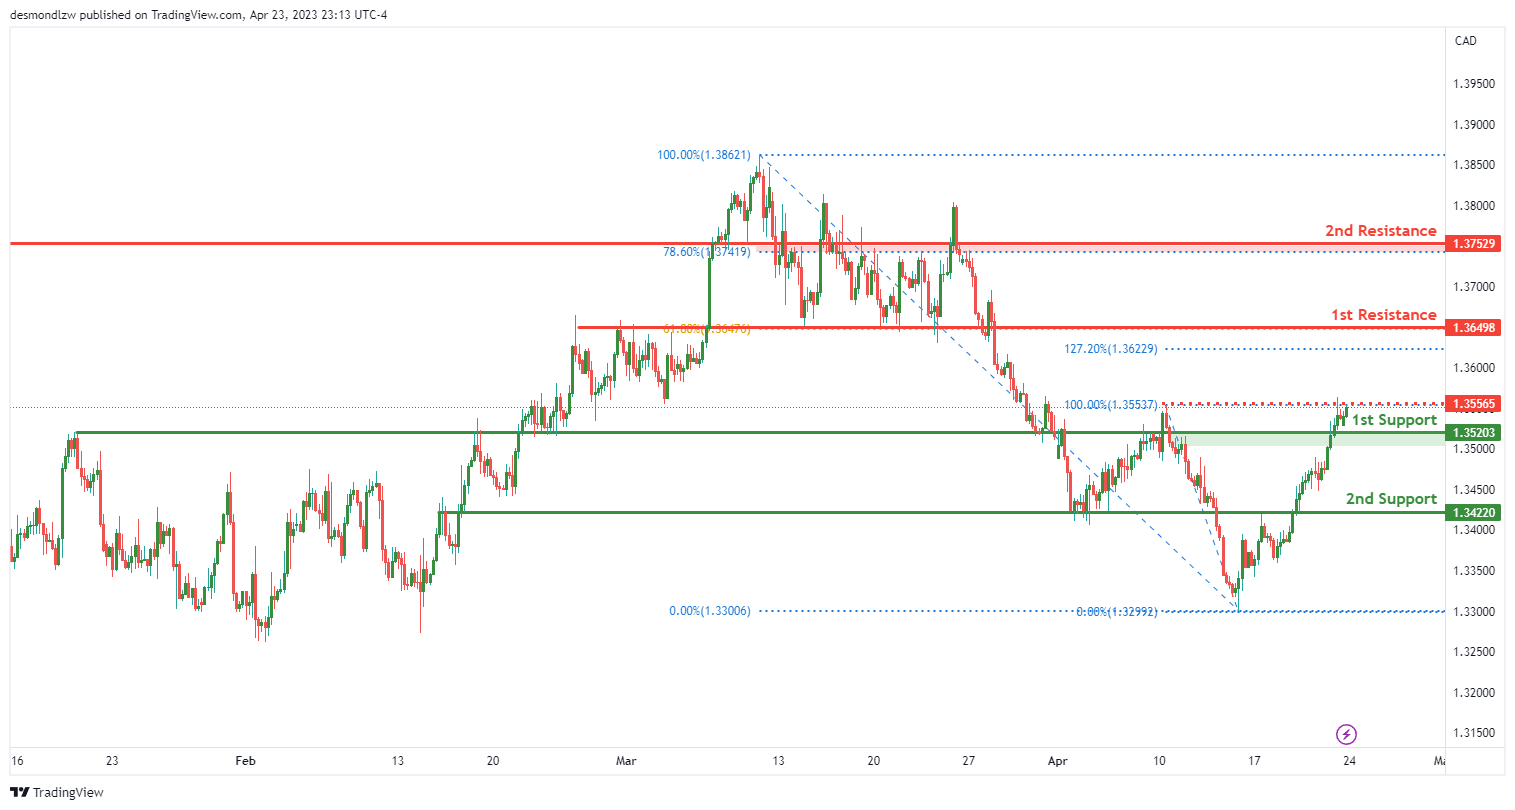
USD/CAD:
the USD/CAD chart is bullish, suggesting that prices may potentially continue to rise. Therefore, it is expected that the price could potentially make a bullish continuation towards the first resistance level at 1.3649.
The 1.3520 level is the first support level, which is considered good due to being a pullback support. This support level has been an area of buying interest in the past and may potentially act as a further support level in case the price drops further.
The second support level is at 1.3422, which is also a pullback support. This level has been an area of buying interest in the past, and it may potentially act as a further support level in case the price drops further.
In terms of resistance levels, the first resistance level is at 1.3649, which is a pullback resistance and also coincides with the 61.80% Fibonacci retracement level. This level has been a significant area of selling interest in the past, and a breakout above this level may trigger further bullish momentum.
The second resistance level is at 1.3752, which is also a pullback resistance and coincides with the 78.60% Fibonacci retracement level. This resistance level is significant as it may potentially act as a barrier to any upward movements in the price.
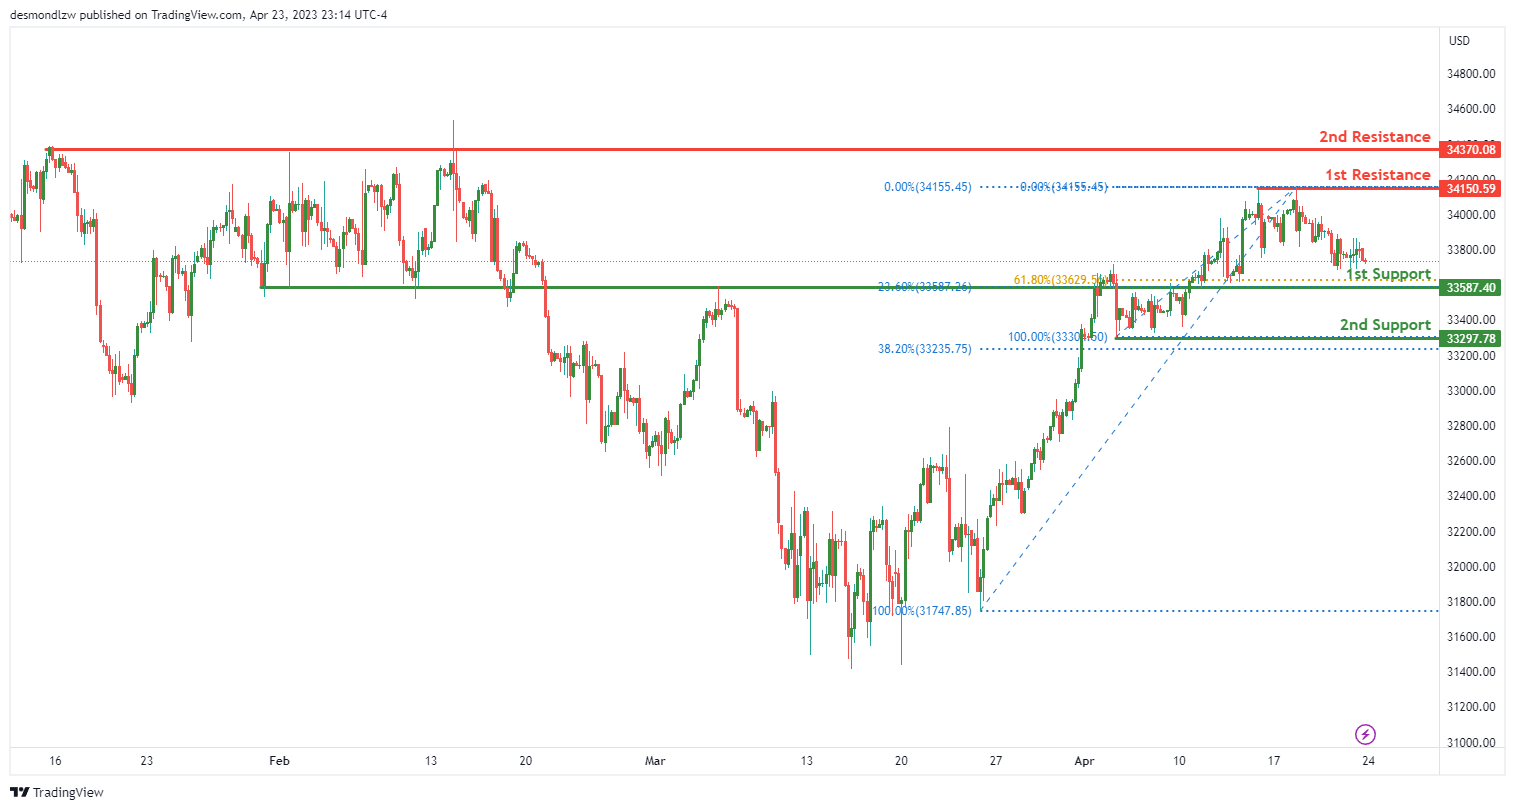
DJ30:
The DJ30 chart is bearish, suggesting that prices may potentially continue to fall. Therefore, it is expected that the price could potentially make a bearish continuation towards the first support level at 33587.40.
The 33587.40 level is the first support level, which is considered good due to being an overlap support and coinciding with the 61.80% Fibonacci retracement level. This support level has been an area of buying interest in the past and may potentially act as a further support level in case the price drops further.
The second support level is at 33297.78, which is a pullback support and coincides with the 38.20% Fibonacci retracement level. This level has also been an area of buying interest in the past and may potentially act as a further support level in case the price drops further.
In terms of resistance levels, the first resistance level is at 34150.59, which is a multi-swing high resistance. This level has been a significant area of selling interest in the past and may potentially act as a barrier to any upward movements in the price.
The second resistance level is at 34370.08, which is also a multi-swing high resistance. This resistance level is significant as it may potentially act as a barrier to any upward movements in the price.
GER30:
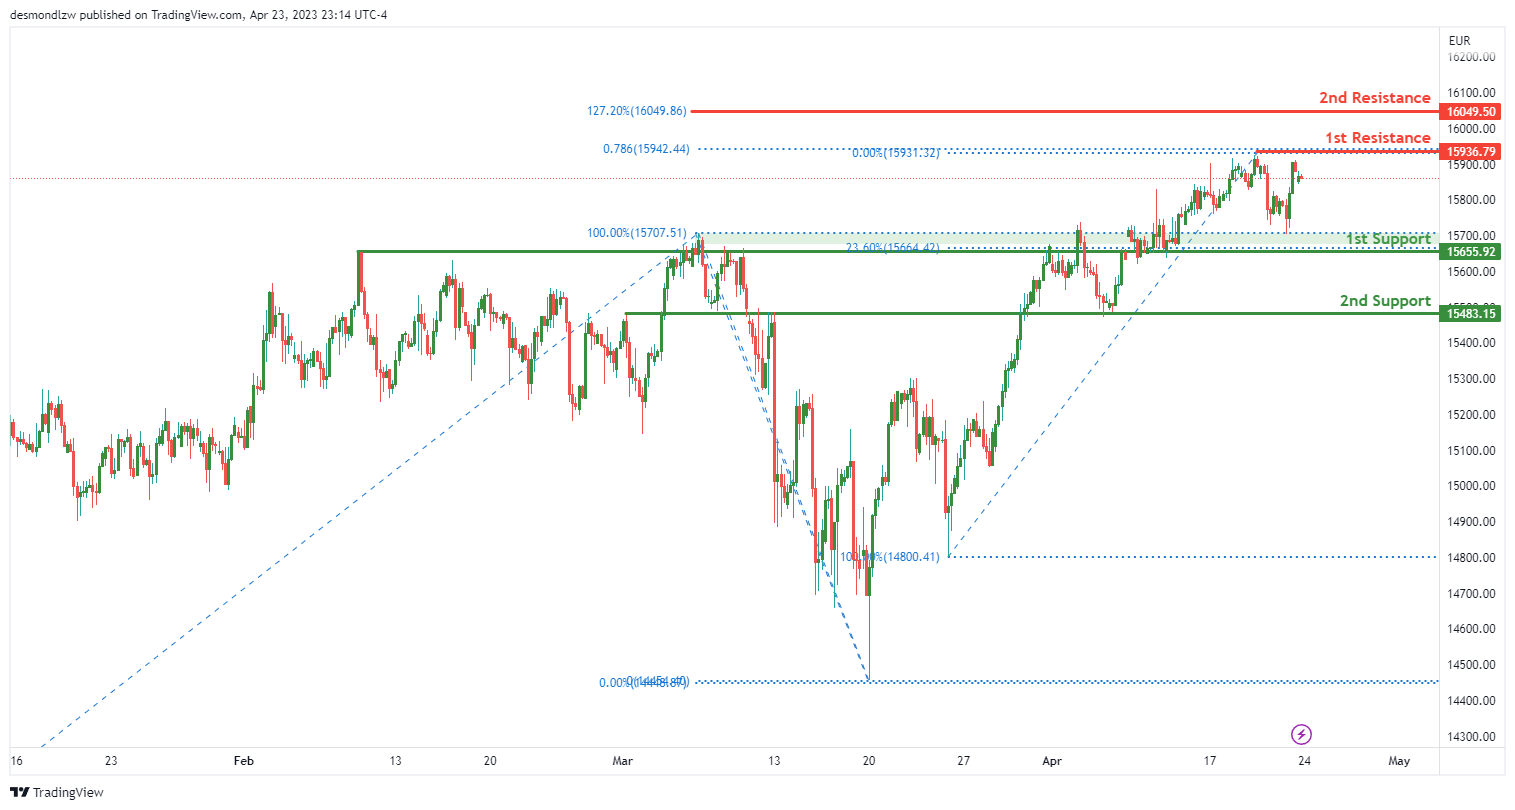
The GER30 chart is bearish, suggesting that prices may potentially continue to fall. Therefore, it is expected that the price could potentially make a bearish reaction off the first resistance level at 15936.79 and drop to the first support level at 15655.92.
The 15655.92 level is the first support level, which is considered good due to being a pullback support and coinciding with the 23.60% Fibonacci retracement level. This support level has been an area of buying interest in the past and may potentially act as a further support level in case the price drops further.
The second support level is at 15483.15, which is an overlap support. This level has also been an area of buying interest in the past and may potentially act as a further support level in case the price drops further.
In terms of resistance levels, the first resistance level is at 15936.79, which is a multi-swing high resistance and coincides with the 78.60% Fibonacci projection level. This level has been a significant area of selling interest in the past and may potentially act as a barrier to any upward movements in the price.
The second resistance level is at 16049.50, which is a swing high resistance and coincides with the 127.20% Fibonacci extension level. This resistance level is significant as it may potentially act as a barrier to any upward movements in the price.
BTC/USD:
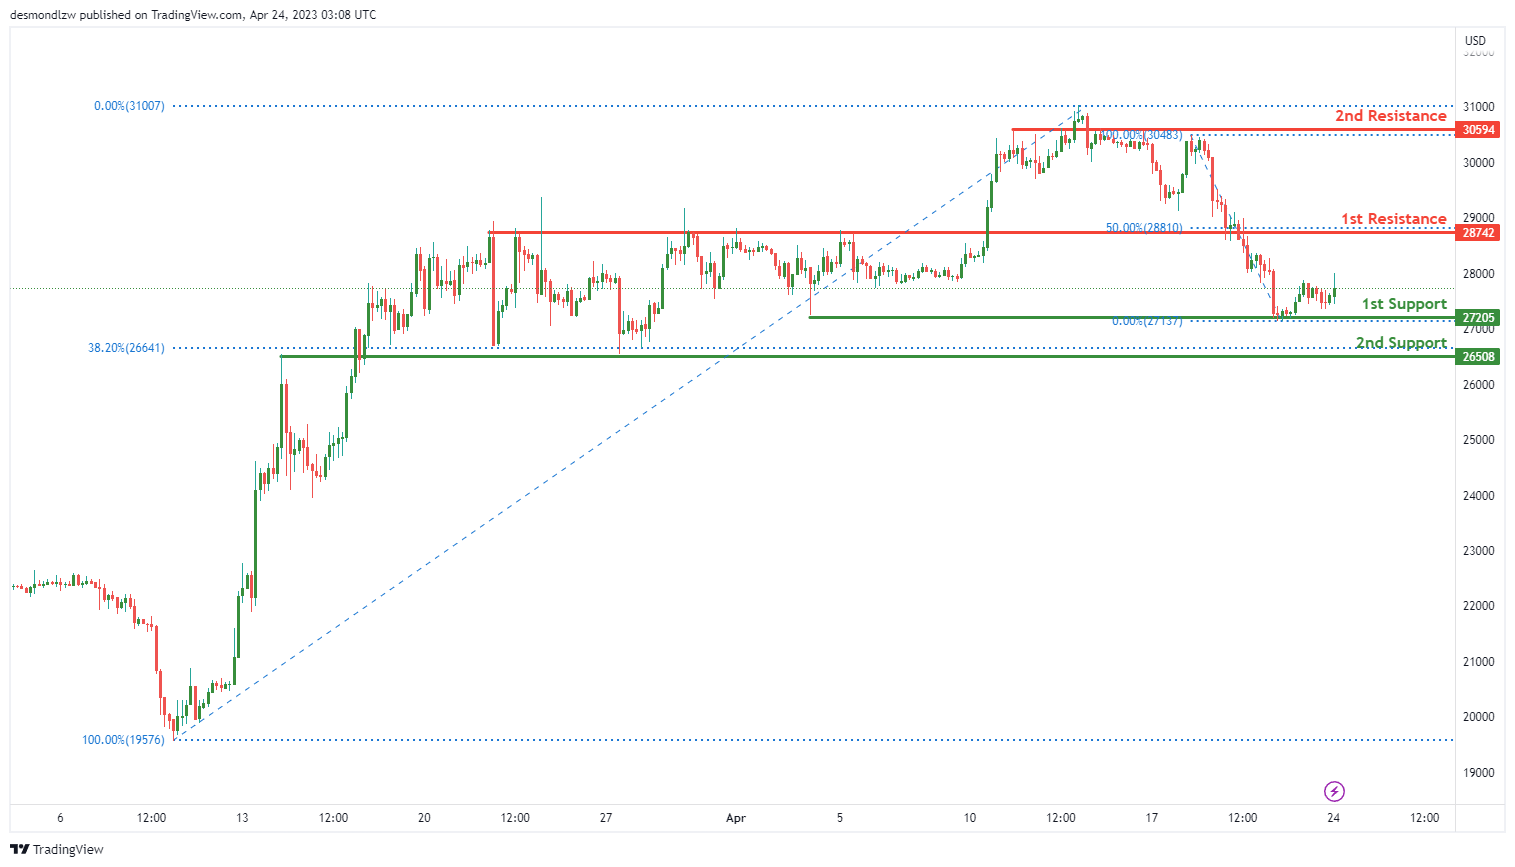
The BTC/USD chart is bullish, suggesting that prices may potentially continue to rise. Therefore, it is expected that the price could potentially make a bullish continuation towards the first resistance level at 28742.
The first support level is at 27205, which is considered good due to being a multi-swing low support. This support level has acted as a significant area of buying interest in the past and may potentially act as a further support level if the price drops further.
The second support level is at 26508, which is an overlap support and coincides with the 38.20% Fibonacci retracement level. This level has also acted as an area of buying interest in the past and may potentially act as a further support level if the price drops further.
In terms of resistance levels, the first resistance level is at 28742, which is a pullback resistance and coincides with the 50% Fibonacci retracement level. This level has been a significant area of selling interest in the past and may potentially act as a barrier to any further upward movements in the price.
The second resistance level is at 30594, which is an overlap resistance. This level has acted as an area of selling interest in the past and may potentially act as a further barrier to any
US500
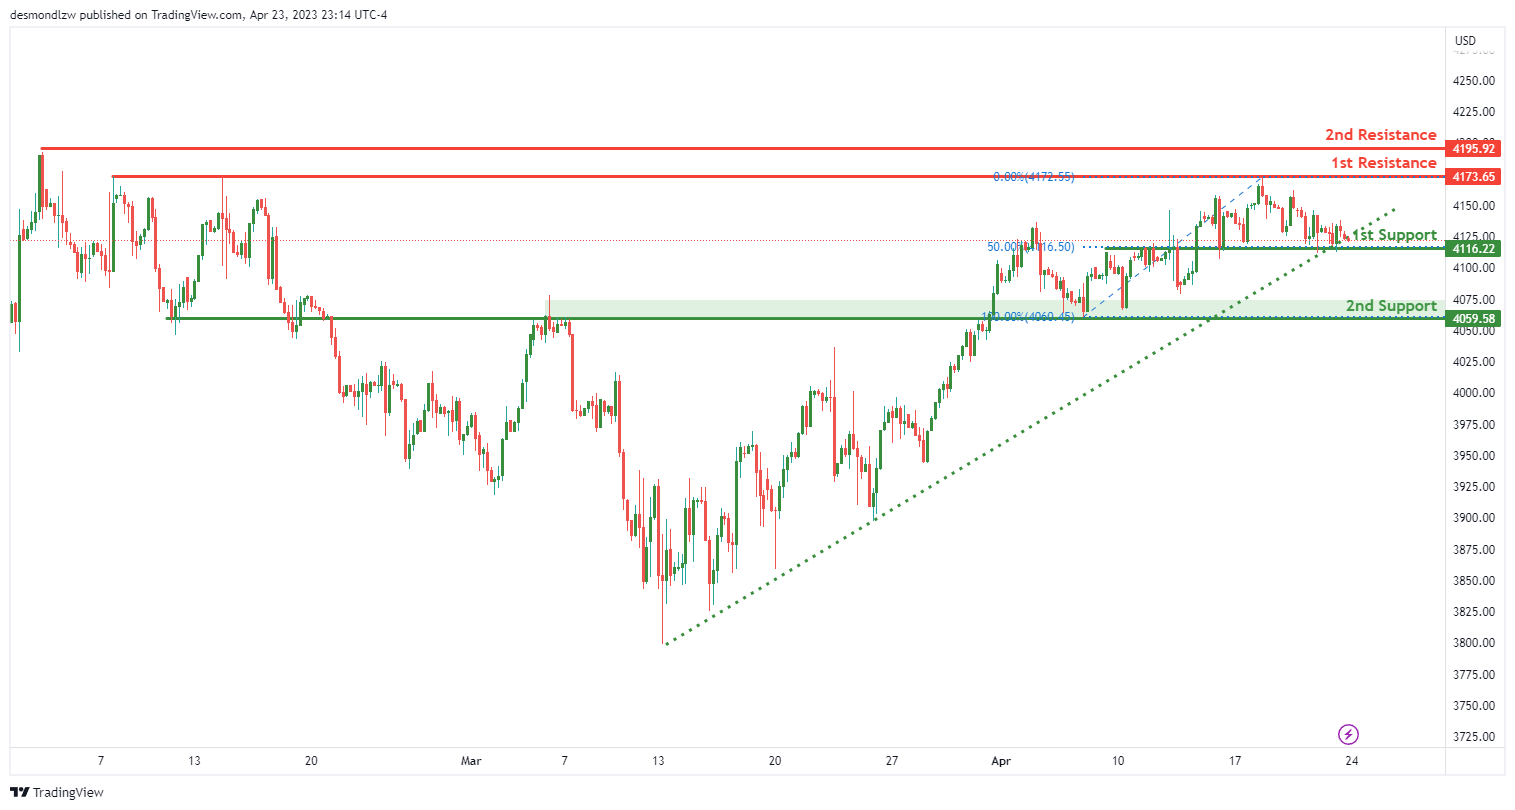
The US500 chart is showing a bullish momentum with the price currently above a major ascending trend line, suggesting that there is potential for further bullish momentum in the near future. The chart could potentially continue its bullish trend towards the first resistance level.
The first support level is located at 4166.22, which is a good level of support due to it being an overlap support and coinciding with a 50% Fibonacci retracement.
If the price were to break below the first support level, it could potentially drop to the second support level at 4059.58, which is also an overlap support.
On the other hand, if the bullish momentum continues, the first resistance level of 4173.65 is a good level to watch for. This level is a multi-swing high resistance, indicating it could potentially pose a significant challenge to the current bullish momentum.
If the price were to break through the first resistance level, it could potentially rise towards the second resistance level of 4195.92, which is a swing high resistance.
It’s worth noting that since the price is currently on an ascending trend line, it is likely to continue its bullish trend. However, if the price were to break below the trend line, it could indicate a shift in momentum towards a more bearish direction.
ETH/USD:
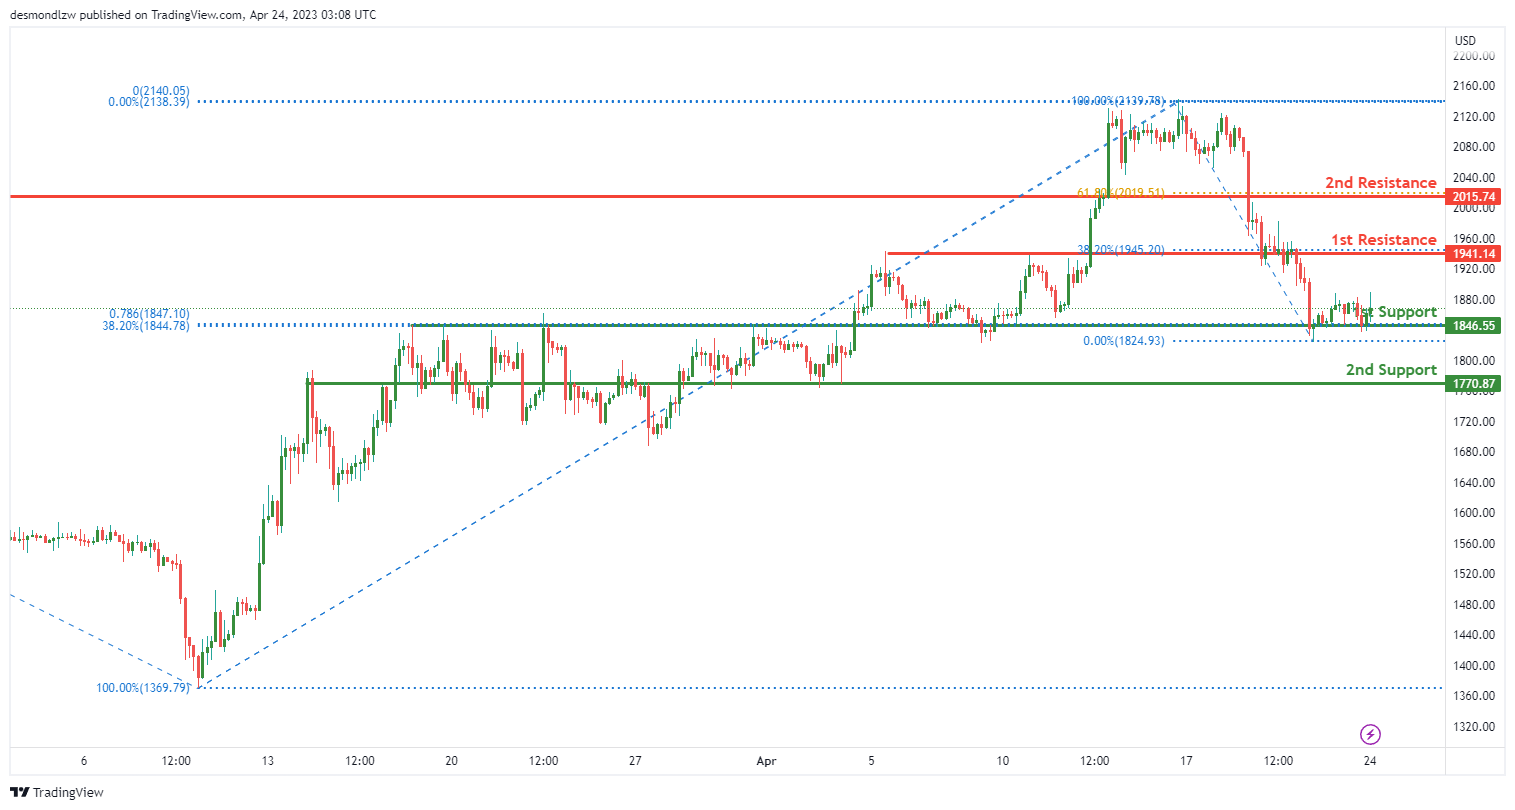
ETH/USD Momentum Remains Bullish with Potential for Bounce off 1st Support
The overall momentum for ETH/USD remains bullish as the price is currently above a major ascending trend line, which suggests further bullish momentum is on the cards. The price is on an ascending trend line which acts as support, adding to the bullish case.
ETH/USD could potentially make a bullish bounce off the first support and head towards the first resistance.
The first support level stands at 1846.55, making it a good level to keep an eye on for a potential bounce. This level is an overlap support and coincides with a 38.20% Fibonacci retracement.
If the price bounces off this support level, it could rise towards the first resistance at 1941.14. This level is a pullback resistance and also lines up with a 38.20% Fibonacci retracement, making it a significant level to watch.
In the case that the price breaks below the first support level, it could drop towards the second support at 1770.87. This level is also an overlap support, adding to its significance.
On the other hand, if the price manages to break above the first resistance level, it could potentially rise towards the second resistance at 2015.74. This level is a pullback resistance and lines up with a 61.80% Fibonacci retracement, making it a strong level of resistance.
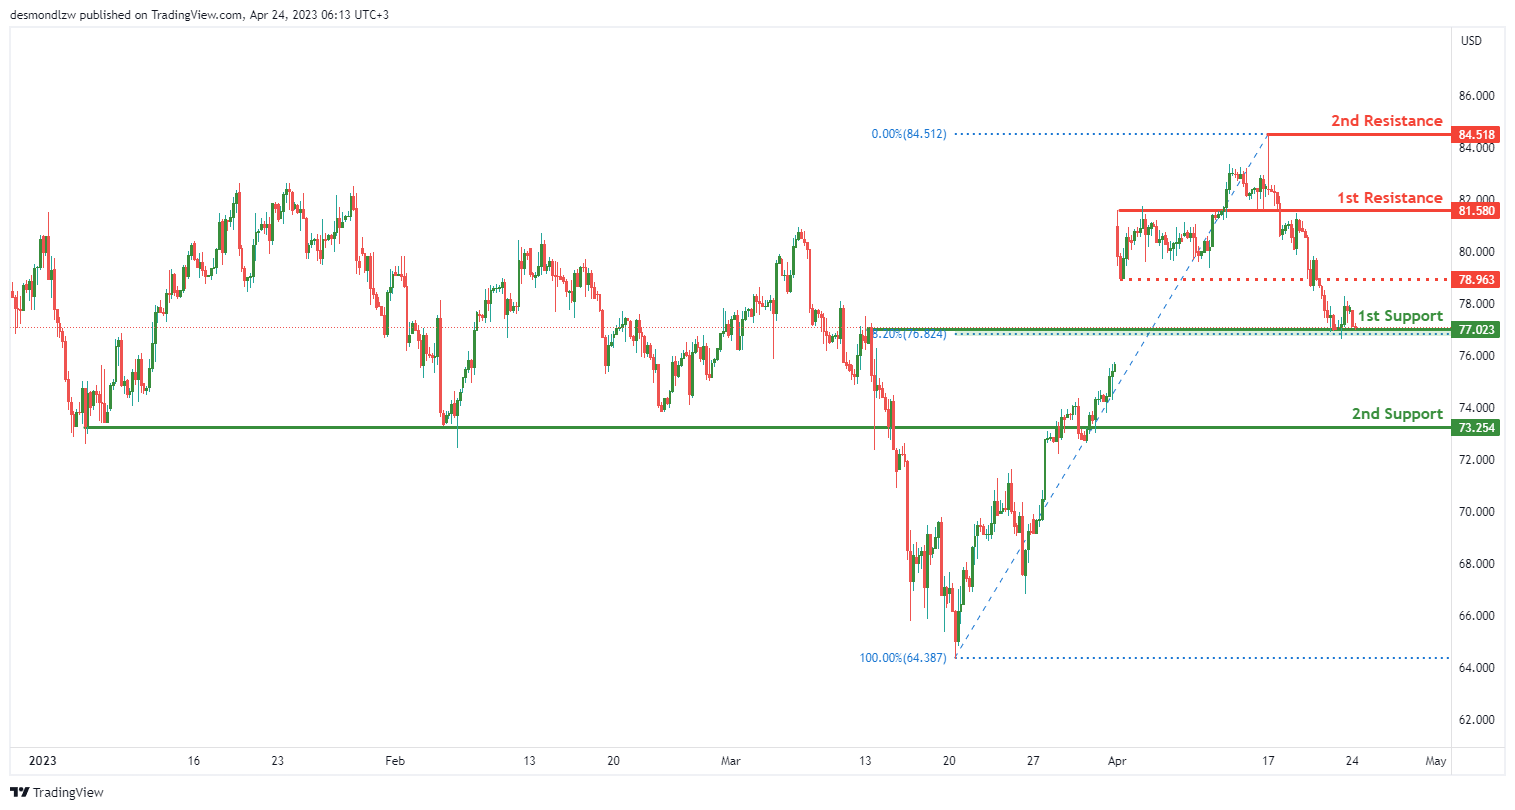
WTI/USD:
WTI Might Continue Bearish Momentum Towards 1st Support
The momentum of the WTI chart is currently bearish, with factors contributing to this momentum being that the price is below a major descending trend line. It suggests that further bearish momentum is on the cards.
If the price were to continue with its current momentum, it could potentially make a bearish continuation towards the 1st support at 77.02. This level is a good support as it coincides with a swing low support and has a 38.20% Fibonacci retracement lining up with it.
Should the price bounce from the 1st support, it might rise towards the intermediate resistance at 78.02 which is a pullback resistance level. From there, the price could potentially continue its bearish trend towards the 1st resistance at 81.58. This level is an overlap resistance.
However, if the price were to break the 1st support, it could potentially drop towards the 2nd support at 77.02. This level is also a good support as it coincides with a pullback support. If the price were to break below the 2nd support, it might continue its bearish momentum towards the 2nd resistance at 84.51. This level is a swing high resistance.
XAU/USD (GOLD):
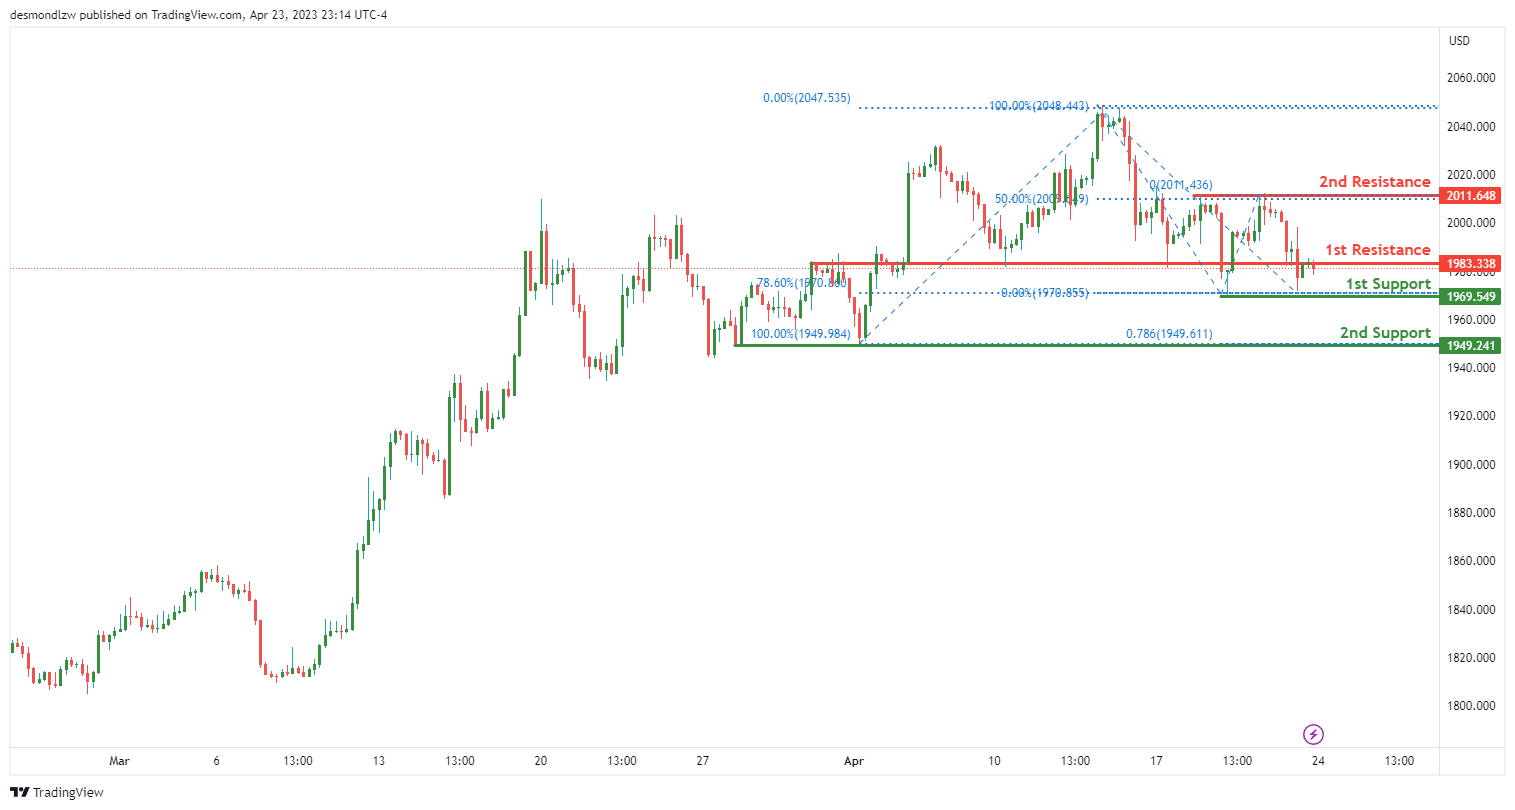
The XAU/USD, has been showing bearish momentum in recent times, according to technical analysis. The chart shows that the price is likely to make a bearish reaction off the first resistance level and drop to the first support level.
The first support level is at 1969.54, which is a multi-swing low support and a 78.60% Fibonacci retracement level. This level has shown strong support in the past and may act as a support again. If the price breaks below this level, the next support level is at 1949.24, which is also a multi-swing low support and a 78.60% Fibonacci projection level.
On the other hand, the first resistance level is at 1983.33, which is an overlap resistance level. This level has acted as a resistance in the past and is likely to do so again. If the price breaks above this level, the next resistance level is at 2011.64, which is a multi-swing high resistance and a 50% Fibonacci retracement level.
The accuracy, completeness and timeliness of the information contained on this site cannot be guaranteed. IC Markets does not warranty, guarantee or make any representations, or assume any liability regarding financial results based on the use of the information in the site.
News, views, opinions, recommendations and other information obtained from sources outside of www.icmarkets.com, used in this site are believed to be reliable, but we cannot guarantee their accuracy or completeness. All such information is subject to change at any time without notice. IC Markets assumes no responsibility for the content of any linked site.
The fact that such links may exist does not indicate approval or endorsement of any material contained on any linked site. IC Markets is not liable for any harm caused by the transmission, through accessing the services or information on this site, of a computer virus, or other computer code or programming device that might be used to access, delete, damage, disable, disrupt or otherwise impede in any manner, the operation of the site or of any user’s software, hardware, data or property.


