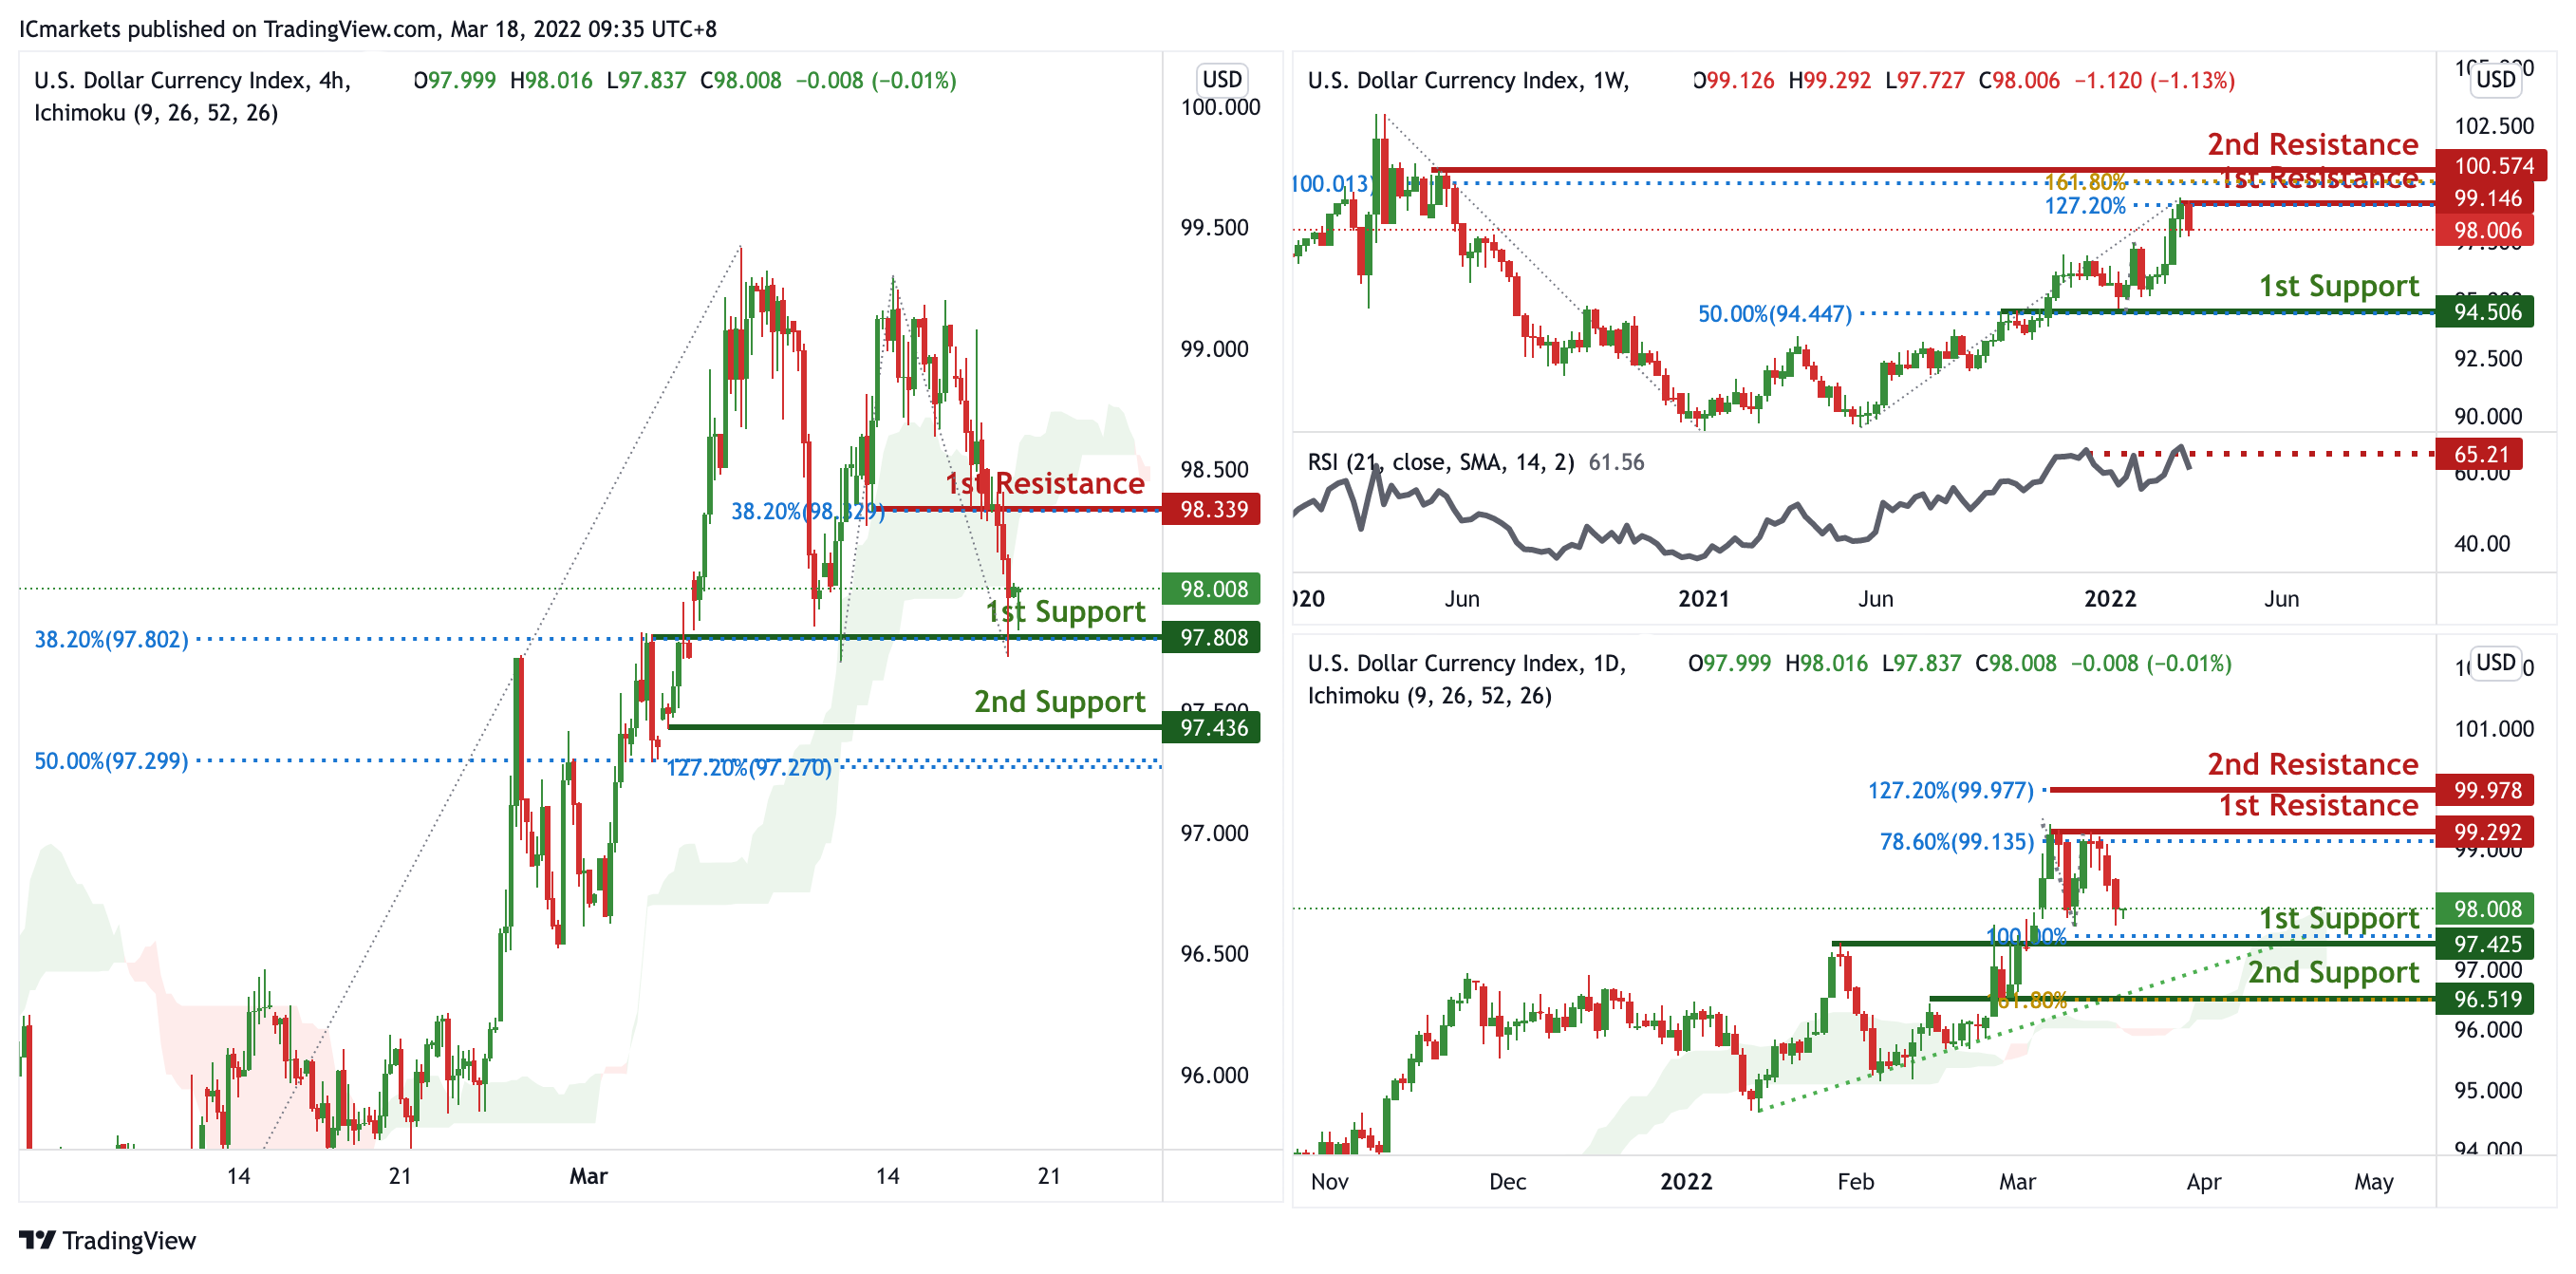
DXY:
On the weekly, prices have approached a pivot which is a graphical swing high. We see the potential for a dip from our 1st resistance at 99.146 in line with 127.2% Fibonacci projection towards our 1st support at 94.506 in line with 50% Fibonacci retracement. RSI is at levels where dips previously occurred, further supporting our bearish bias.
On the daily, prices are abiding to our ascending trendline. We see the potential for a bounce from our 1st support at 97.425 in line with 100% Fibonacci projection towards our 1st resistance at 99.292 in line with 78.6% Fibonacci projection. Prices are trading above our ichimoku cloud support, further supporting our bullish bias.
On the H4 timeframe, prices are on bullish momentum. We see the potential for a bounce from our 1st support at 97.808 in line with 38.2% Fibonacci retracement towards our 1st resistance at 98.339 in line with 38.2% Fibonacci retracement. Ichimoku clouds are showing green, further supporting our bullish bias.
Areas of consideration:
- H4 time frame, 1st resistance at 98.339
- H4 time frame, 1st support at 97.808
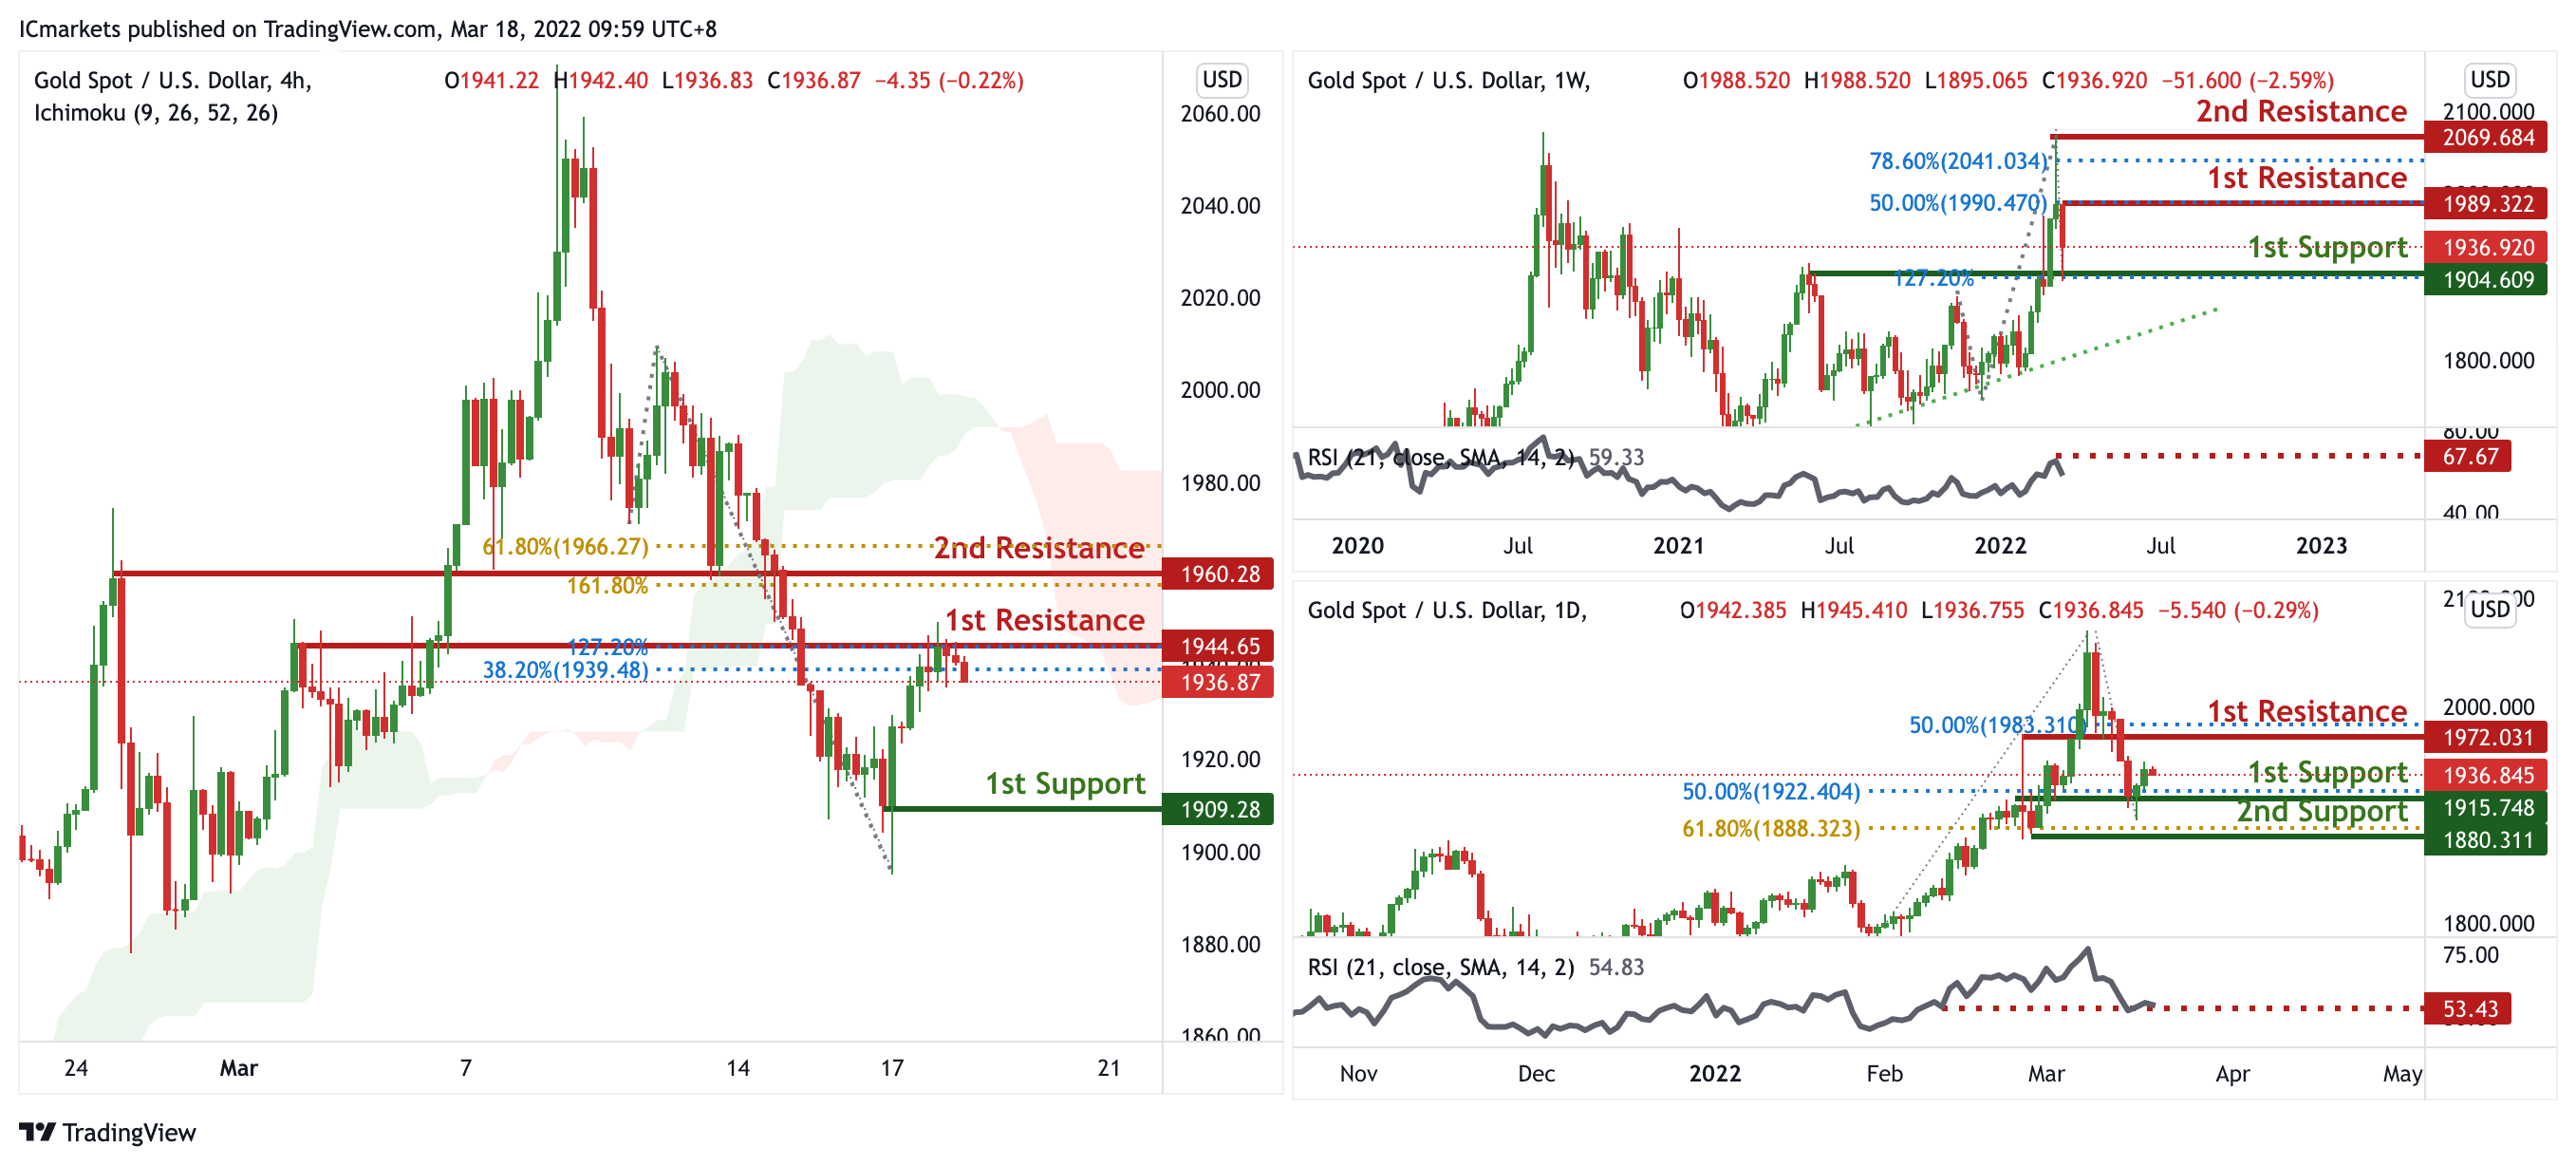
XAU/USD (GOLD):
On the weekly, prices are abiding to our ascending trendline. We see the potential for a pullback from our 1st resistance at 1989.322 in line with 50% Fibonacci retracement towards our 1st support at 1904.609 in line with 1904.609 in line with 127.2% Fibonacci Projection. RSI is at levels where dips previously occurred.
On the daily, prices are on bullish momentum. We see the potential for a bounce from our 1st support at 1915.748 in line with 50% Fibonacci retracement towards our 1st resistance at 1972.031 in line with 50% Fibonacci retracement. RSI is at levels where bounces previously occurred, further supporting our bullish bias.
On the H4, prices are on bearish momentum. We see the potential for further bearish continuation from our 1st resistance at 1944.65 in line with 38.2% Fibonacci retracement and 127.2% Fibonacci Projection towards our 1st support at 1909.28 which is a graphical swing low. Ichimoku is on bearish momentum, further supporting our bearish bias.
Areas of consideration:
- 4h 1st support at 1909.28
- 4h 1st resistance at 1944.65
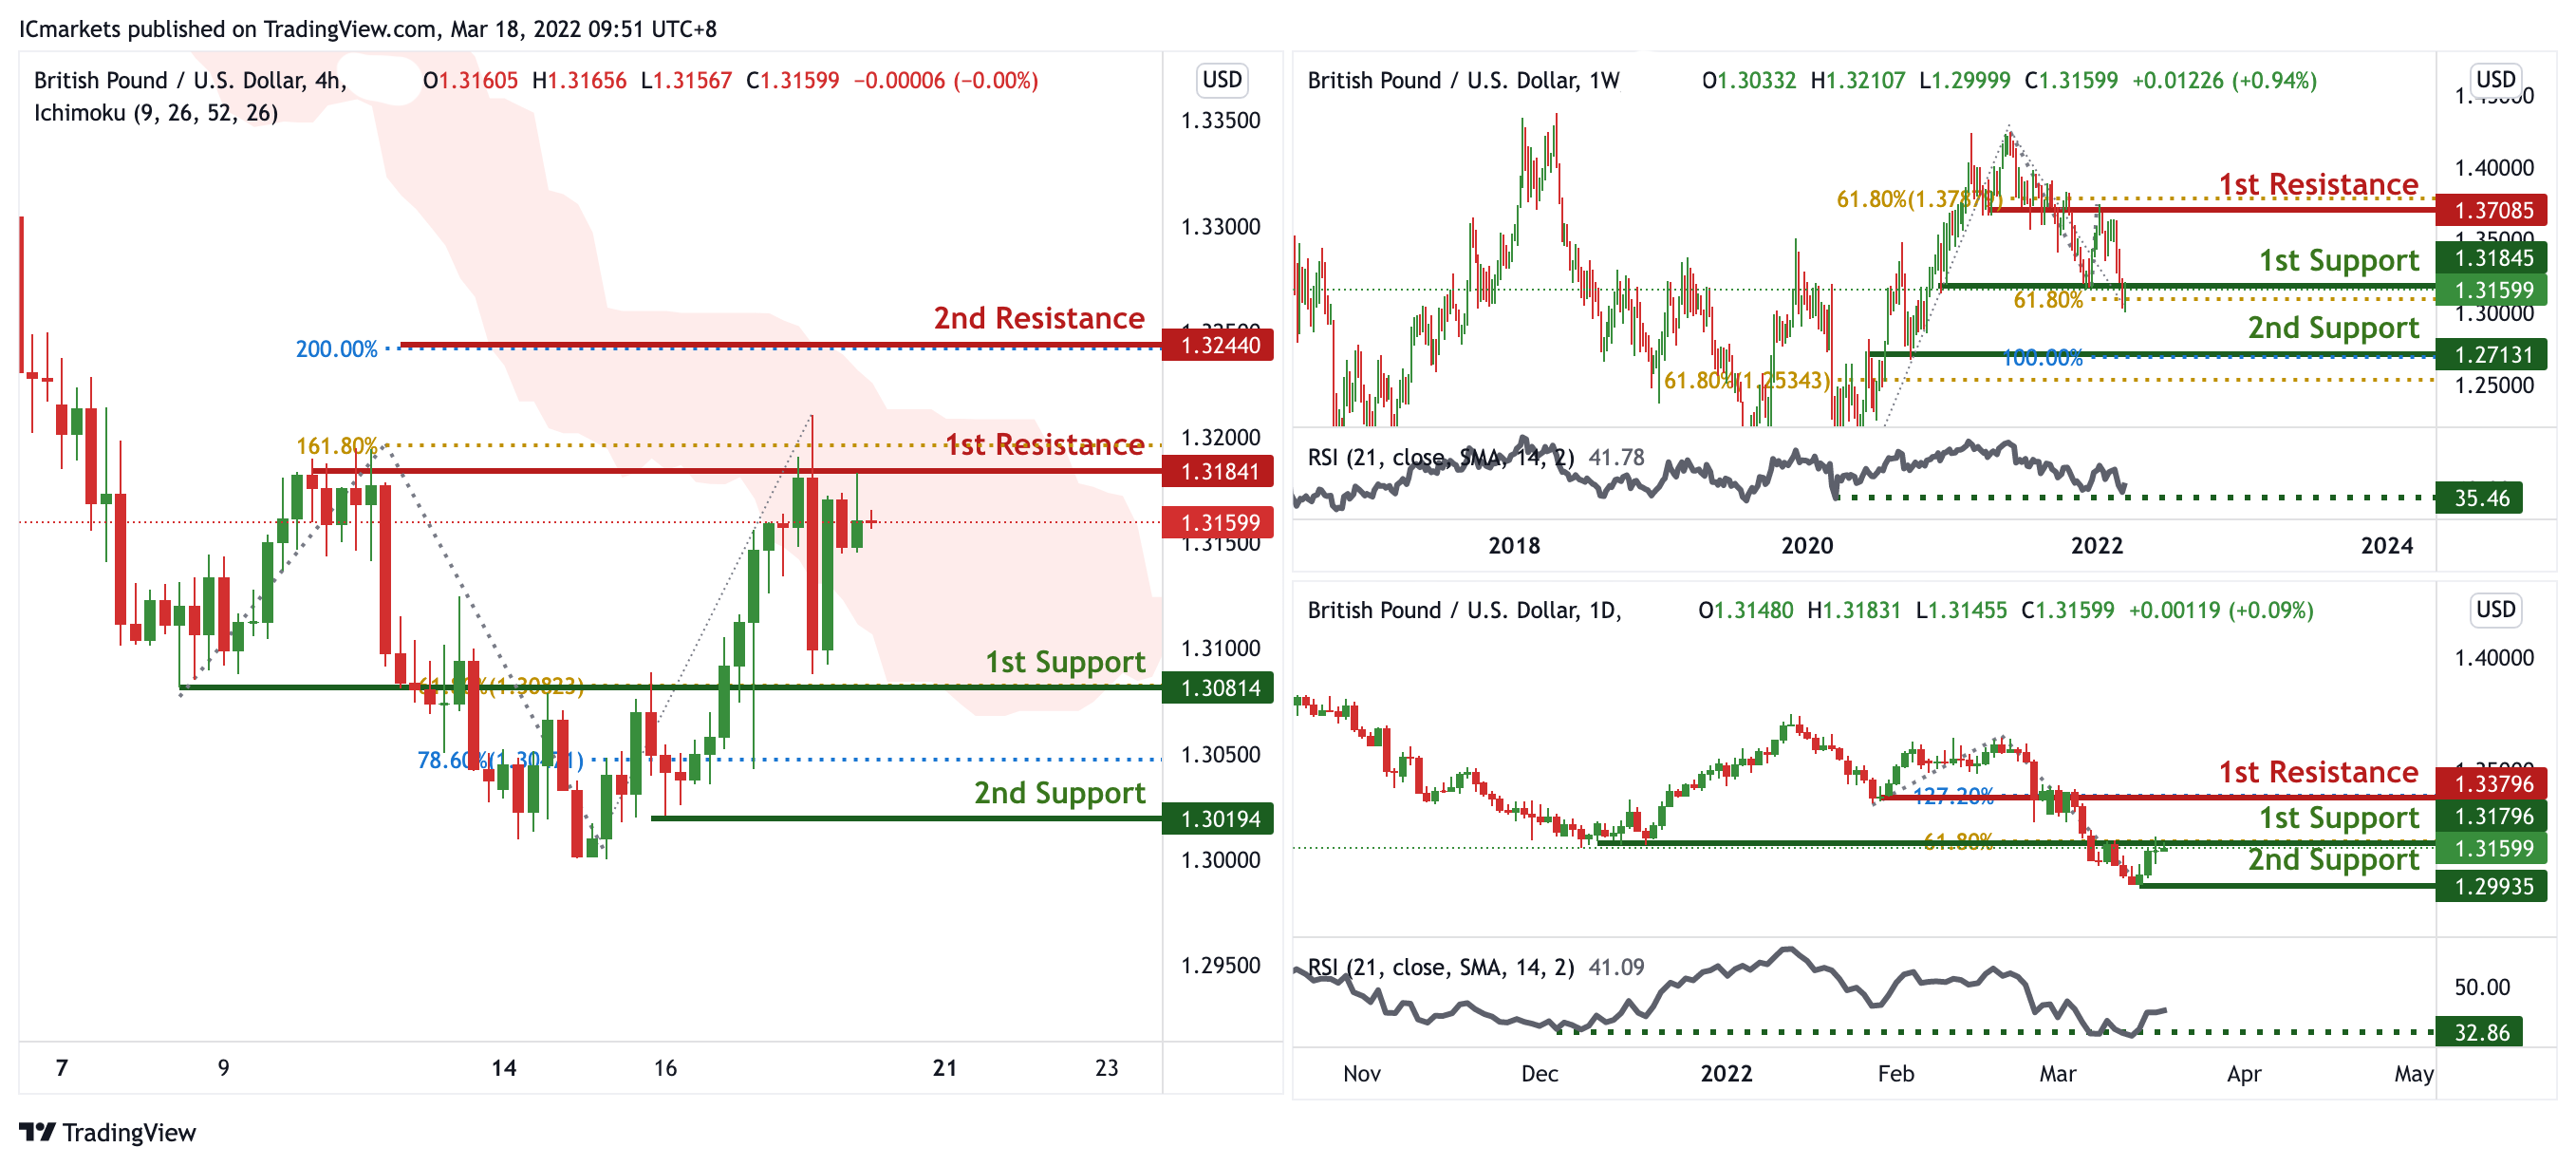
GBP/USD:
On the weekly, prices are approaching a pivot and graphical overlap. We see the potential for a bounce from our 1st support at 1.31845 in line with 61.8% Fibonacci projection towards our 1st resistance at 1.37085 in line with 61.8% Fibonacci retracement. RSI is at levels where bounces previously occurred.
On the daily, prices have recently bounced off a pivot which is a graphical swing low. We see the potential for further bullish continuation from our 1st support at 1.31599 in line with 61.8% Fibonacci Projection towards our 1st resistance at 1.33796 in line with 127.2% Fibonacci Projection. RSI is at levels where bounces previously occurred.
On the H4, prices are at a pivot and graphical overlap. We see the potential for a dip from our 1st resistance at 1.31841 in line with 161.8% Fibonacci Projection towards our 1st support at 1.30814 in line with 61.8% Fibonacci retracement. Prices are trading below our ichimoku cloud resistance, further supporting our bearish bias.
Areas of consideration
- H4 1st resistance at 1.31841
- H4 1st support at 1.30814
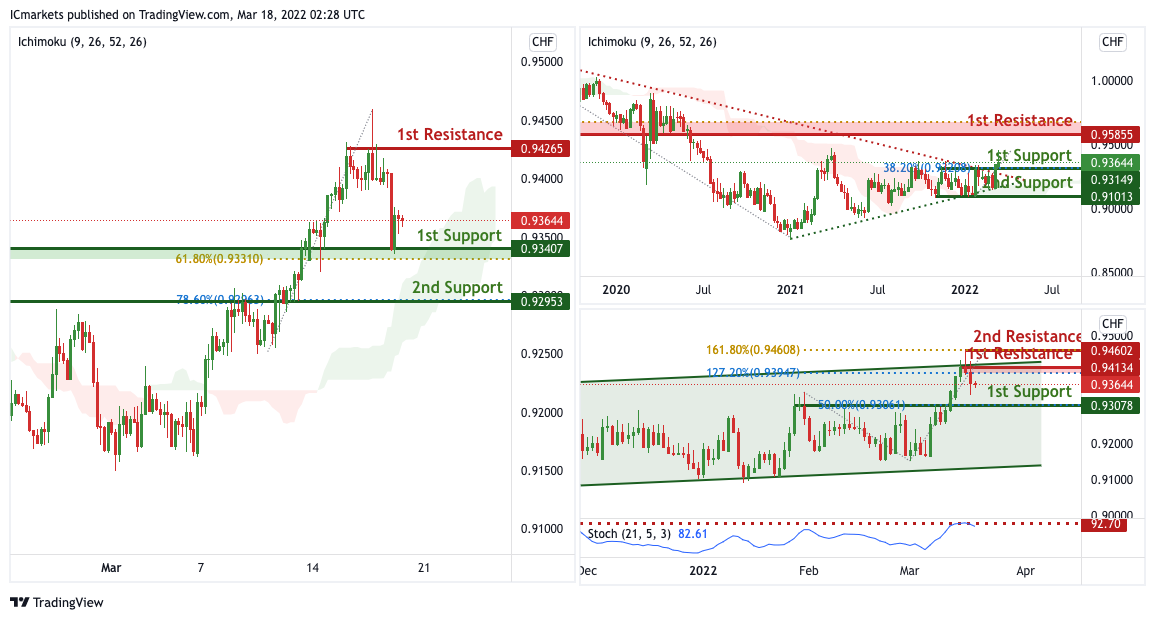
USD/CHF:
On the Weekly, with price moving above the ichimoku cloud, we have a bias that price will rise to our 1st resistance at 0.95855 in line with the 61.8% Fibonacci projection from our 1st support at 0.93149 in line with the horizontal swing low support and 38.2% Fibonacci retracement.Alternatively, price may break 1st support structure and head for 2nd support at 0.91013 in line with the swing low support.
On the Daily, with price expected to reverse off the stochastics indicator and ascending channel resistance, we have a bias that price will drop from 1st resistance at 0.94134 in line with the 127.2% Fibonacci extension to 1st support at 0.93078 in line with 50% Fibonacci retracement .Alternatively, price may break 1st resistance and head for 2nd resistance at 0.94602 in line with the 161.8% Fibonacci extension.
On the H4, with price moving above the ichimoku cloud, we have a bias that price will rise to our 1st resistance at 0.94265 in line with the swing high resistance from our 1st support at 0.93407in line with the horizontal pullback support. Alternatively, price may break 1st support structure and head for 2nd support at 0.92953 in line with the 78.6% Fibonacci retracement
Areas of consideration
- 1st support level 0.93407
- 1st resistance 0.94265
EUR/USD :
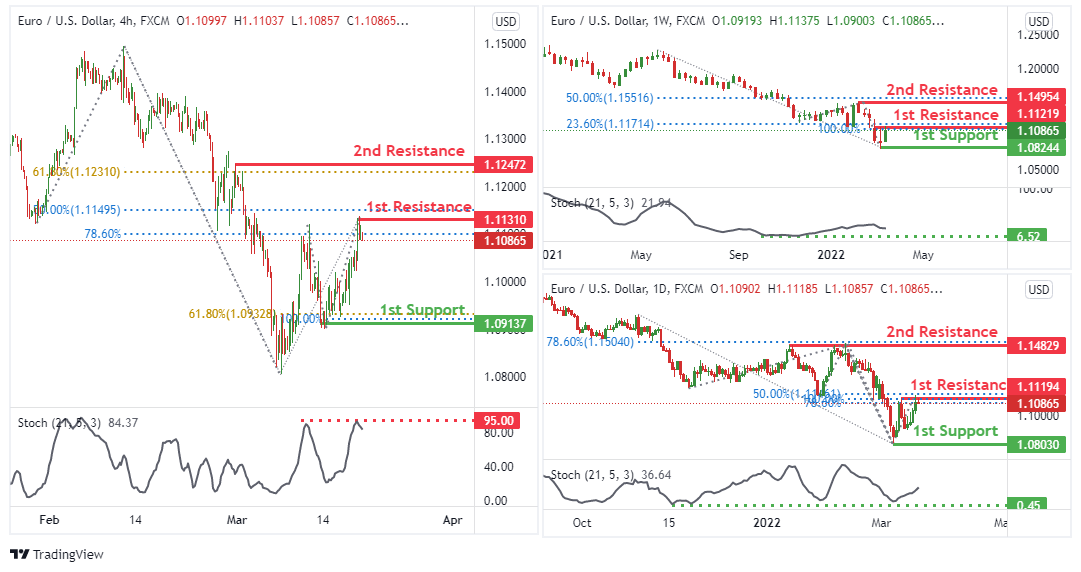
On the weekly, we see the potential bullish continuation from our 1st resistance at 1.11219 in line with 23.6% Fibonacci retracement and 100% Fibonacci projection towards our 2nd resistance at 1.14954 in line with 50% Fibonacci retracement. Our bullish bias is supported by the stochastic indicator where price is trading near the support level.
On the daily, we see the potential bullish continuation from our 1st resistance at 1.11194 in line with 50% Fibonacci retracement and 78.6% Fibonacci projection towards our 2nd resistance at 1.14829 in line with 78.6% Fibonacci retracement. Our bullish bias is supported by the stochastic indicator where price is trading near the support level.
On the H4 price is near 1st resistance level of 1.11310 in line with 78.6% Fibonacci retracement and 100% Fibonacci projection. Price can move towards the 1st support level of 1.09137 which is in line with 61.8% Fibonacci retracement and 100% Fibonacci projection. Our bearish bias is supported by the stochastic indicator as it is near resistance level.
Areas of consideration :
- H4 1st resistance at 1.11310
- H4 1st support at 1.09137
USD/JPY:
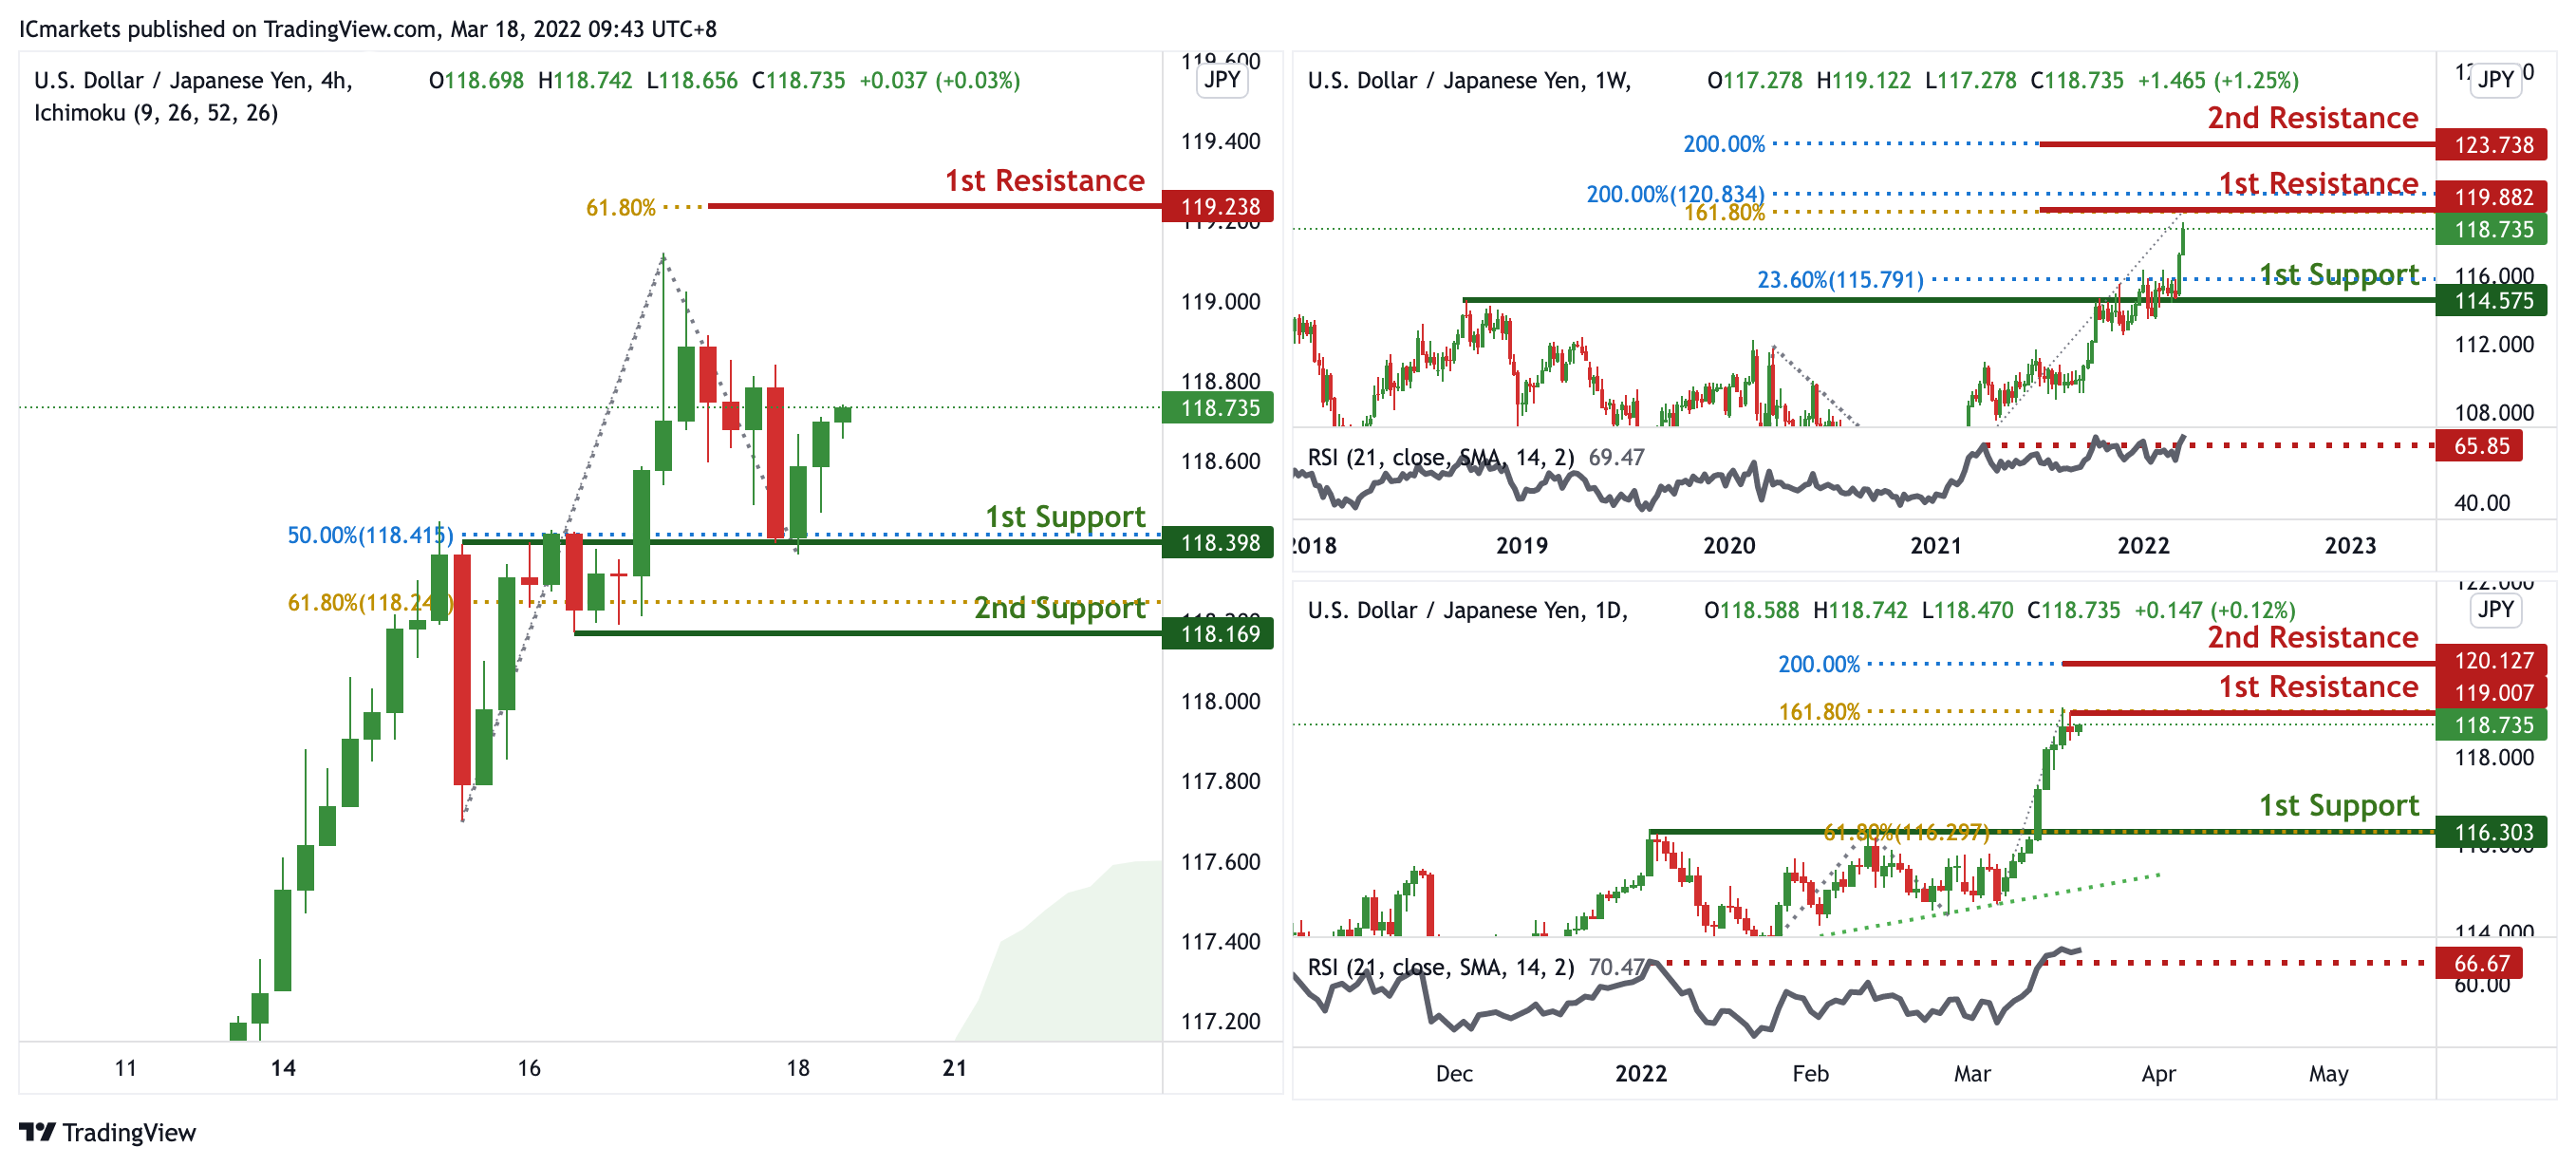
On the weekly, prices are approaching a pivot and graphical resistance. We see the potential for a pullback from oru 1st resistance at 119.882 in line with 200% Fibonacci projection and 161.8% Fibonacci Projection towards our 1st support at 114.575 in line with 23.6% Fibonacci retracement and graphical overlap. RSI is at levels where dips previously occurred.
On the daily, prices are abiding to an ascending trendline. We see the potential for a dip from our 1st resistance at 119.007 in line with 161.8% Fibonacci Projection towards our 1st support at 116.303 in line with 61.8% FIbonacci retracement. RSI is at levels where dips previously occurred, further supporting our bearish bias.
On the H4 timeframe, prices are on bullish momentum. We see the potential for a further bullish continuation from our 1st support at 118.398 in line with 50% Fibonacci retracement towards our 1st resistance at 119.238 in line with 61.8% Fibonacci expansion. Prices are trading above our ichimoku cloud support, further supporting our bullish bias.
Areas of consideration:
- H4 time frame, 1st resistance at 119.238
- H4 time frame, 1st support at 118.398
AUD/USD:
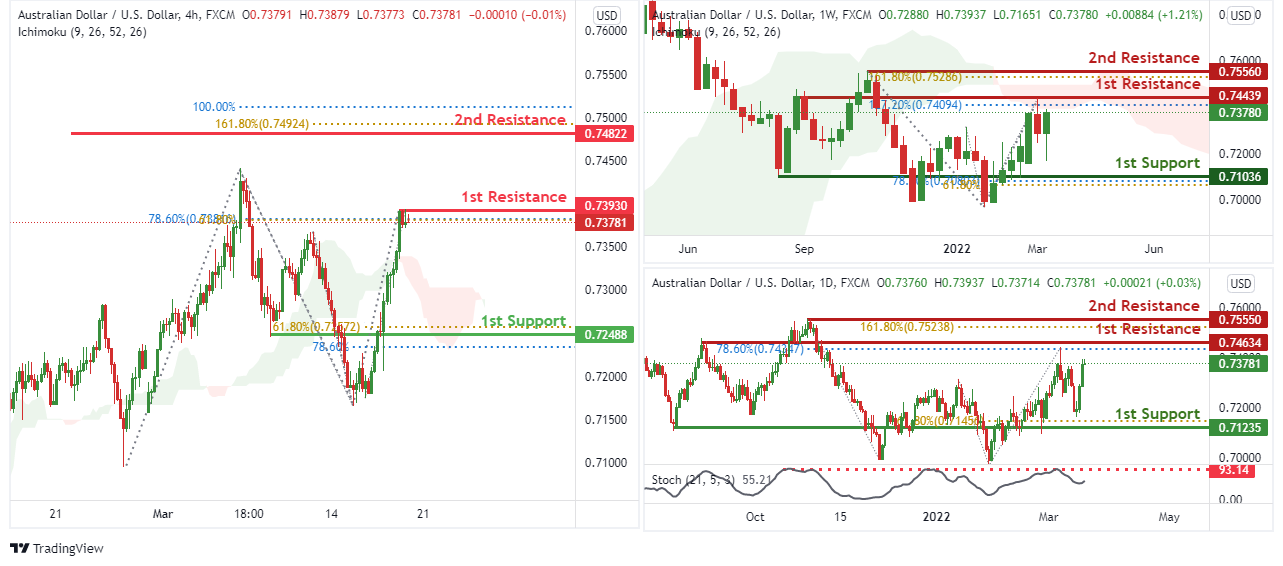
On the weekly, we see the potential bearish continuation from our 1st resistance at 0.74439 in line with 100% Fibonacci projection towards our 1st support at 0.71036 in line with 78.6% Fibonacci retracement and 61.8% Fibonacci projection. Our bearish bias is supported by the price trading below the Ichimoku cloud indicator.
On the daily, we see the potential bearish reversal from our 1st resistance at 0.74634 in line with 78.6% Fibonacci retracement towards our 1st support at 0.71235 in line with 61.8% Fibonacci retracement. Our bearish bias is supported by the stochastic indicator where price is trading near the resistance level.
On the H4 price is near 1st resistance level of 0.73930 in line with 78.6% Fibonacci retracement and 61.8% Fibonacci projection. Price can move towards the 1st support level of 0.72488 which is in line with 61.8% Fibonacci retracement and 78.6% Fibonacci projection.Our bearish bias is supported by the price trading below the Ichimoku cloud indicator.
Areas of consideration
- H4 1st resistance at 0.73930
- H4 1st support at 0.72488
NZD/USD:
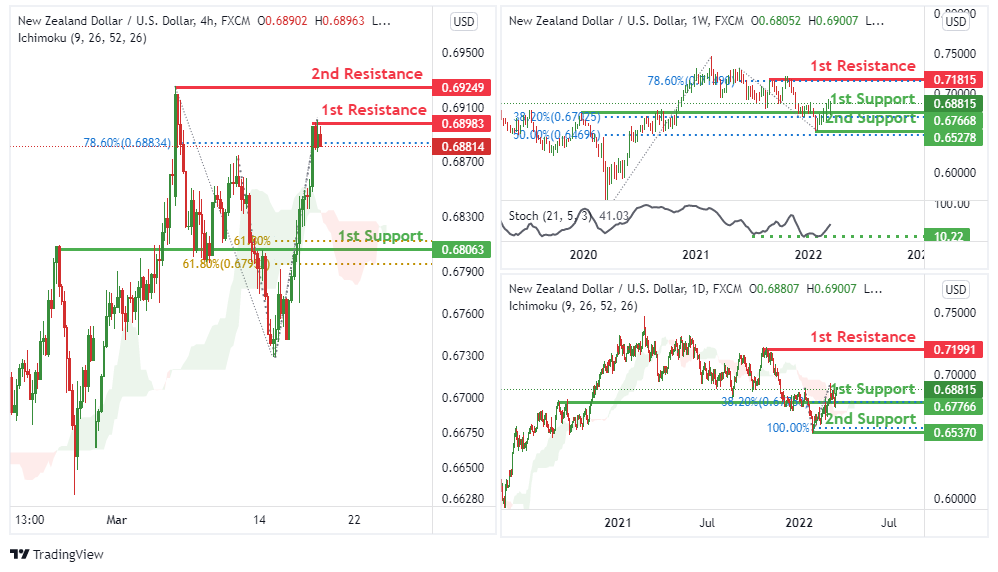
On the weekly, we see the potential bullish continuation from our 1st support at 0.68821 in line with 38.2% Fibonacci retracement towards our 1st resistance at 0.71815 in line with 78.6% Fibonacci retracement. Our bullish bias is supported by the stochastic indicator where price is trading near support level.
On the daily, we see the potential bullish continuation from our 1st support at 0.67766 in line with 38.2% Fibonacci retracement towards our 1st resistance at 0.71991 in line with a graphical swing high resistance. Our bullish bias is supported by price trading above the Ichimoku cloud indicator.
On the H4 price is near 1st resistance level of 0.68983 in line with 78.6% Fibonacci retracement. Price can move towards the 1st support level of 0.68063 which is in line with 61.8% Fibonacci retracement and 61.8% Fibonacci projection.Our bearish bias is supported by the price trading below the Ichimoku cloud indicator.
Areas of consideration :
- H4 1st resistance at 0.68983
- H4 1st support at 0.68063
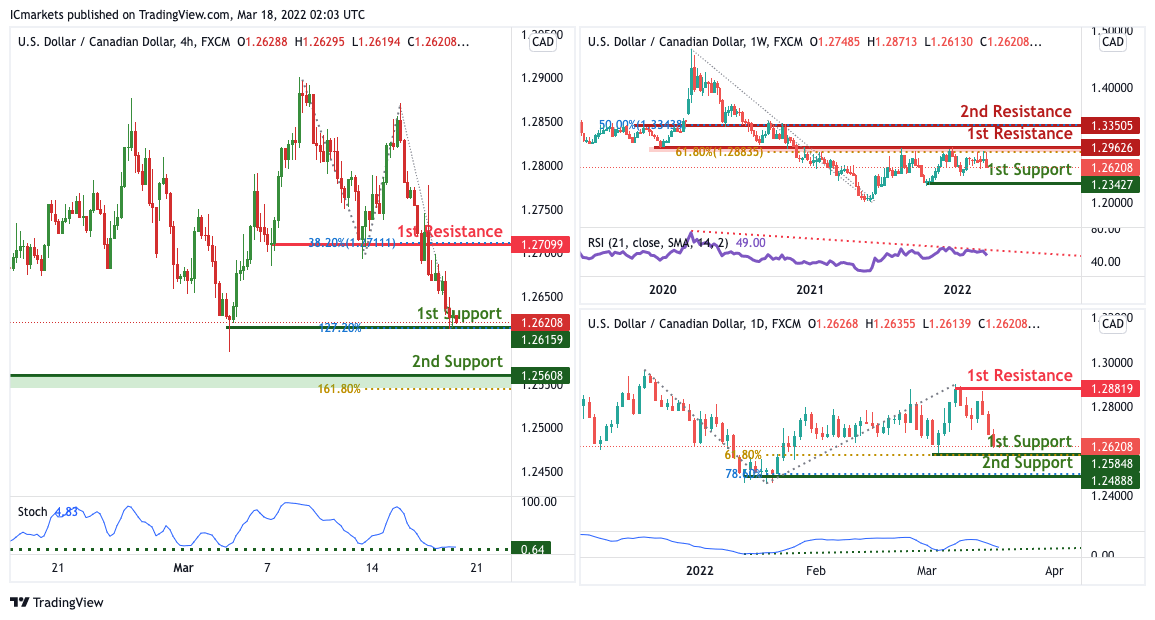
USD/CAD:
On the Weekly, with price expected to reverse off the RSI, we have a bias that price will drop from 1st resistance at 1.29626 in line with the horizontal overlap resistance to 1st support at 90.8 in line with the swing low support .Alternatively, price may break 1st resistance and head for 2nd resistance at 1.33505 in line with the 50% Fibonacci retracement.
On the Daily, with price expected to bounce off the stochastics indicator, we have a bias that price will rise to our 1st resistance at 1.28819 in line with the 61.8% Fibonacci projection from our 1st support at 1.25848 in line with the 61.8% Fibonacci retracement.Alternatively, price may break 1st support structure and head for 2nd support at 1.24888 in line with the 78.6% Fibonacci retracement.
On the H4, with price expected to bounce off the stochastics indicator, we have a bias that price will rise to our 1st resistance at 1.27099 in line with the 38.2% Fibonacci retracement from our 1st support at 1.26159 in line with the 127.2% Fibonacci extension.Alternatively, price may break 1st support structure and head for 2nd support at 1.25608 in line with the 161.8% Fibonacci projection.
Areas of consideration:
- H4 time frame, 1st support at 1.26159
- H4 time frame, 1st resistance at 1.27099
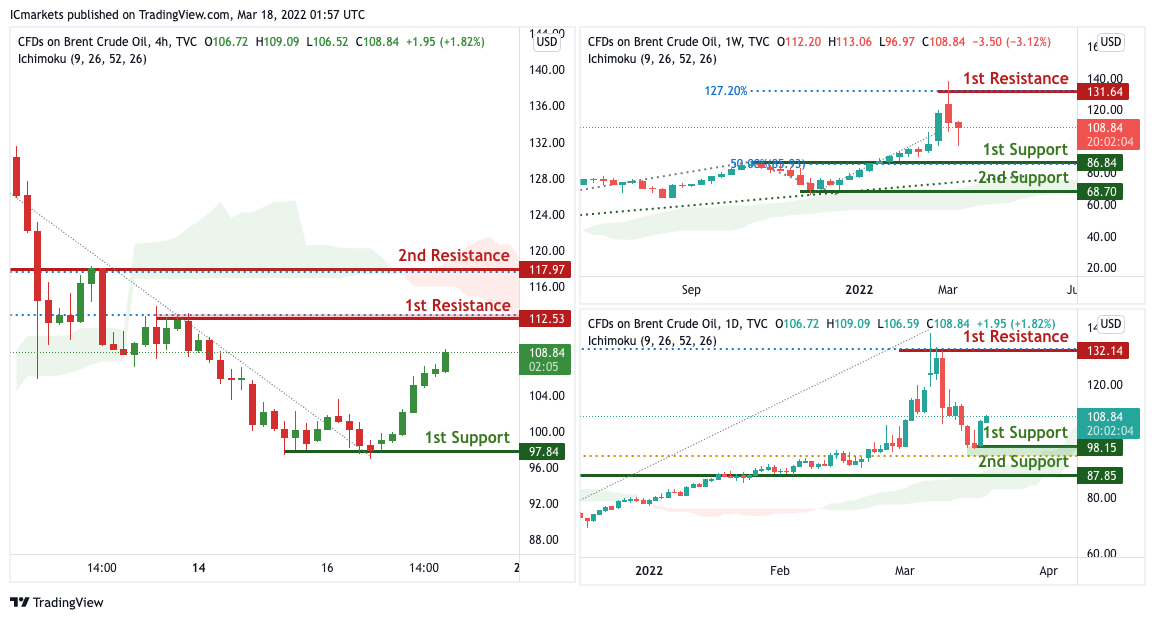
OIL:
On the Weekly, with price moving above our ichimoku cloud, we have a bias that price will rise to our 1st resistance at 131.64 from our 1st support at 86.84 in line with the horizontal swing low support and 50% Fibonacci projection.Alternatively, price may break 1st support structure and head for 2nd support at 68.70.
On the Daily, with price expected to reverse off the stochastics indicator, we have a bias that price will rise to our 1st resistance at 132.14 in line with the swing high resistance from our 1st support at 98.15 in line with the horizontal swing low support and 61.8% Fibonacci retracement.Alternatively, price may break 1st support structure and head for 2nd support at 68.70.
On the H4, with price moving below the ichimoku cloud, we have a bias that price will drop from 1st resistance at 112.53 in line with the horizontal overlap resistance to 1st support at 97.84 in line with the swing low support .Alternatively, price may break 1st resistance and head for 2nd resistance at 117.97.
Areas of consideration:
- H4 time frame, 1st resistance of 112.53
- H4 time frame, 1st support of 97.84
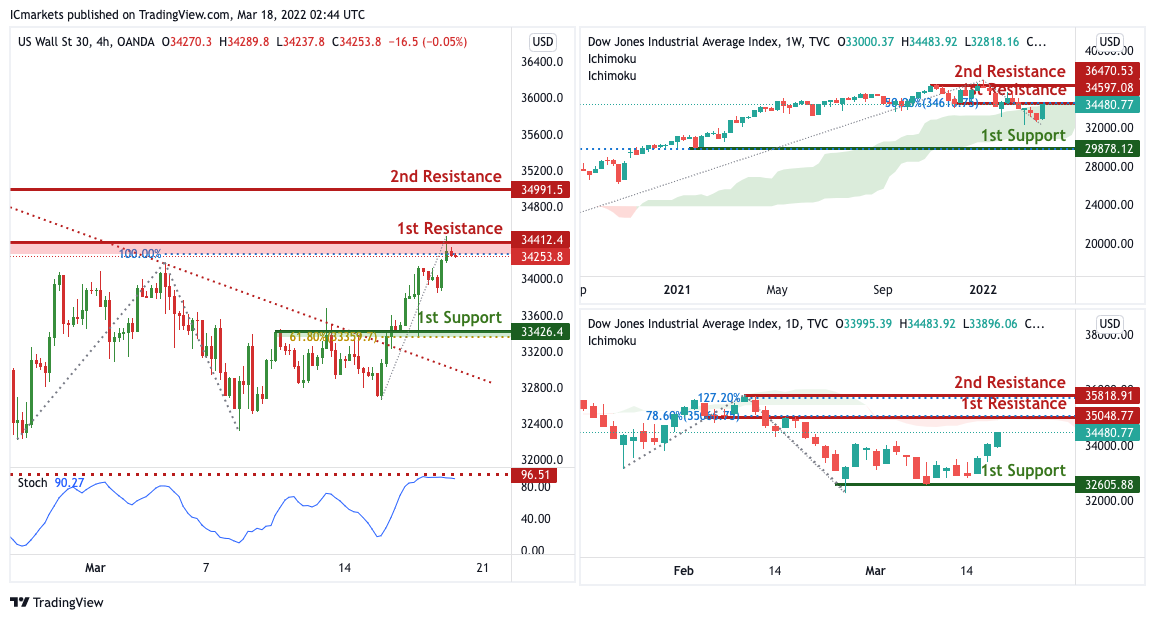
Dow Jones Industrial Average:
On the H4, with price expected to reverse off the resistance of the ichimoku cloud, we have a bias that price will drop from 1st resistance at 34597 in line with the horizontal overlap resistance to 1st support at 29878 in line with the swing low support .Alternatively, price may break 1st resistance and head for 2nd resistance at 36470 in line with the swing high resistance.
On the H4, with price moving below the ichimoku cloud, we have a bias that price will drop from 1st resistance at 35048 in line with the horizontal overlap resistance to 1st support at 32605 in line with the swing low support .Alternatively, price may break 1st resistance and head for 2nd resistance at 35818 in line with the swing high resistance.
On the H4, with price expected to reverse off the stochastics indicator, we have a bias that price will drop from 1st resistance at 34412 in line with the horizontal swing high resistance to 1st support at 33426 in line with the overlap support .Alternatively, price may break 1st resistance and head for 2nd resistance at 34991 in line with the swing high resistance.
Areas of consideration :
- H4 1st support at 33426
- H4 1st resistance at 34412
The accuracy, completeness and timeliness of the information contained on this site cannot be guaranteed. IC Markets does not warranty, guarantee or make any representations, or assume any liability regarding financial results based on the use of the information in the site.
News, views, opinions, recommendations and other information obtained from sources outside of www.icmarkets.com.au, used in this site are believed to be reliable, but we cannot guarantee their accuracy or completeness. All such information is subject to change at any time without notice. IC Markets assumes no responsibility for the content of any linked site.
The fact that such links may exist does not indicate approval or endorsement of any material contained on any linked site. IC Markets is not liable for any harm caused by the transmission, through accessing the services or information on this site, of a computer virus, or other computer code or programming device that might be used to access, delete, damage, disable, disrupt or otherwise impede in any manner, the operation of the site or of any user’s software, hardware, data or property.


