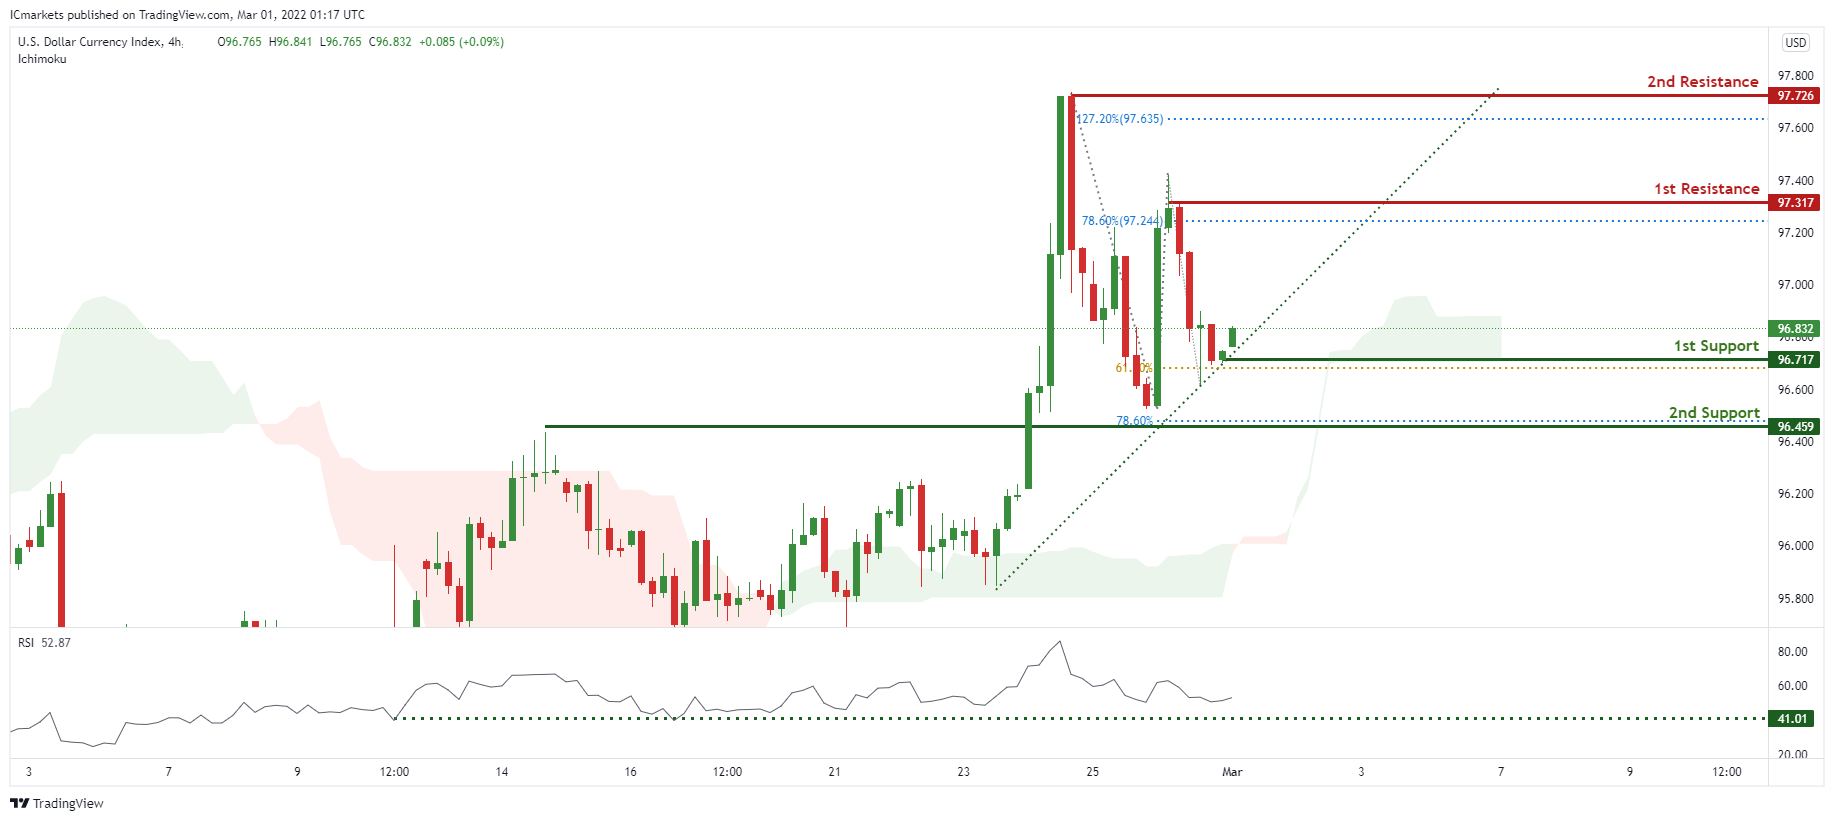
DXY:
On the H4 timeframe, prices are on bullish momentum and abiding to a new ascending trendline. We see the potential for bullish bounce from our 1st support at 96.717 in line with 61.8% Fibonacci extension towards our 1st resistance at 97.317 in line with 78.6% Fibonacci extension. RSI is at a level where bounces occurred previously and also ichimoku is forecasting green clouds, further supporting our bullish bias.
Areas of consideration:
- H4 time frame, 1st resistance at 97.317
- H4 time frame, 1st support at 96.717
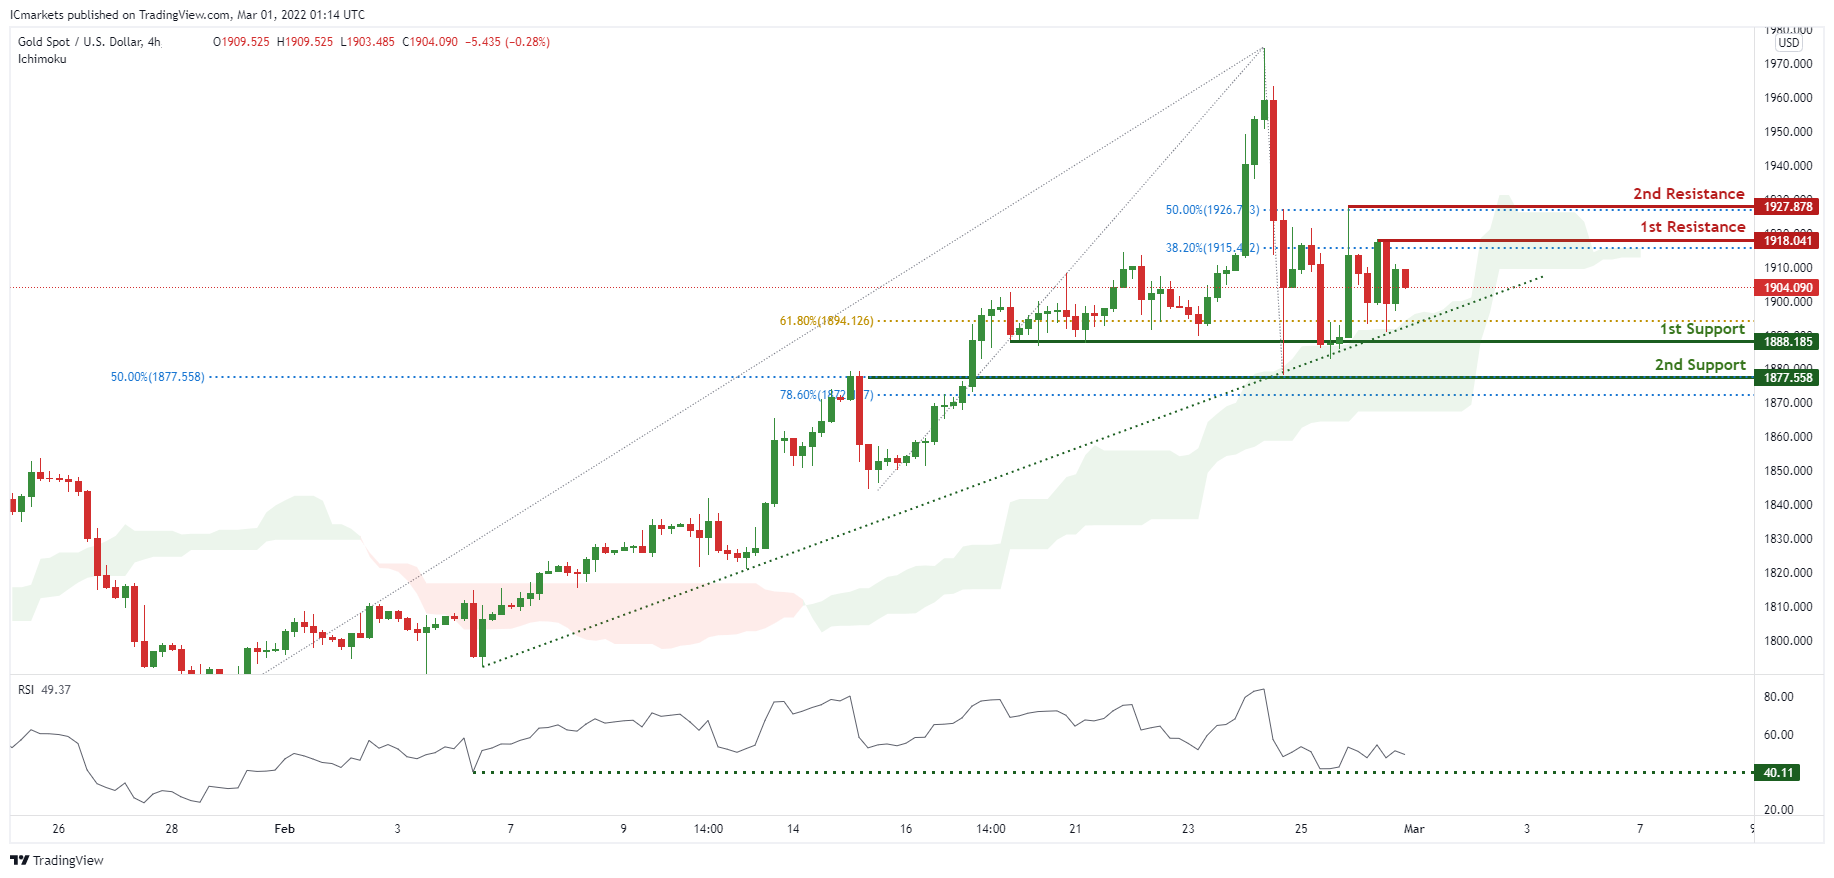
XAU/USD (GOLD):
On the H4 chart, prices areon bullish momentum and abiding to our ascending trendline support. We see potential for further bullish continuation from our 1st support at 1888.185 in line with 61.8% Fibonacci extension towards our 1st resistance at 1918.041 in line with38.2% Fibonacci retracement. Our bbullish bias is further supported by RSI depicting bearish momentum and prices trading above our ichimoku clouds.
Areas of consideration:
- 4h 1st support at 1888.185
- 4h 1st resistance at 1918.041
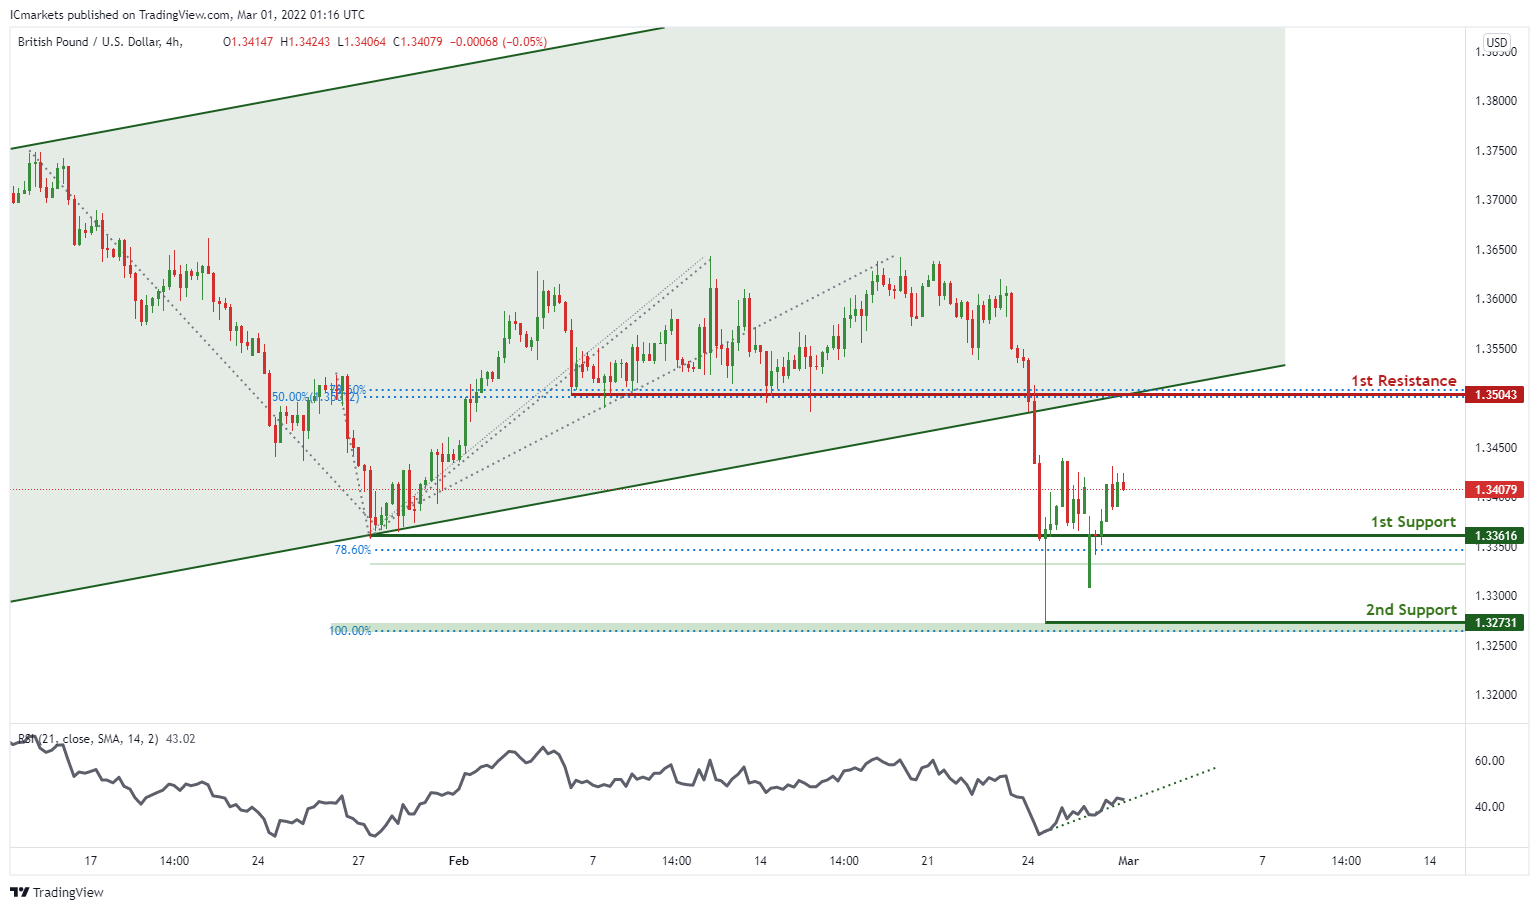
GBP/USD
On the H4 chart , price has recently broken out of the ascending channel and is near 1st support level of 1.33561 in line with 78.6% Fibonacci projection. Price can potentially bounce from this level to 1st resistance level of 1.35043 in line with 50% Fibonacci retracement and 78.6% Fibonacci projection. Our bullish bias is supported by the stochastic indicator as it is at support level
Areas of consideration
- H4 1st resistance at 1.35043
- H4 1st support at 1.33561
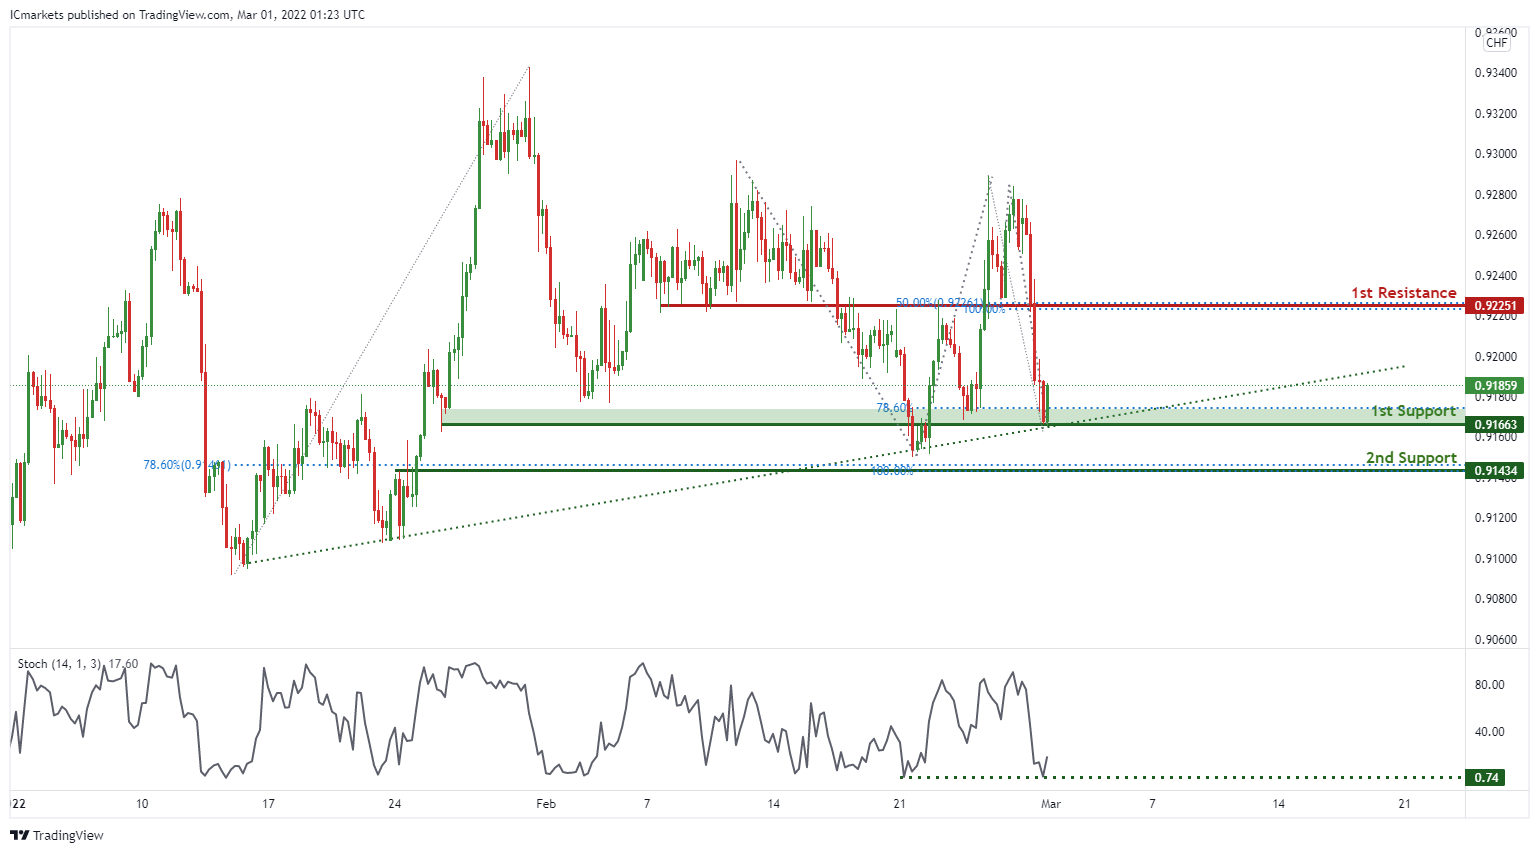
USD/CHF:
On the H4, price is abiding by an ascending trendline and near 1st support level of 0.91663 in line with 78.% Fibonacci projection. Price can potentially bounce to the 1st resistance level of 0.92251 in line with 50% Fibonacci retracement and 100% Fibonacci projection. Our bullish bias is supported by the stochastic indicator as it is at support level.
Areas of consideration
- 1st support level at 0.91663
- 1st resistance level at 0.92251
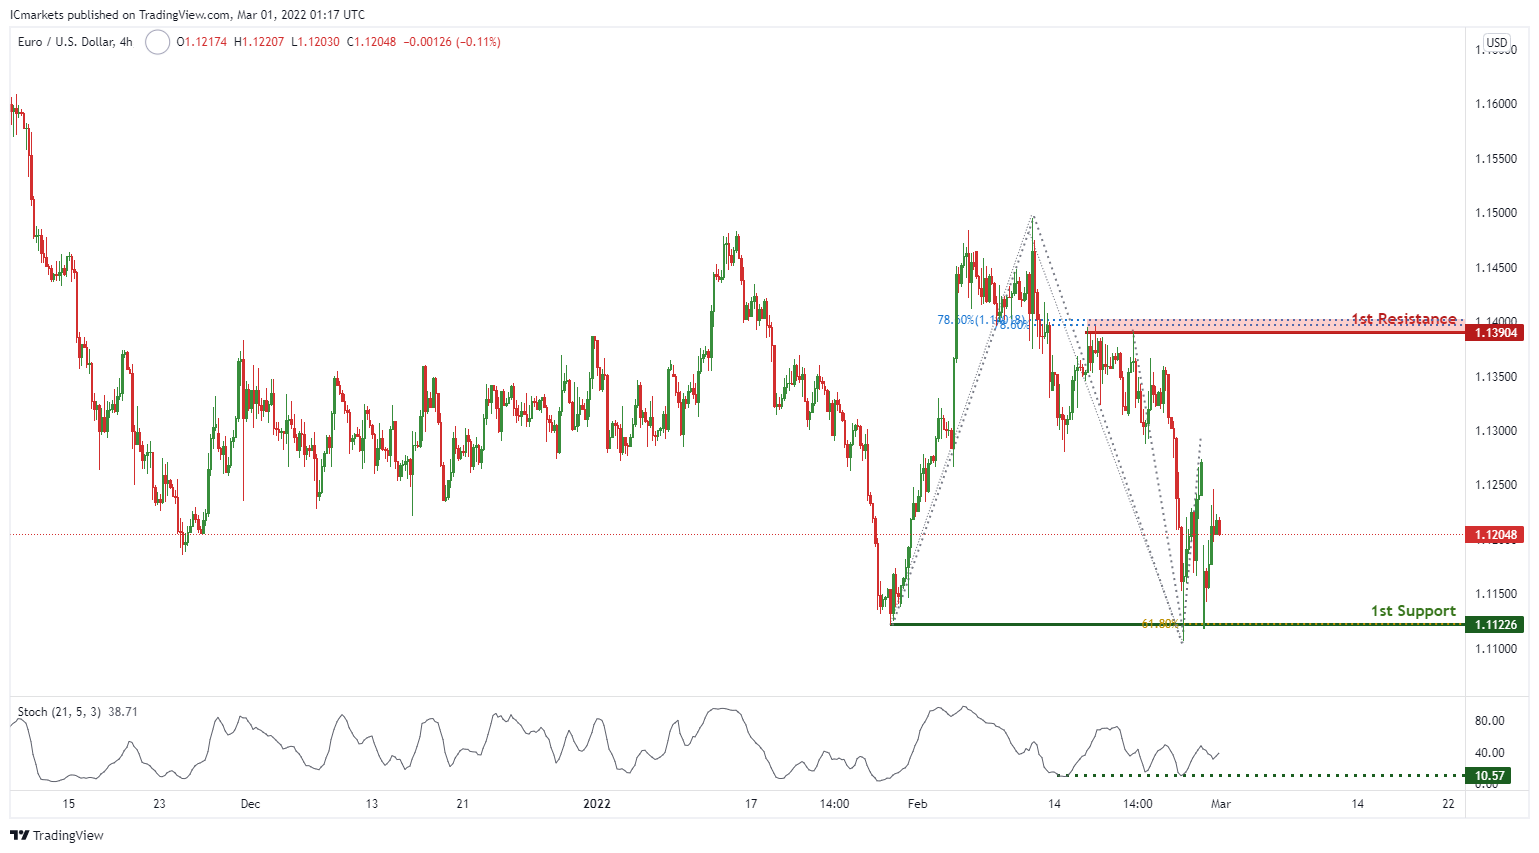
EUR/USD :
On the H4 chart price is near 1st support level of 1.11226 in line with 61.8% Fibonacci projection. Price can potentially go to the 1st resistance level of 1.13904 in line with 78.6% Fibonacci retracement and 78.6% Fibonacci projection. Our bullish bias is supported by the stochastic indicator as it is near support level.
Areas of consideration :
- H4 1st support at 1.11226
- H4 1st resistance at 1.13904
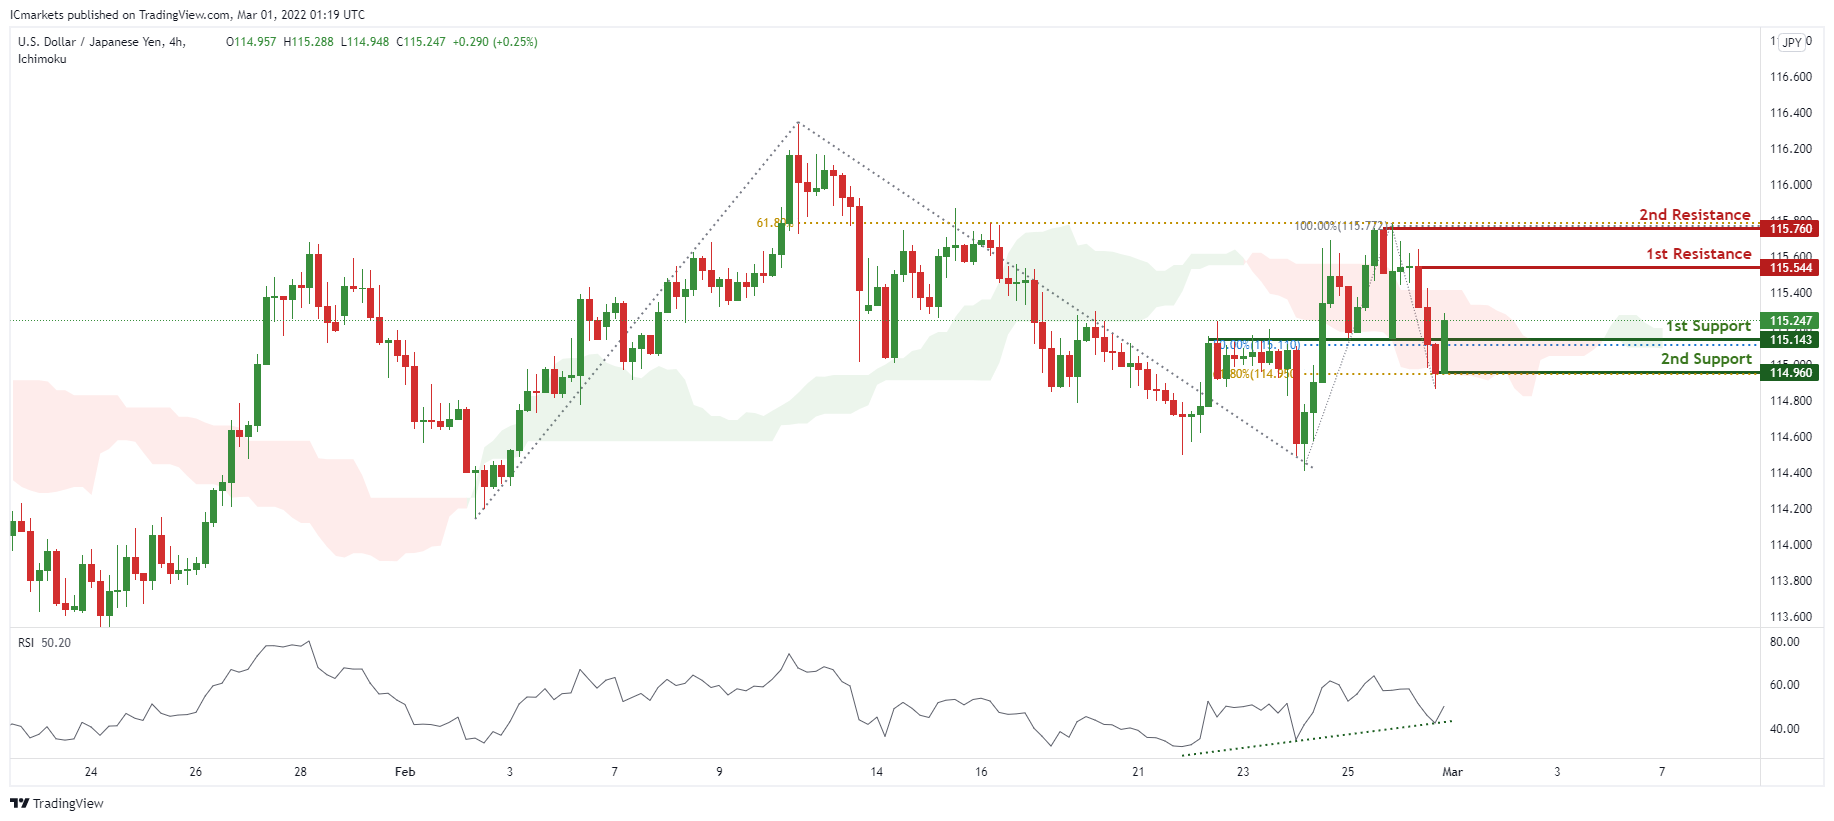
USD/JPY
On the H4 timeframe, prices have recently bounced off a strong graphical overlap and also 1st support. We see the potential for further bullish continuation from our 1st support at 115.143 in line with 50% Fibonacci retracement towards our 1st resistance at 115.544 which is a recent swing high. Our bullish bias is further supported by ichimoku forecasting green clouds and RSI showing bullish momentum.
Areas of consideration:
- H4 time frame, 1st resistance at 115.544
- H4 time frame, 1st support at 115.143
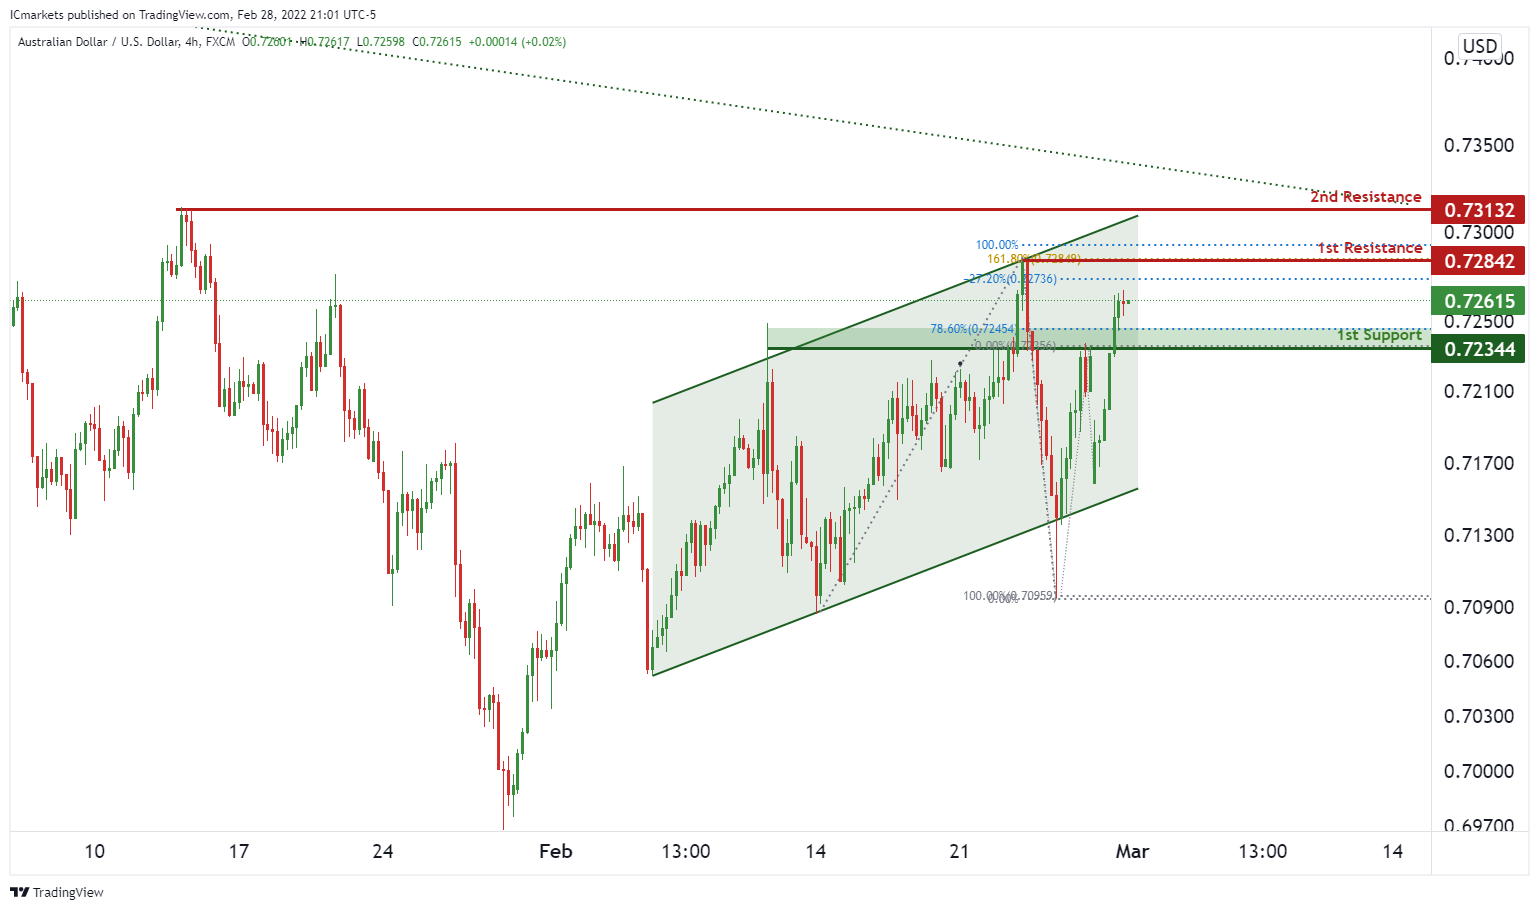
AUD/USD:
On the H4 chart, prices are moving along the ascending channel. We see potential for a bullish continuation from our 1st support at 0.72344 in line with 78.6% Fibonacci retracement and towards our 1st resistance at 0.72842 in line with Fibonacci confluence (100% Fibonacci projection, 161.8% Fibonacci extension, -27.2% expansion).
Areas of consideration :
-H4 1st support at 0.72344
-H4 1st resistance at 0.72842
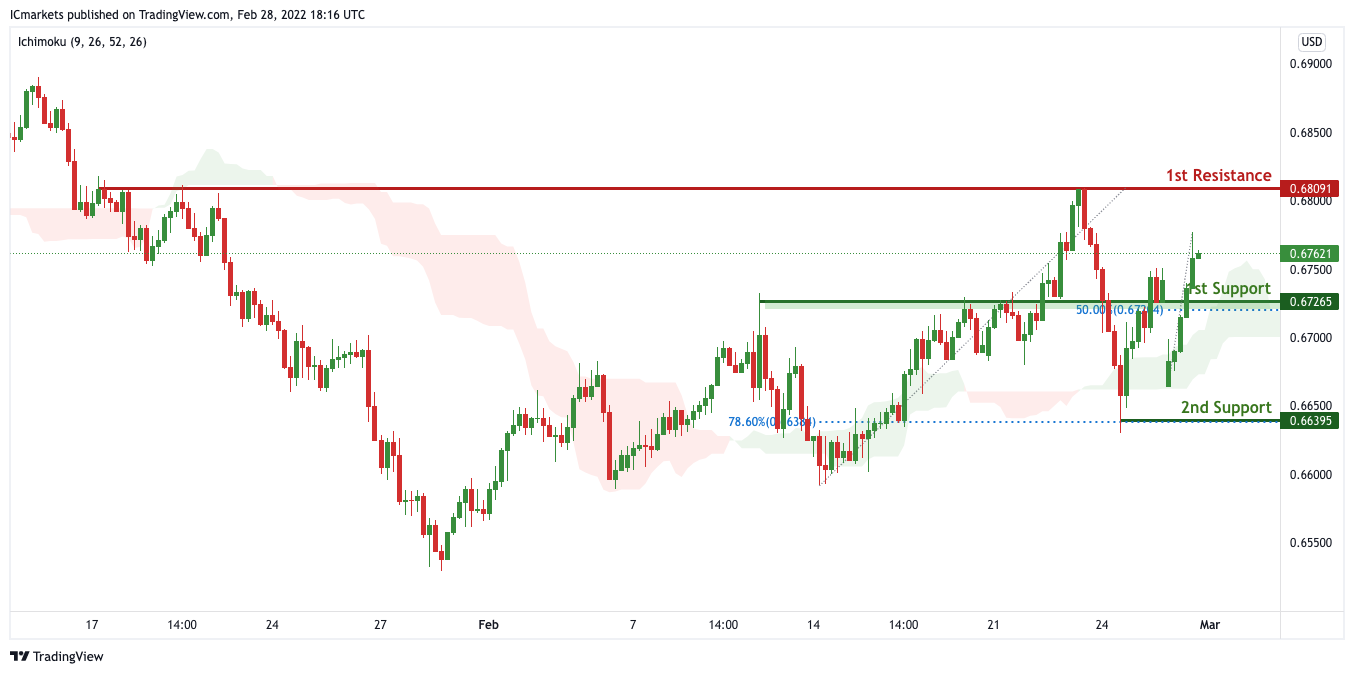
NZD/USD:
On the H4 chart, price is near 1st support level of 0.67265 in line with horizontal overlap support. Price can potentially rise to the 1st resistance level of 0.68091 in line with the horizontal swing high resistance. Alternatively, price may break 1st support and head for 2nd support at 0.66395. Our bullsh bias is supported by how price is expected to bounce off the support of the ichimoku cloud.
Areas of consideration:
H4 time frame, 1st resistance at 0.68091
H4 time frame, 1st support at 0.67265
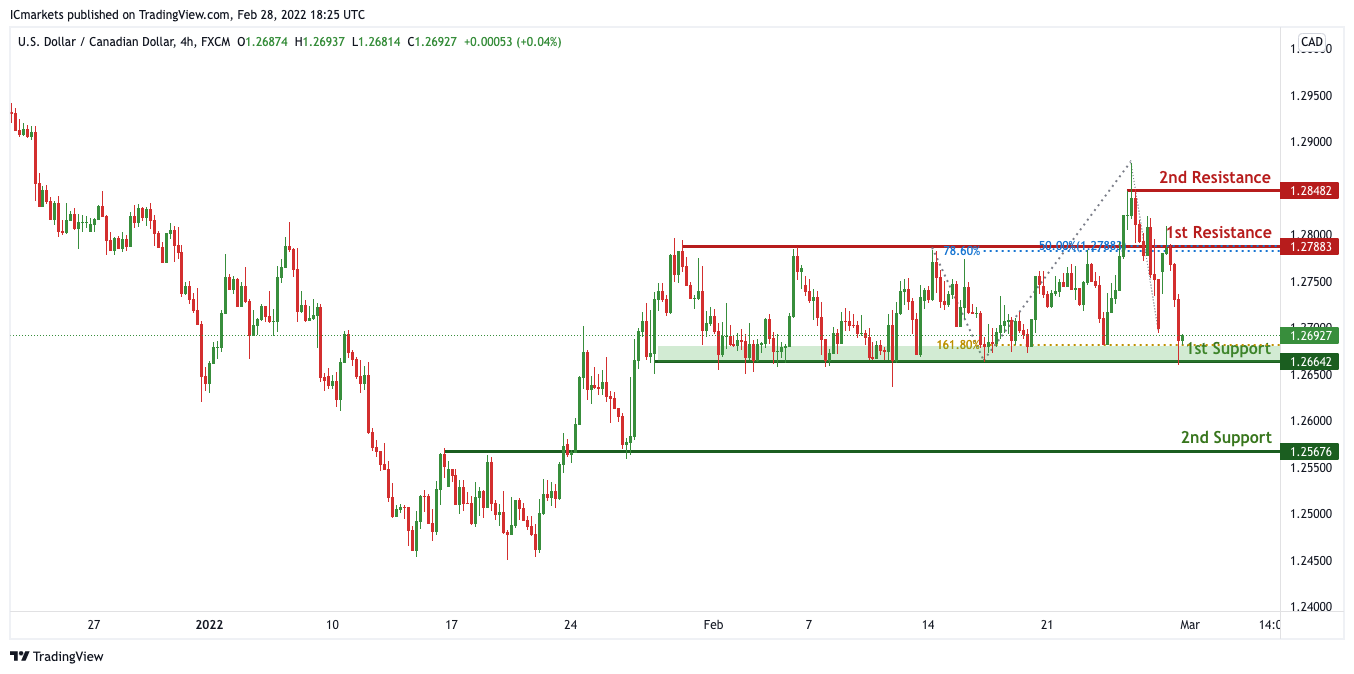
USD/CAD:
On the H4, price is ranging in between our 1st support and 1st resistance. We can expect price to rise from our 1st support at 1.26642 in line with 161.8% Fibonacci extension to our 1st resistance at 1.27883 which is a strong resistance and in line with 50% and 78.6% Fibonacci retracement. Alternatively, price may break 1st support structure and head for 2nd support.
Areas of consideration:
- H4 time frame, 1st support at 1.26642
- H4 time frame, 1st resistance at 1.27883
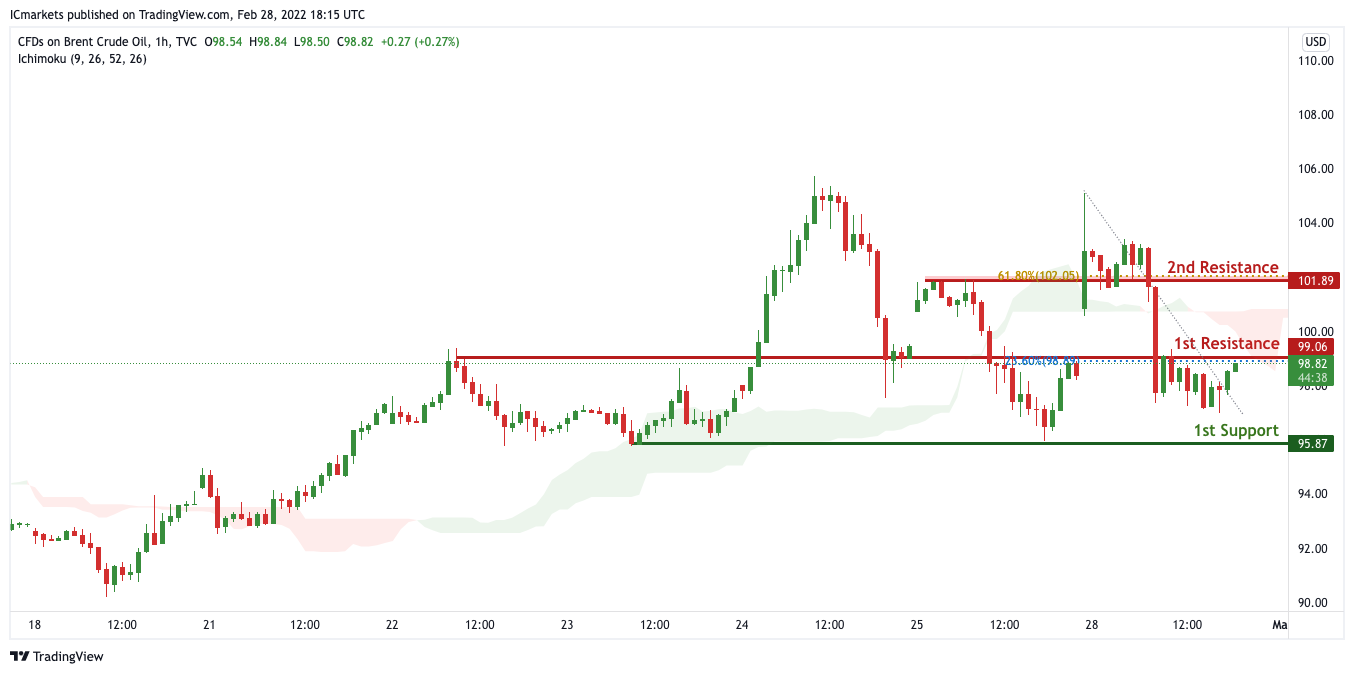
OIL:
On the H4 timeframe, We see the possibility of bearish continuation from our 1st resistance at 99.06 in line with horizontal overlap resistance and 23.6% Fibonacci retracement towards our 1st support at 95.87 in line with the horizontal swing low support. Alternatively, price may break 1st resistance and head for 2nd resistance at 101.89 in line with the 61.8% Fibonacci retracement level. Our bearish bias is further supported by how price is moving below the ichimoku cloud
Areas of consideration:
- H4 time frame, 1st resistance of 99.06
- H4 time frame, 1st support of 95.87
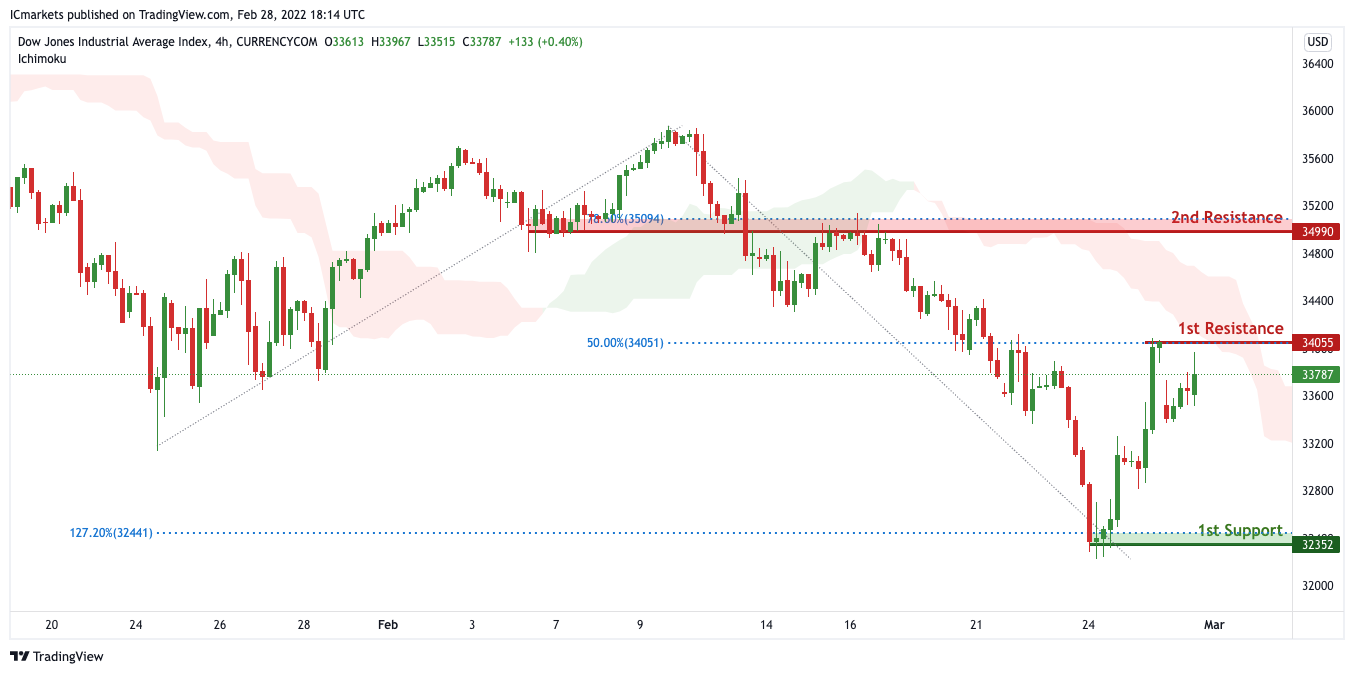
Dow Jones Industrial Average:
On the H4 timeframe, We see the possibility of bearish continuation from our 1st resistance at 34055 in line with horizontal overlap resistance towards our 1st support at 32352 in line with the horizontal swing low support. Alternatively, price may break 1st resistance and head for 2nd resistance at 34990 in line with the 78.6% Fibonacci retracement level. Our bearish bias is further supported by how price is moving below the ichimoku cloud
Areas of consideration :
- H4 1st support at 32352
- H4 1st resistance at 34055
The accuracy, completeness and timeliness of the information contained on this site cannot be guaranteed. IC Markets does not warranty, guarantee or make any representations, or assume any liability regarding financial results based on the use of the information in the site.
News, views, opinions, recommendations and other information obtained from sources outside of www.icmarkets.com.au, used in this site are believed to be reliable, but we cannot guarantee their accuracy or completeness. All such information is subject to change at any time without notice. IC Markets assumes no responsibility for the content of any linked site.
The fact that such links may exist does not indicate approval or endorsement of any material contained on any linked site. IC Markets is not liable for any harm caused by the transmission, through accessing the services or information on this site, of a computer virus, or other computer code or programming device that might be used to access, delete, damage, disable, disrupt or otherwise impede in any manner, the operation of the site or of any user’s software, hardware, data or property.


