DXY:
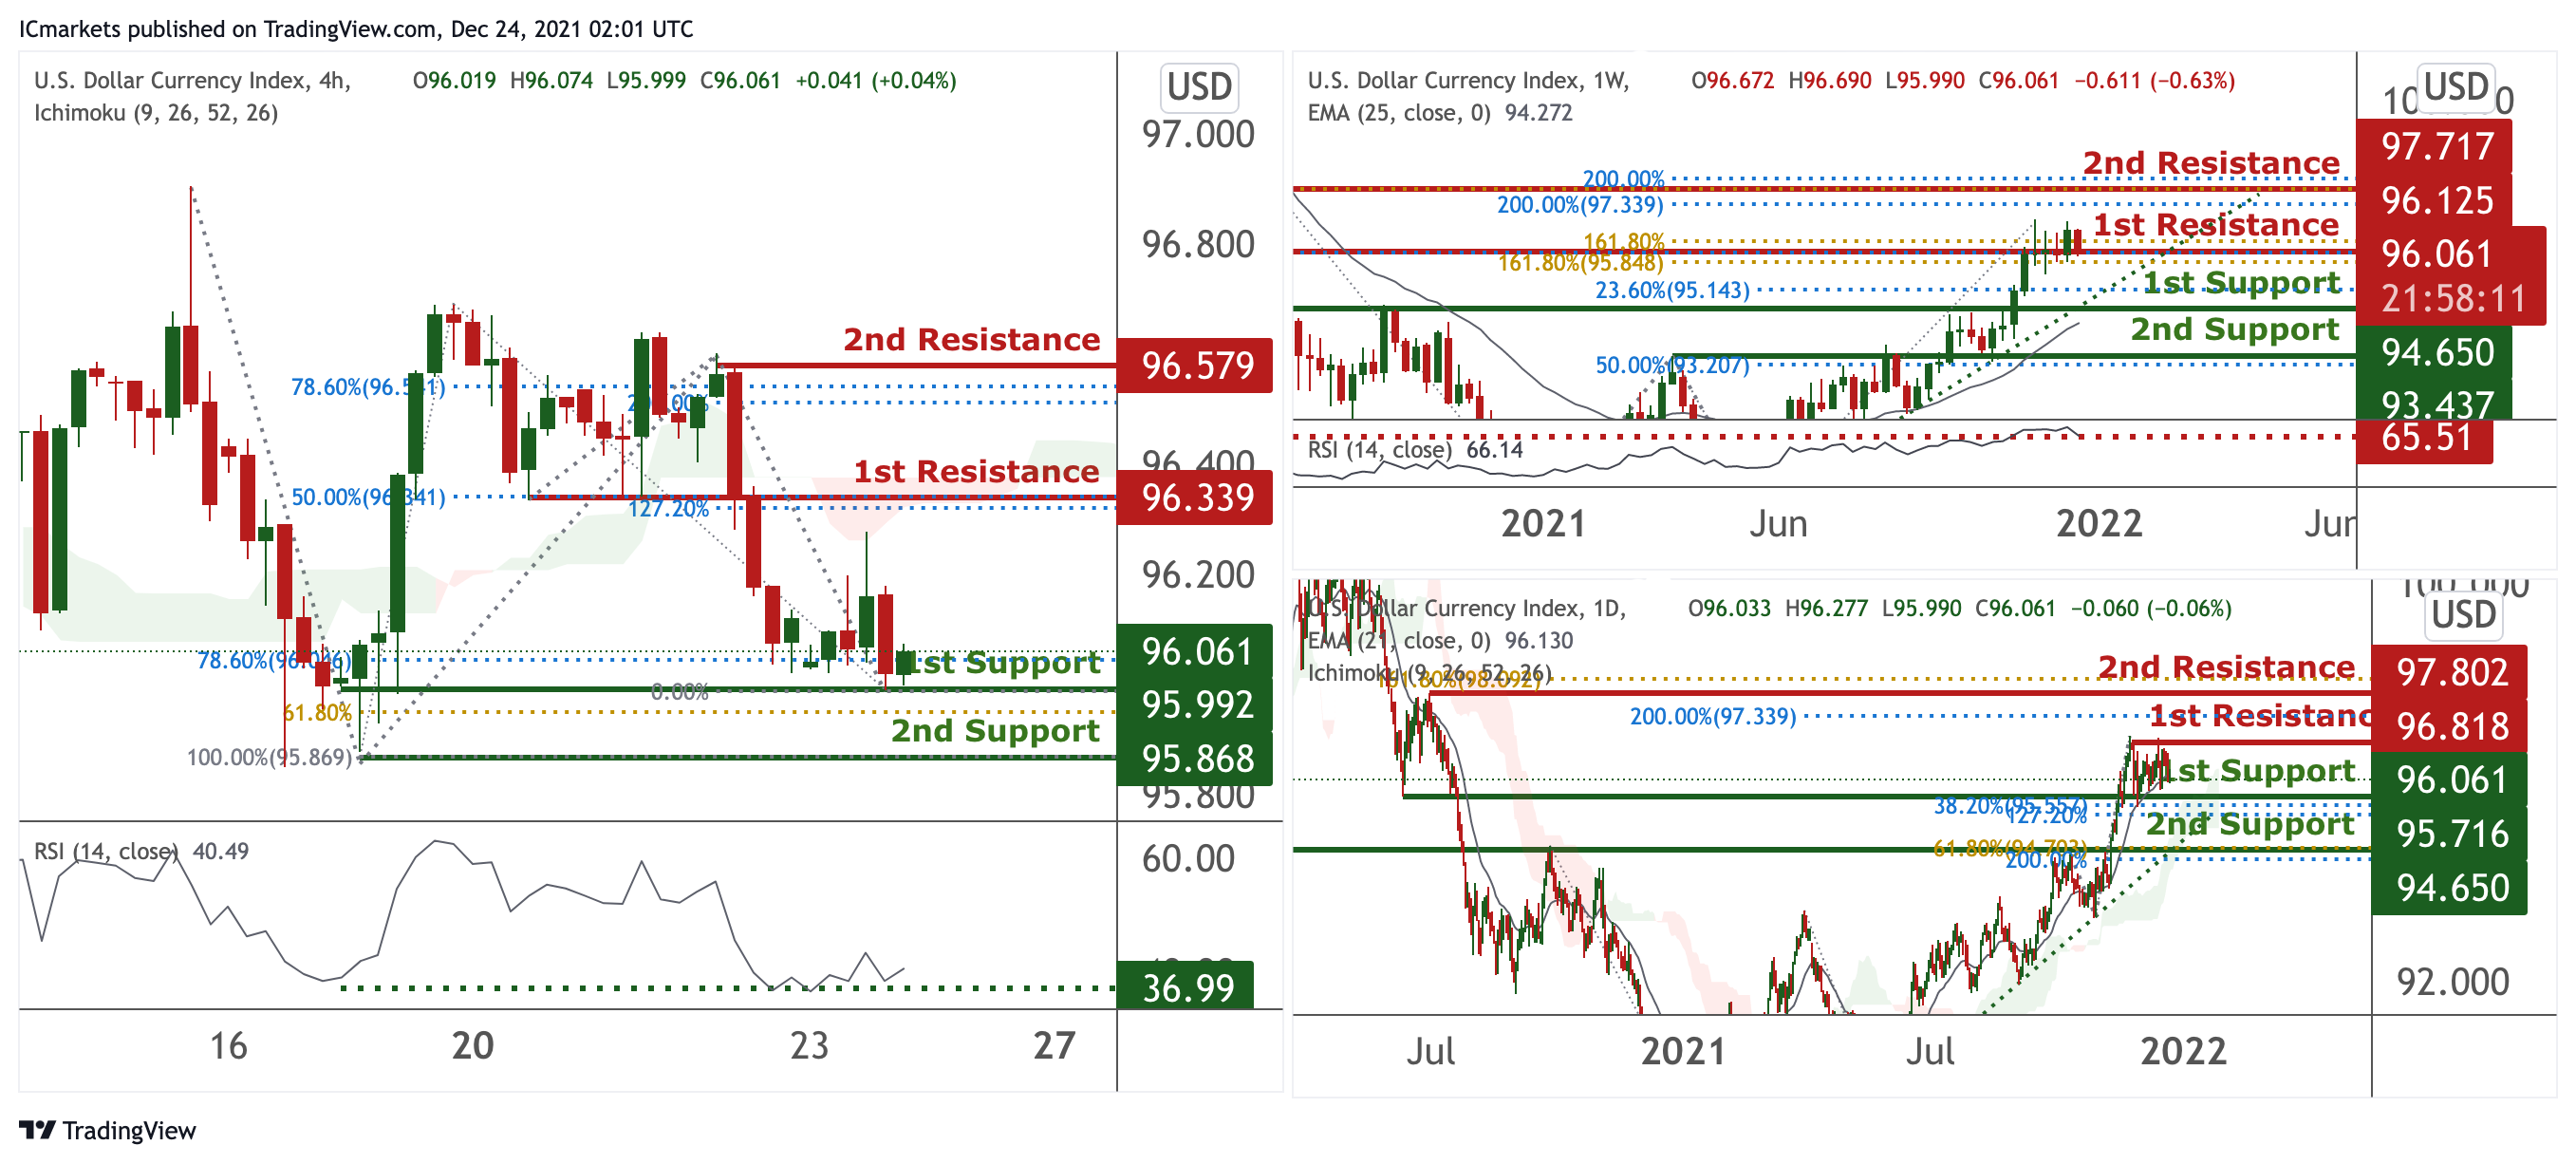
On the weekly, prices are on bullish momentum and abiding to our ascending trendline. We see potential for prices to dip from our 1st resistance at 96.125 in line with 161.8% Fibonacci extension and 161.8% Fibonacci retracement towards our 1st support at 94.650 in line with 23.6% Fibonacci retracement. RSI is at a level where dips previously occurred.
On the daily, prices are on a bullish momentum and abiding to a bullish trendline. We see potential for prices to bounce from our 1st support at 95.716 in line with 38.2% Fibonacci retracement and 127.2% Fibonacci extension towards our 1st resistance at 96.818 in line with 200% Fibonacci projection. Our EMA 21 and ichimoku clouds are showing bullish momentum.
On the H4 timeframe, prices have reached a pivot which is a graphical swing low. We would expect a bounce from our 1st support at 95.992 in line with 78.6% Fibonacci retracement towards our 1st resistance at 96.339 in line with 127.2% Fibonacci extension and 50% Fibonacci retracement. RSI is at a level where bounces previously occurred and also ichimoku clouds are showing bullish momentum.
Areas of consideration:
- H4 time frame, 1st resistance at 96.339
- H4 time frame, 1st support at 95.992
XAU/USD (GOLD):
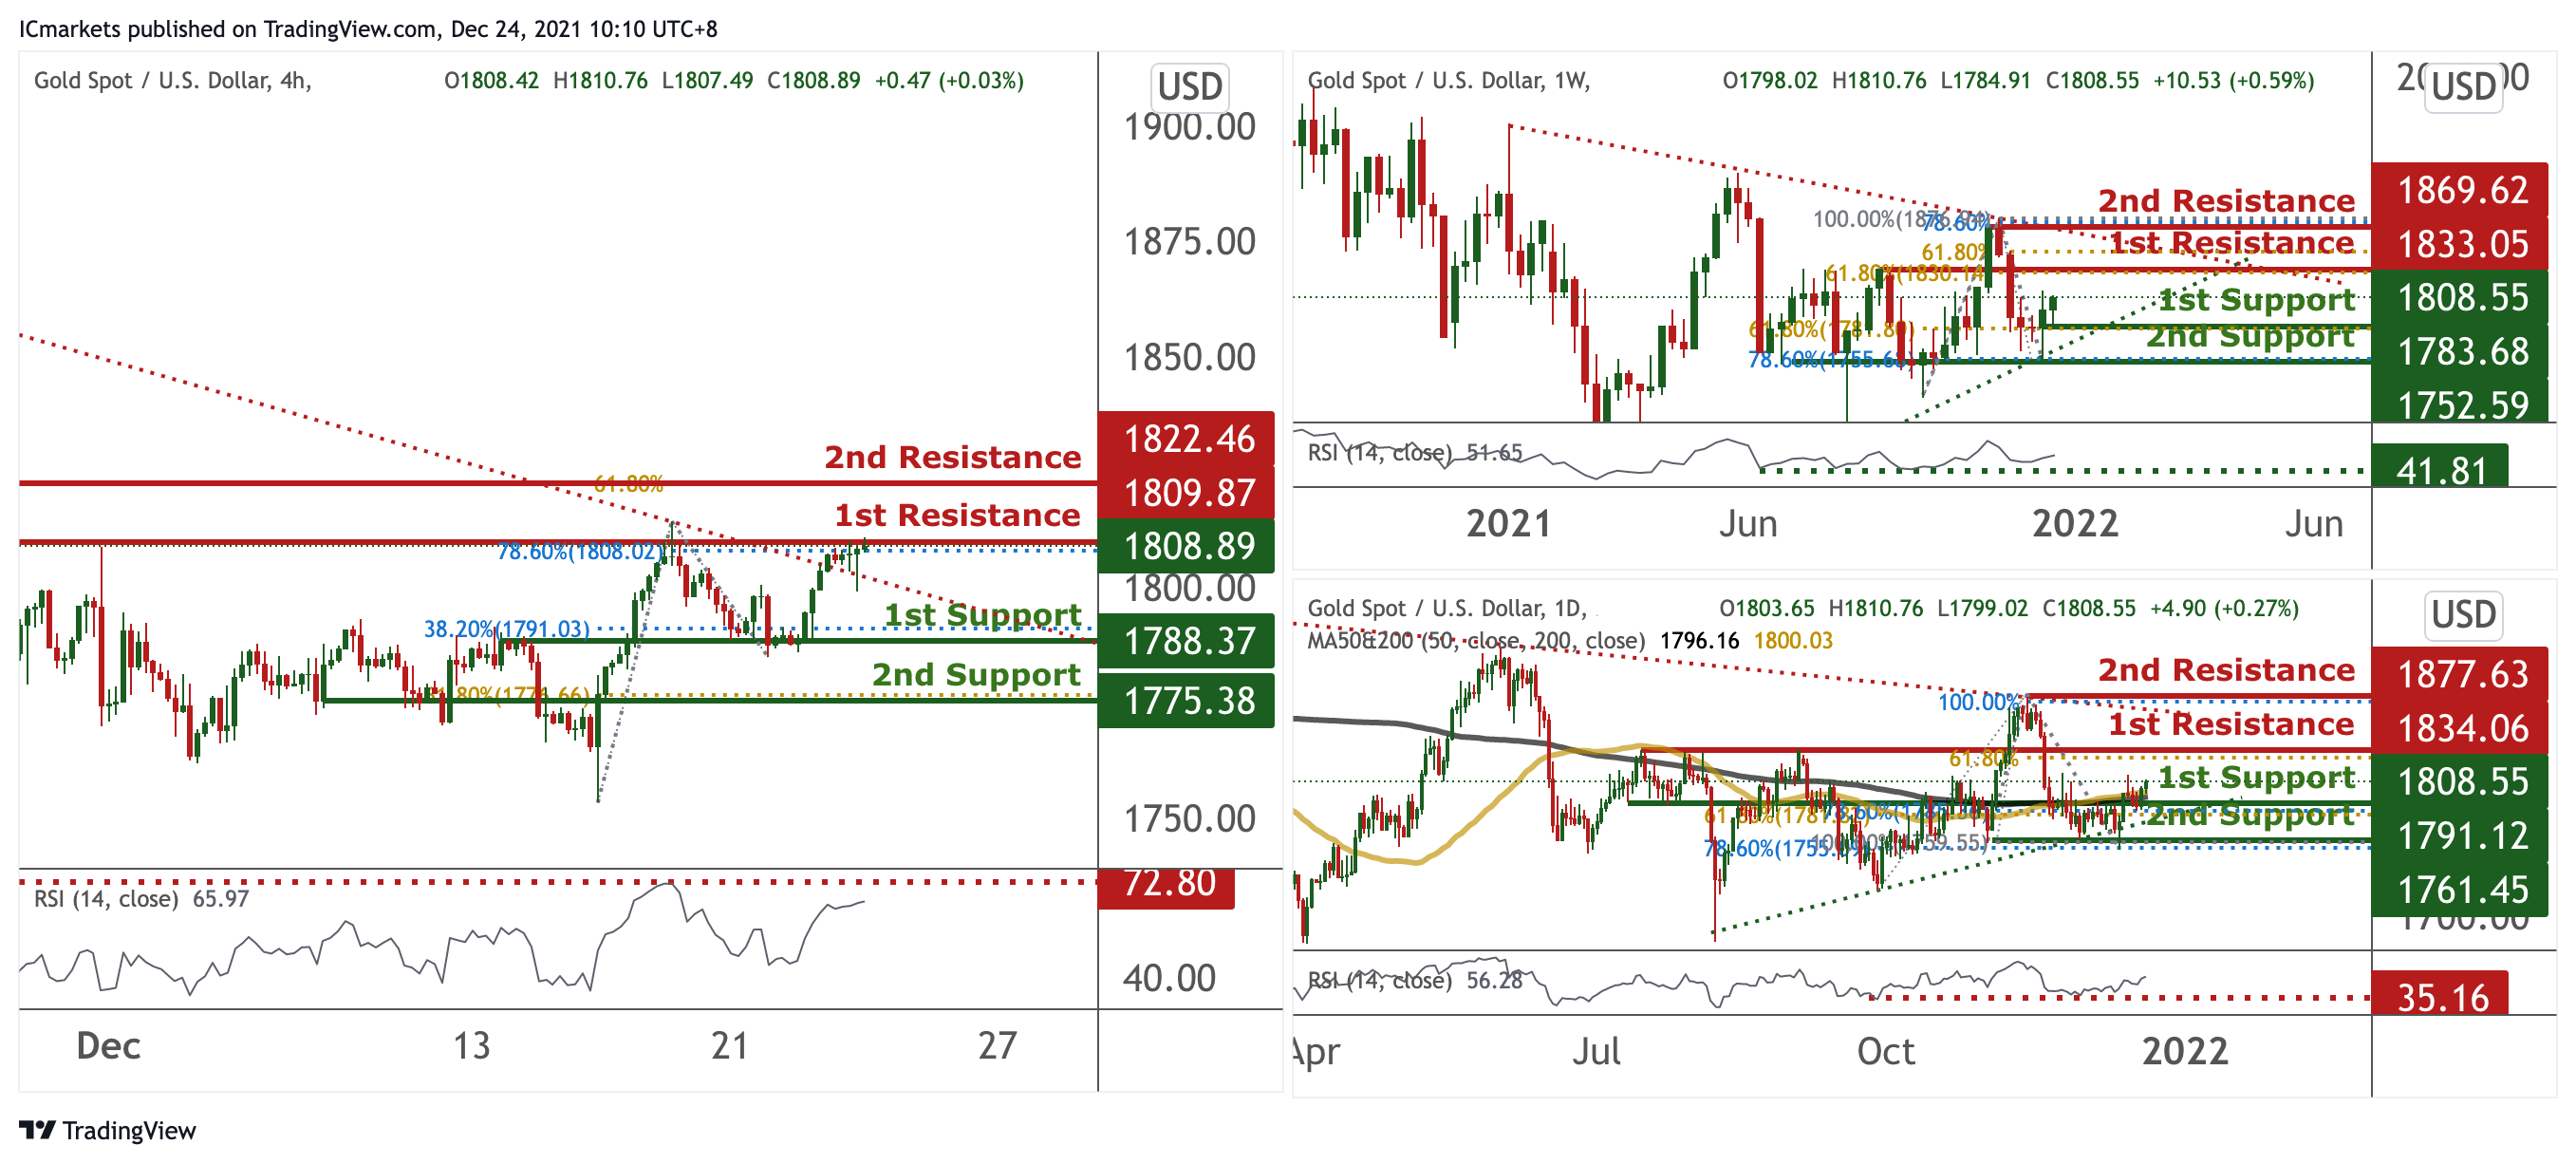
On the weekly, prices have broken out of our triangle and have the potential to climb from our 1st support at 1783.68 in line with 61.8% Fibonacci retracement towards our 1st resistance at 1833.05 which is an area of Fibonacci confluences. Technical indicators are showing bullish momentum.
On the daily, prices are consolidating in a triangle. We see potential for a bounce from our 1st support at 1791.12 in line with 61.8% Fibonacci retracement and 78.6% Fibonacci retracement towards our 1st resistance at 1834.06 in line with 61.8% Fibonacci retracement. Our bias is further supported by the MA 200 crossing over our 50 MA, showing a Golden cross and RSI at a level where bounces previously occurred.
On the H4 chart, prices are abiding to our daily bearish trendline. We see potential for prices to dip from our 1st resistance at 1809.87 in line with 78.6% Fibonacci extension towards our 1st support at 1788.37 in line with 38.2% Fibonacci retracement. RSI is at a level where dips previously occurred. Alternatively, breaking our 1st resistance will find prices climbing further towards our 2nd resistance at 1882.32 in line with 127.2% Fibonacci extension.
Areas of consideration:
- 4h 1st support at 1788.37
- 4h 1st resistance at 1808.89
GBP/USD
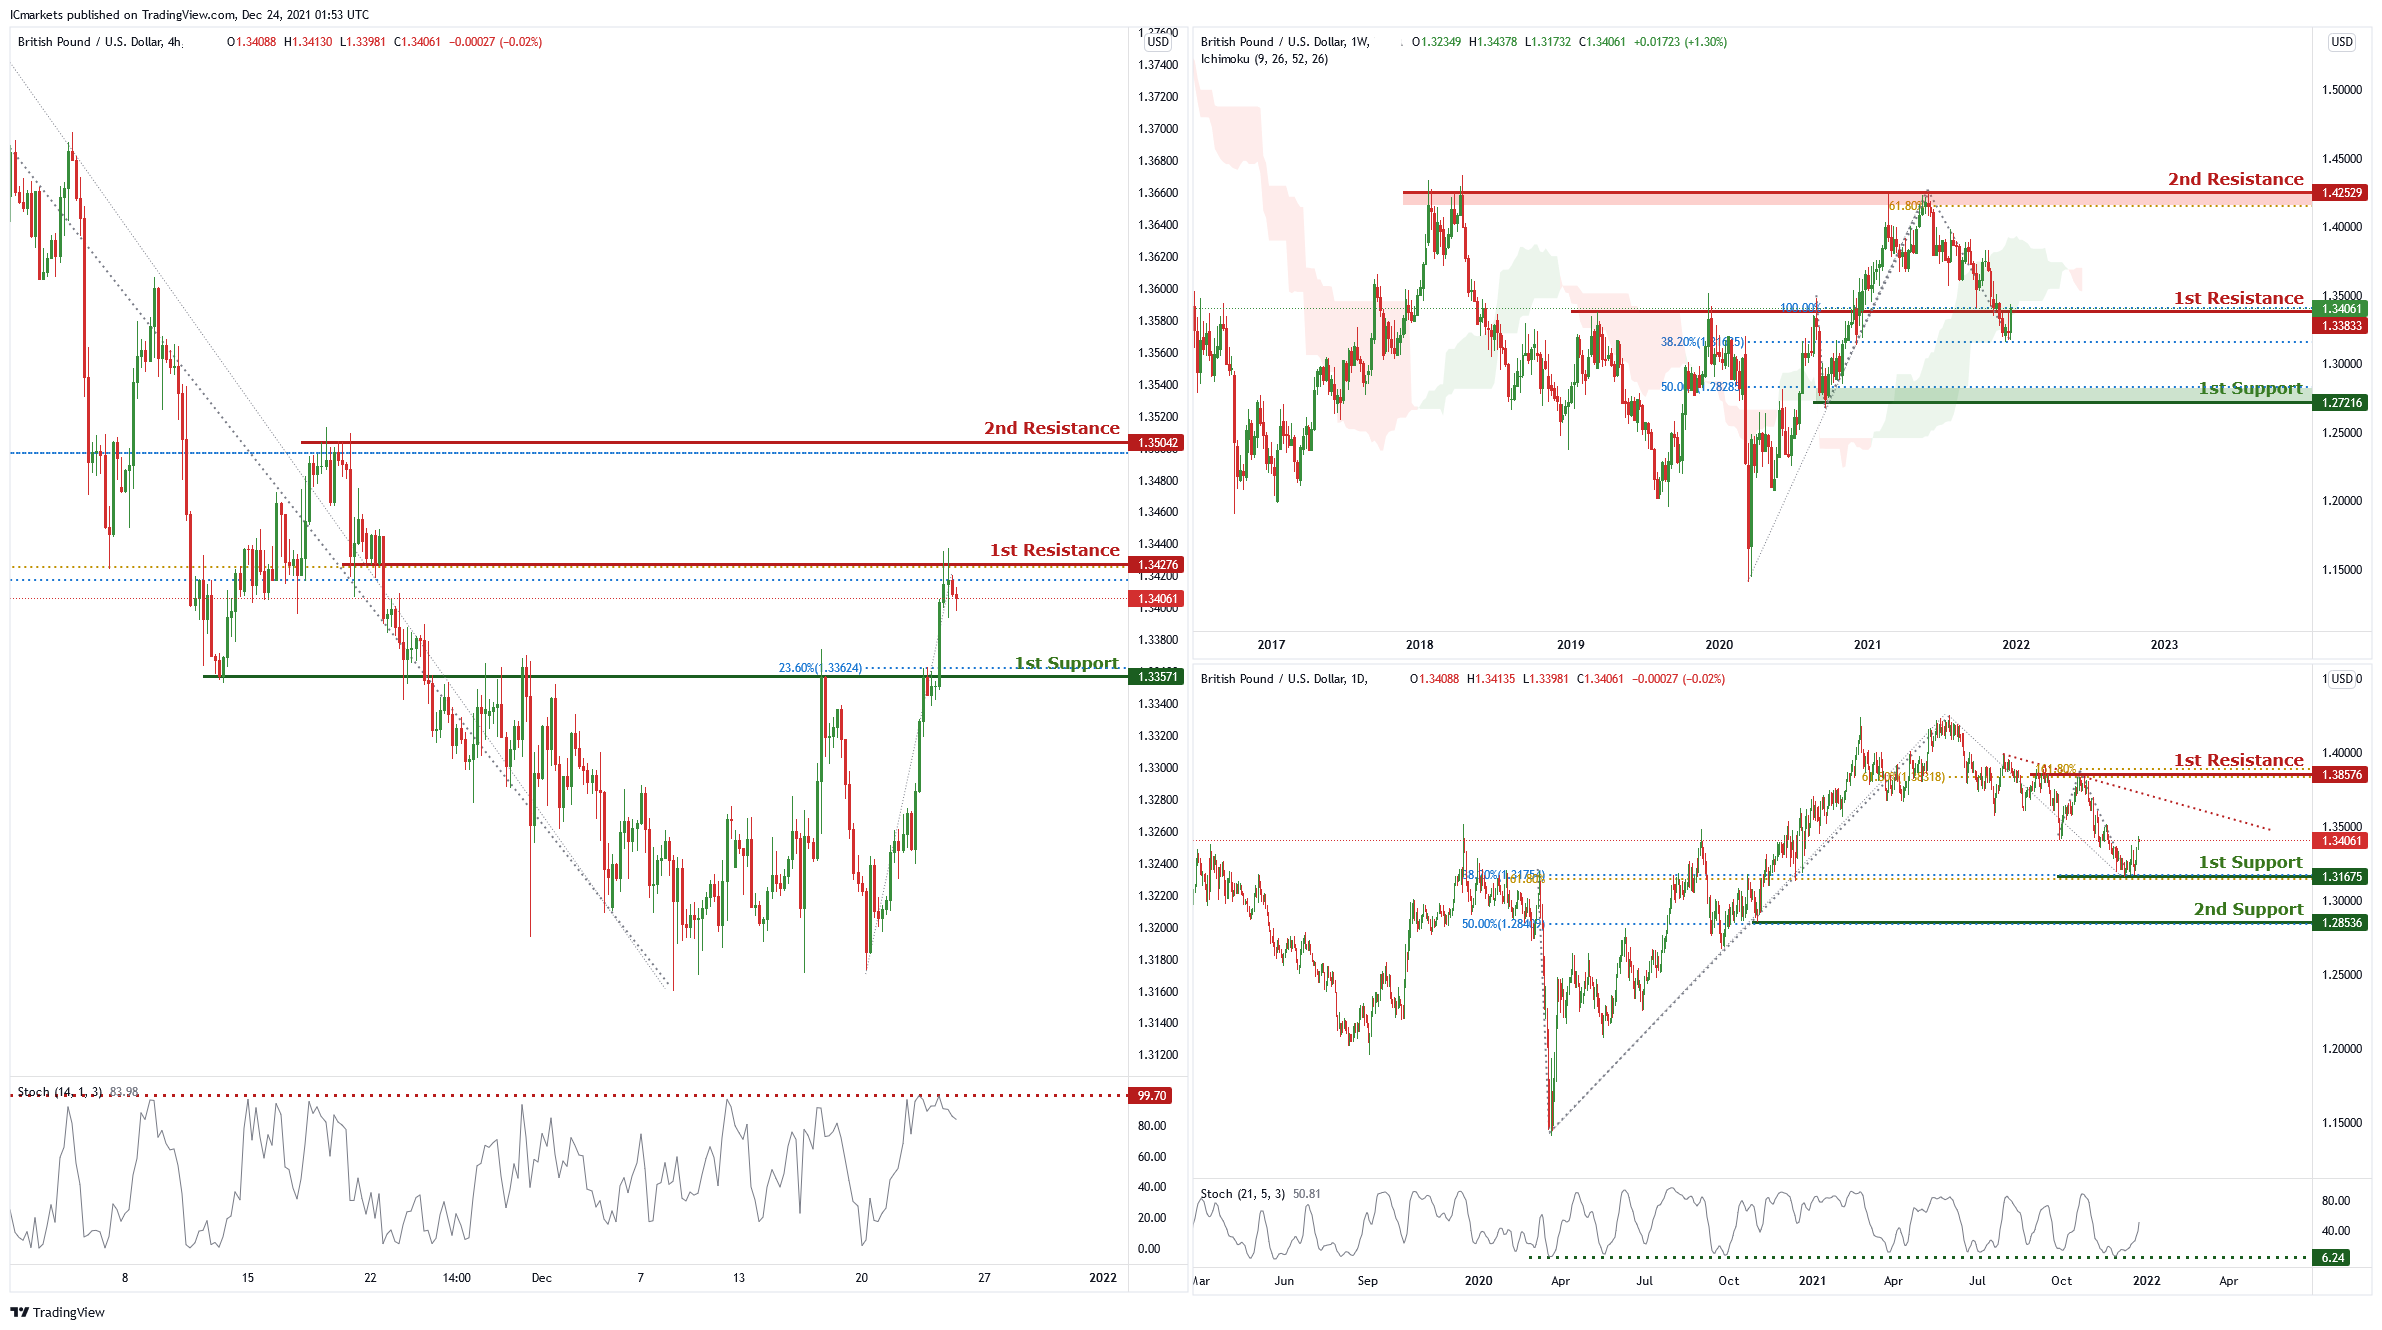
On the weekly chart price is near 1st resistance level of 1.33833 which is also 38.2% Fibonacci retracement and 100% Fibonacci projection. Price can potentially go to the 2nd resistance of 1.42529 which is the graphical swing high resistance and 61.8% Fibonacci projection. Our bullish bias is supported by the ichimoku cloud indicator.
On the daily chart price is abiding by the descending trendline and is near 1st support level of 1.31675 which is also 38.2% Fibonacci retracement and 61.8% Fibonacci projection. Price can potentially go to the 1st resistance level of 1.38756 which is 61.8% Fibonacci retracement. Our bullish bias is supported by the stochastic indicator as it is near support level.
On the H4 chart, price is near 1st resistance level of 1.34726 which is also 38.2% Fibonacci retracement and 61.8% Fibonacci projection. Price can potentially dip to the 1st support level of 1.33751 which is also the graphical overlap support and 23.6% Fibonacci retracement. Our bearish bias is supported by stochastic indicator as it is near the resistance level.
Areas of consideration :
- H4 1st resistance at 1.34276
- H4 1st support 1.33571
USD/CHF:
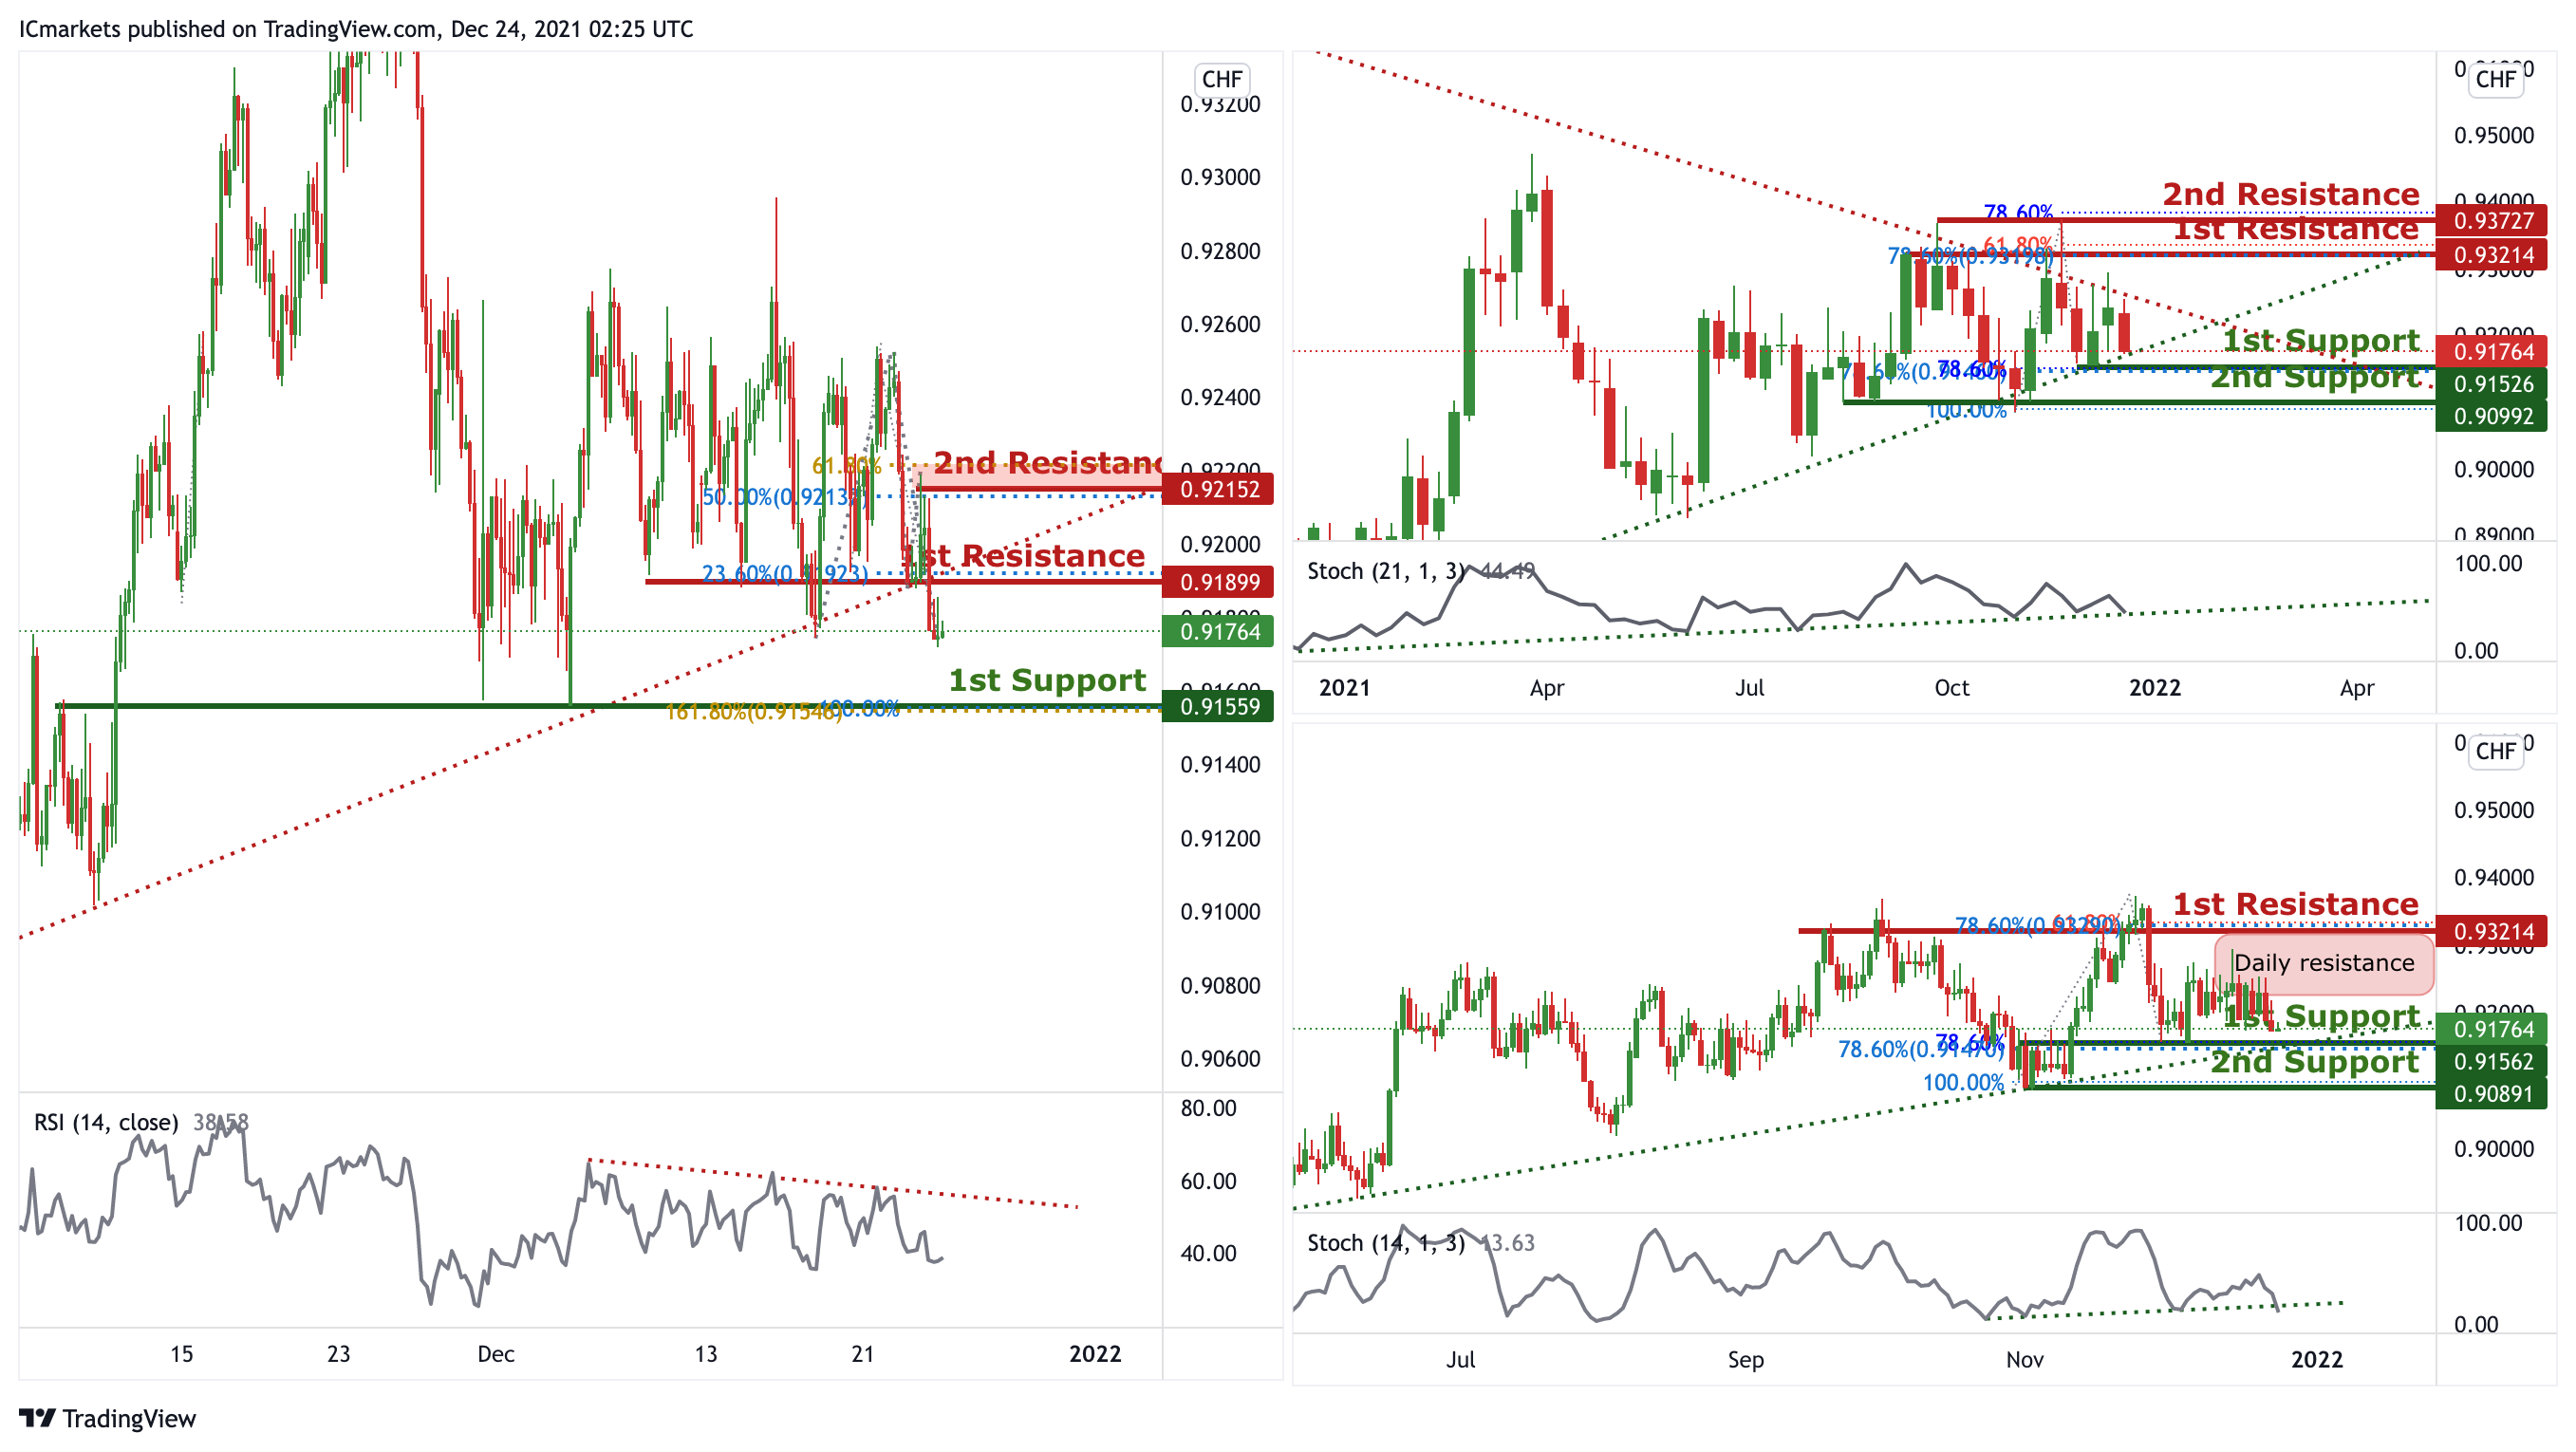
On the Weekly timeframe, price is reacting in a triangle pattern. Traders should wait for the price to swing higher or lower before entering. On the Daily timeframe, we can expect an overall bullish momentum. Price could bounce from 1st Support in line with 78.6% Fibonacci retracement and 78.6% FIbonacci projection towards 1st Resistance in line with 78.6% Fibonacci retracement and 61.8% Fibonacci projection. Our bullish bias is further supported by the stochastics indicator where the %D line is abiding to the ascending trendline.
On the H4 timeframe, price broke out of the ascending trendline support, signifying potential bearish momentum. We can expect price to drop form 1st Resistance in line with 23.6% fibonacci retracement and graphical overlap resistance towards 1st Support in line with graphical overlap support, 100% Fibonacci projection and 161.8% Fibonacci extension. Our bearish bias is further supported by the RSI indicator abiding to the descending trendline resistance.
Areas of consideration:
- Watch 1st Support at 0.91559
- Watch 1st Resistance at 0.91899
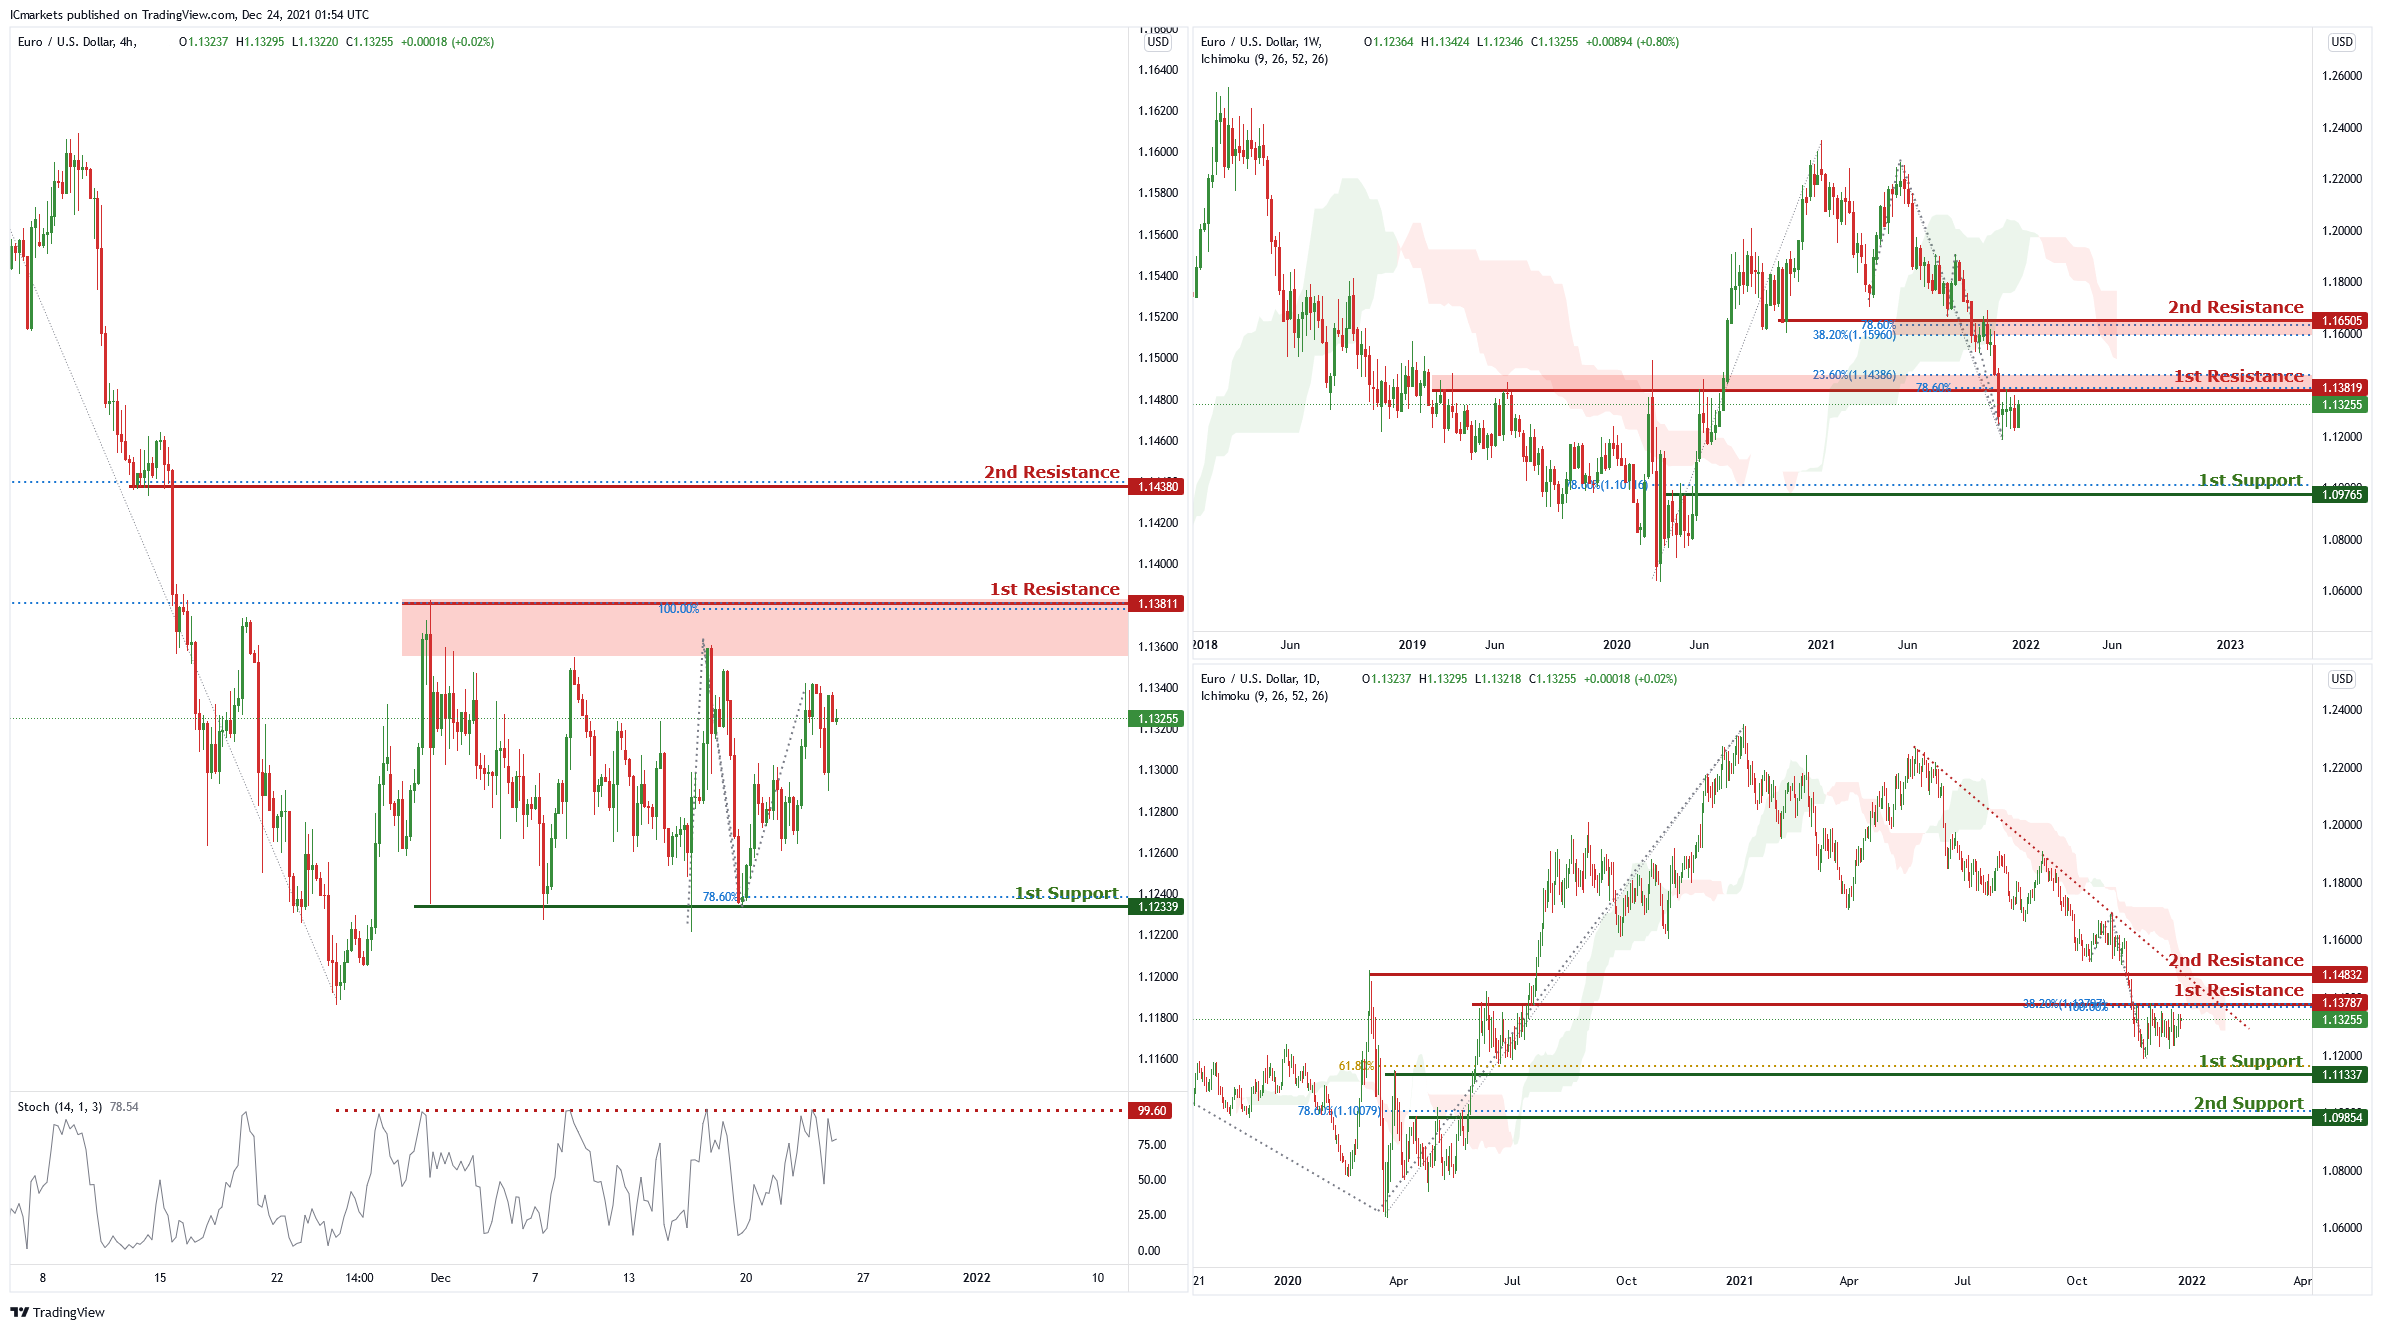
EUR/USD :
On the weekly chart price is near 1st resistance level of 23.6% Fibonacci retracement and 78.6% Fibonacci projection. Price can potentially dip to the 1st support level of 1.09765 which is also 78.6% Fibonacci retracement. Our bearish bias is supported by the ichimoku cloud indicator as price is trading below it.
On the daily chart, price is abiding by the descending trendline and is near the 1st resistance level of 1.13787 which is also 38.2% Fibonacci retracement and 100% Fibonacci projection. Price can potentially dip to the 1st support level of 1.1137 which is also 61.8% Fibonacci retracement. Our bearish bias is supported by the ichimoku cloud indicator as price is trading below it.
On the H4 chart, price is near the first resistance level of 1.13811 which is also 100% Fibonacci projection and 38.2% Fibonacci retracemenT. Price can potentially dip to the 1st support level of 1.12339 which is also 78.6% Fibonacci projection. Our bearish bias is supported by the stochastic indicator as it is near resistance level.
Areas of consideration :
- H4 1st resistance at 1.13811
- H4 1st support at 1.12339
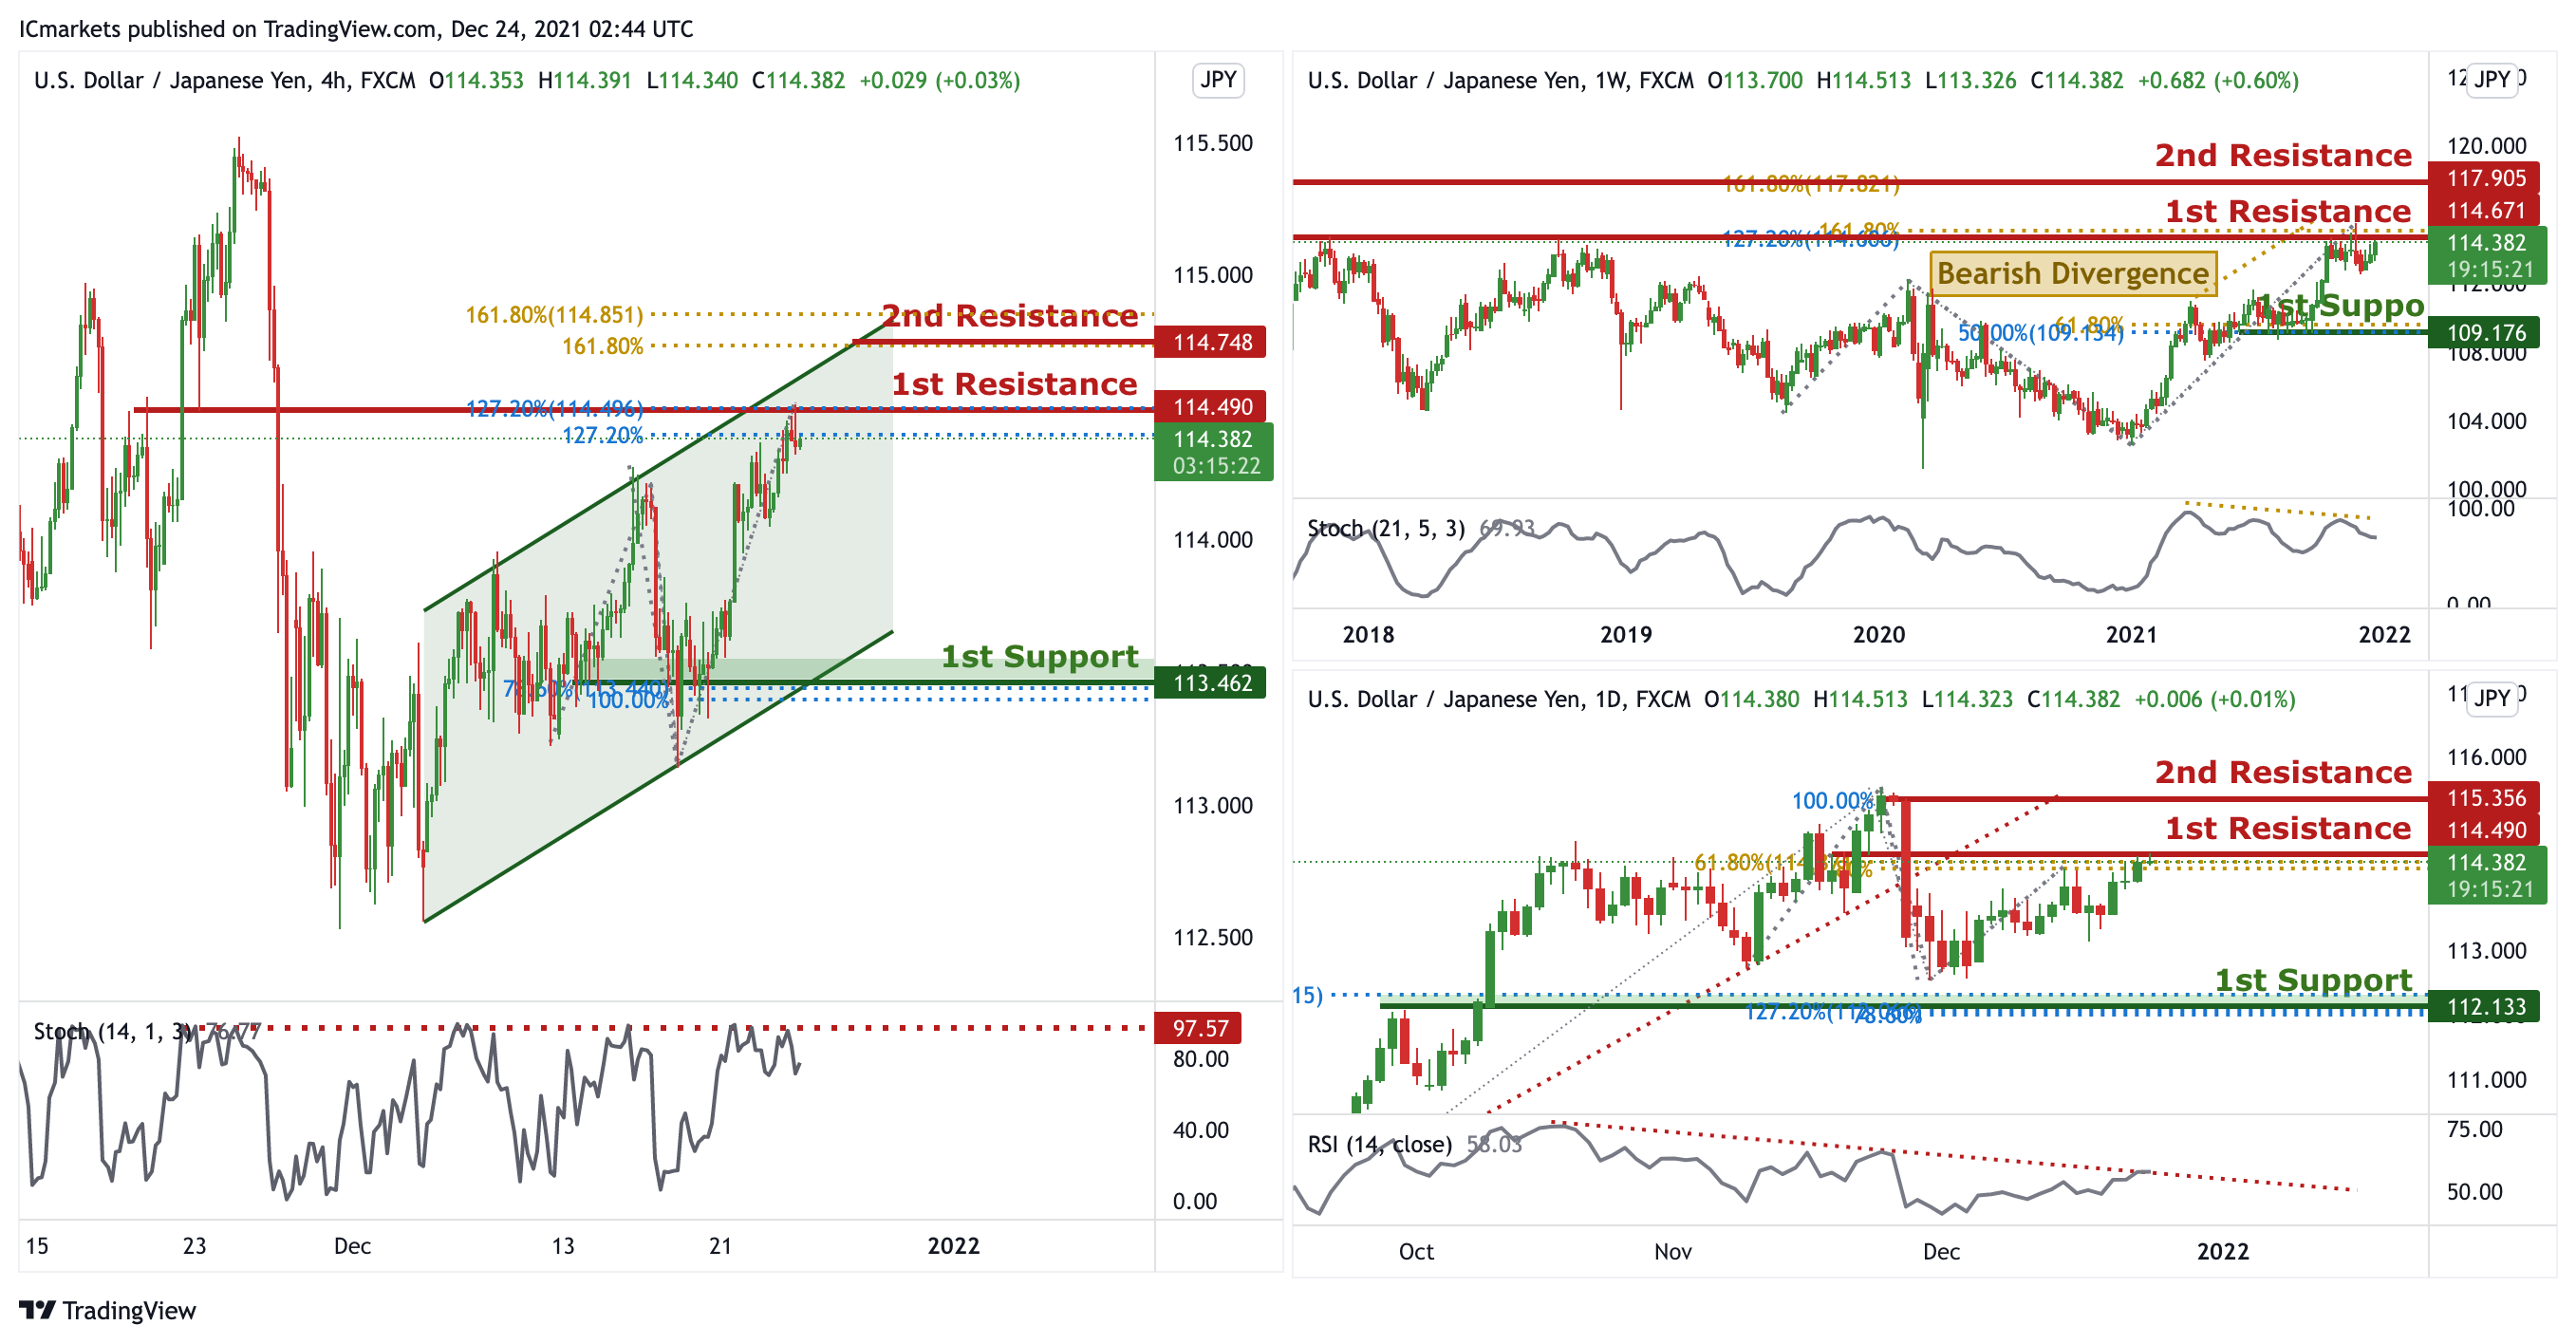
USD/JPY:
On the Weekly timeframe, we can see that price touched the 1st resistance in line with horizontal swing highs and 127.2% FIbonacci Retracement and 161.8% Fibonacci Projection. We can expect the price to drop from the 1st Resistance towards the 1st Support in line with 61.8% Fibonacci projection and 50% Fibonacci retracement. Our short-term bearish momentum is further supported by the stochastic %K line holding below the descending trendline resistance and bearish divergence spotted. On the Daily timeframe, we can expect price to drop from 1st Resistance in line with 50% Fibonacci retracement and 61.8% Fibonacci projection towards 1st Support in line with 50% Fibonacci retracement, 78.6% Fibonacci projection and 127.2% Fibonacci extension. Our bearish bias is further supported by the RSI indicator where it is abiding to the descending trendline resistance.
On the H4 timeframe, price is abiding to the ascending channel, showing an overall bullish momentum. However, we can expect a short term bearish momentum and drop from 1st resistance in line with previous high ,127.2% Fibonacci projection and 127.2% Fibonacci retracement towards 1st Support in line with horizontal support, 100% Fibonacci projection and 78.6% Fibonacci retracement. Our bearish bias is further supported by stochastic where the %K line dropped from the resistance.
Areas of consideration:
- H4 1st resistance level 114.490
- H4 1st support level 113.462
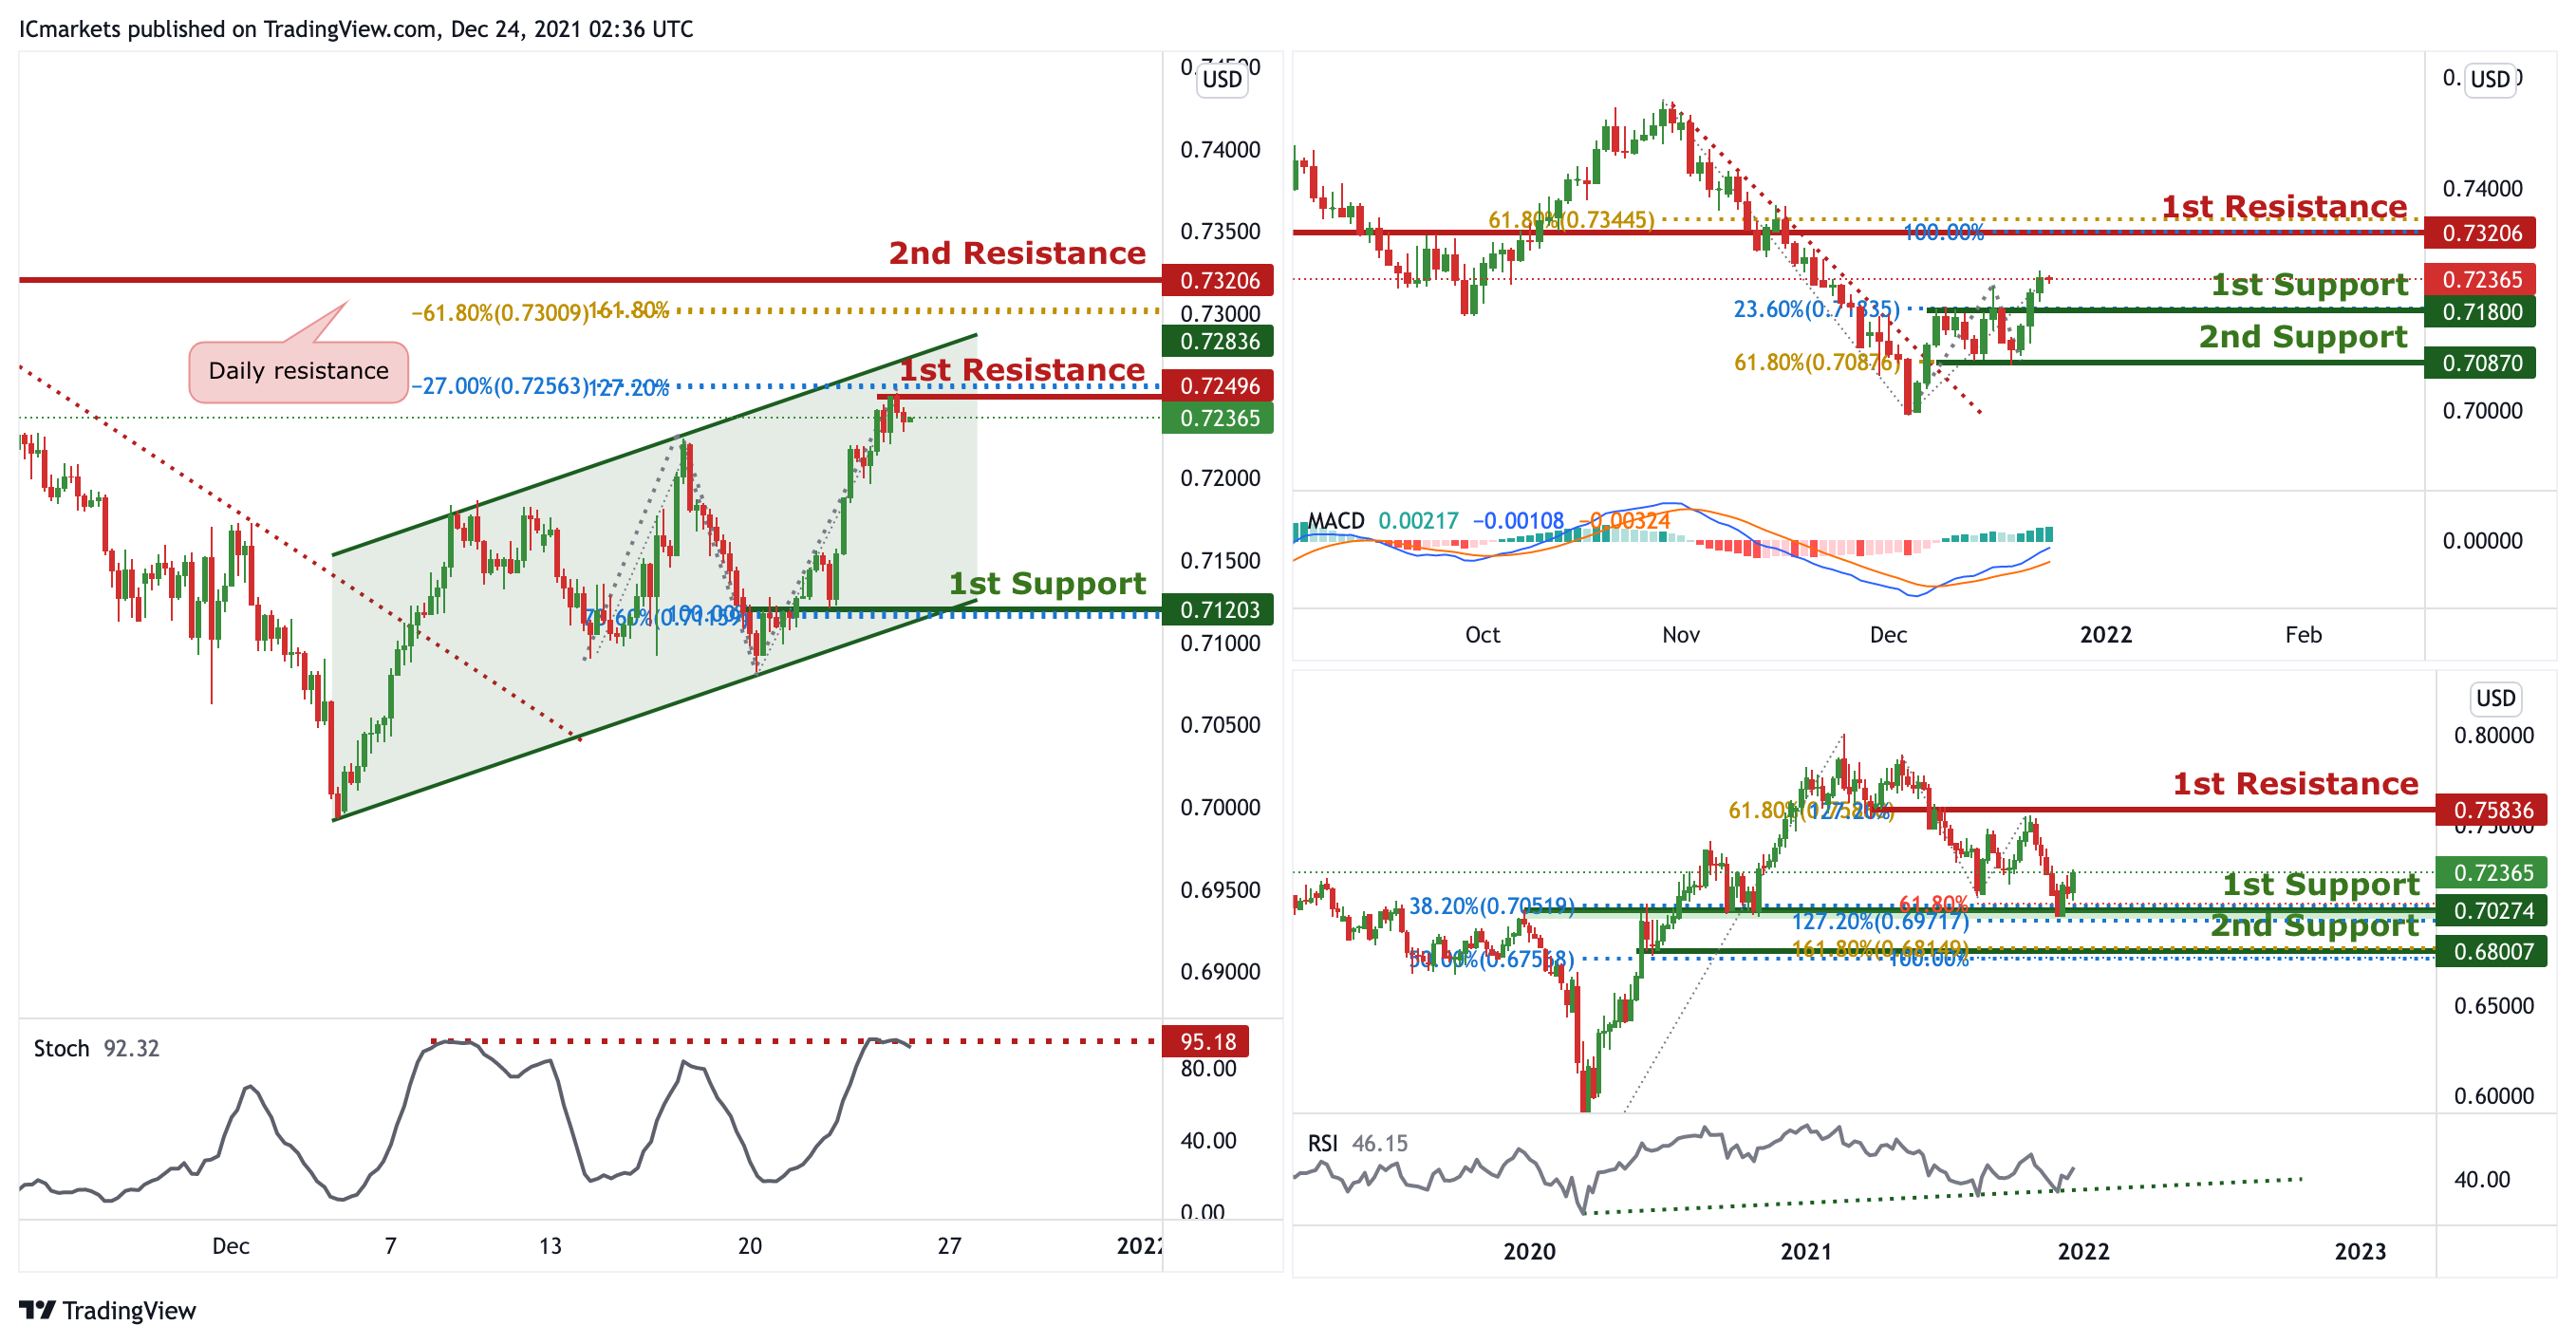
AUD/USD:
On the weekly, we can now expect the price to bounce from the 1st Support in line with 61.8% Fibonacci projection, 38.2 % FIbonacci retracement and 127.2% Fibonacci extensions. Our bullish bias is further supported by the RSI indicator abiding to an ascending trendline. In reference to last week’s analysis price indeed bounced and reached 1st Resistance. On the Daily, the price is at the 1st support, we can expect price to bounce from 1st Support in line with 23.6% Fibonacci retracement towards 1st Resistance in line with 100% Fibonacci projection and 61.8% Fibonacci retracement. Our bullish bias is further supported by the MACD indicator where the MACD line is above the signal line.
On the H4, price is reacting in an ascending channel, signifying bullish momentum. However, price is currently at a resistance, we can expect price to drop from 1st Resistance in line with 127.2% Fibonacci projection and -27.2% Fibonacci Extension towards 1st Support in line with 100% Fibonacci projection and 78.6% Fibonacci retracement. Our short-term bearish bias is further supported by the stochastic indicator where the %K line is at the resistance level.
Areas of consideration:
- H4 1st Support level 0.71203
- H4 1st resistance level 0.72496
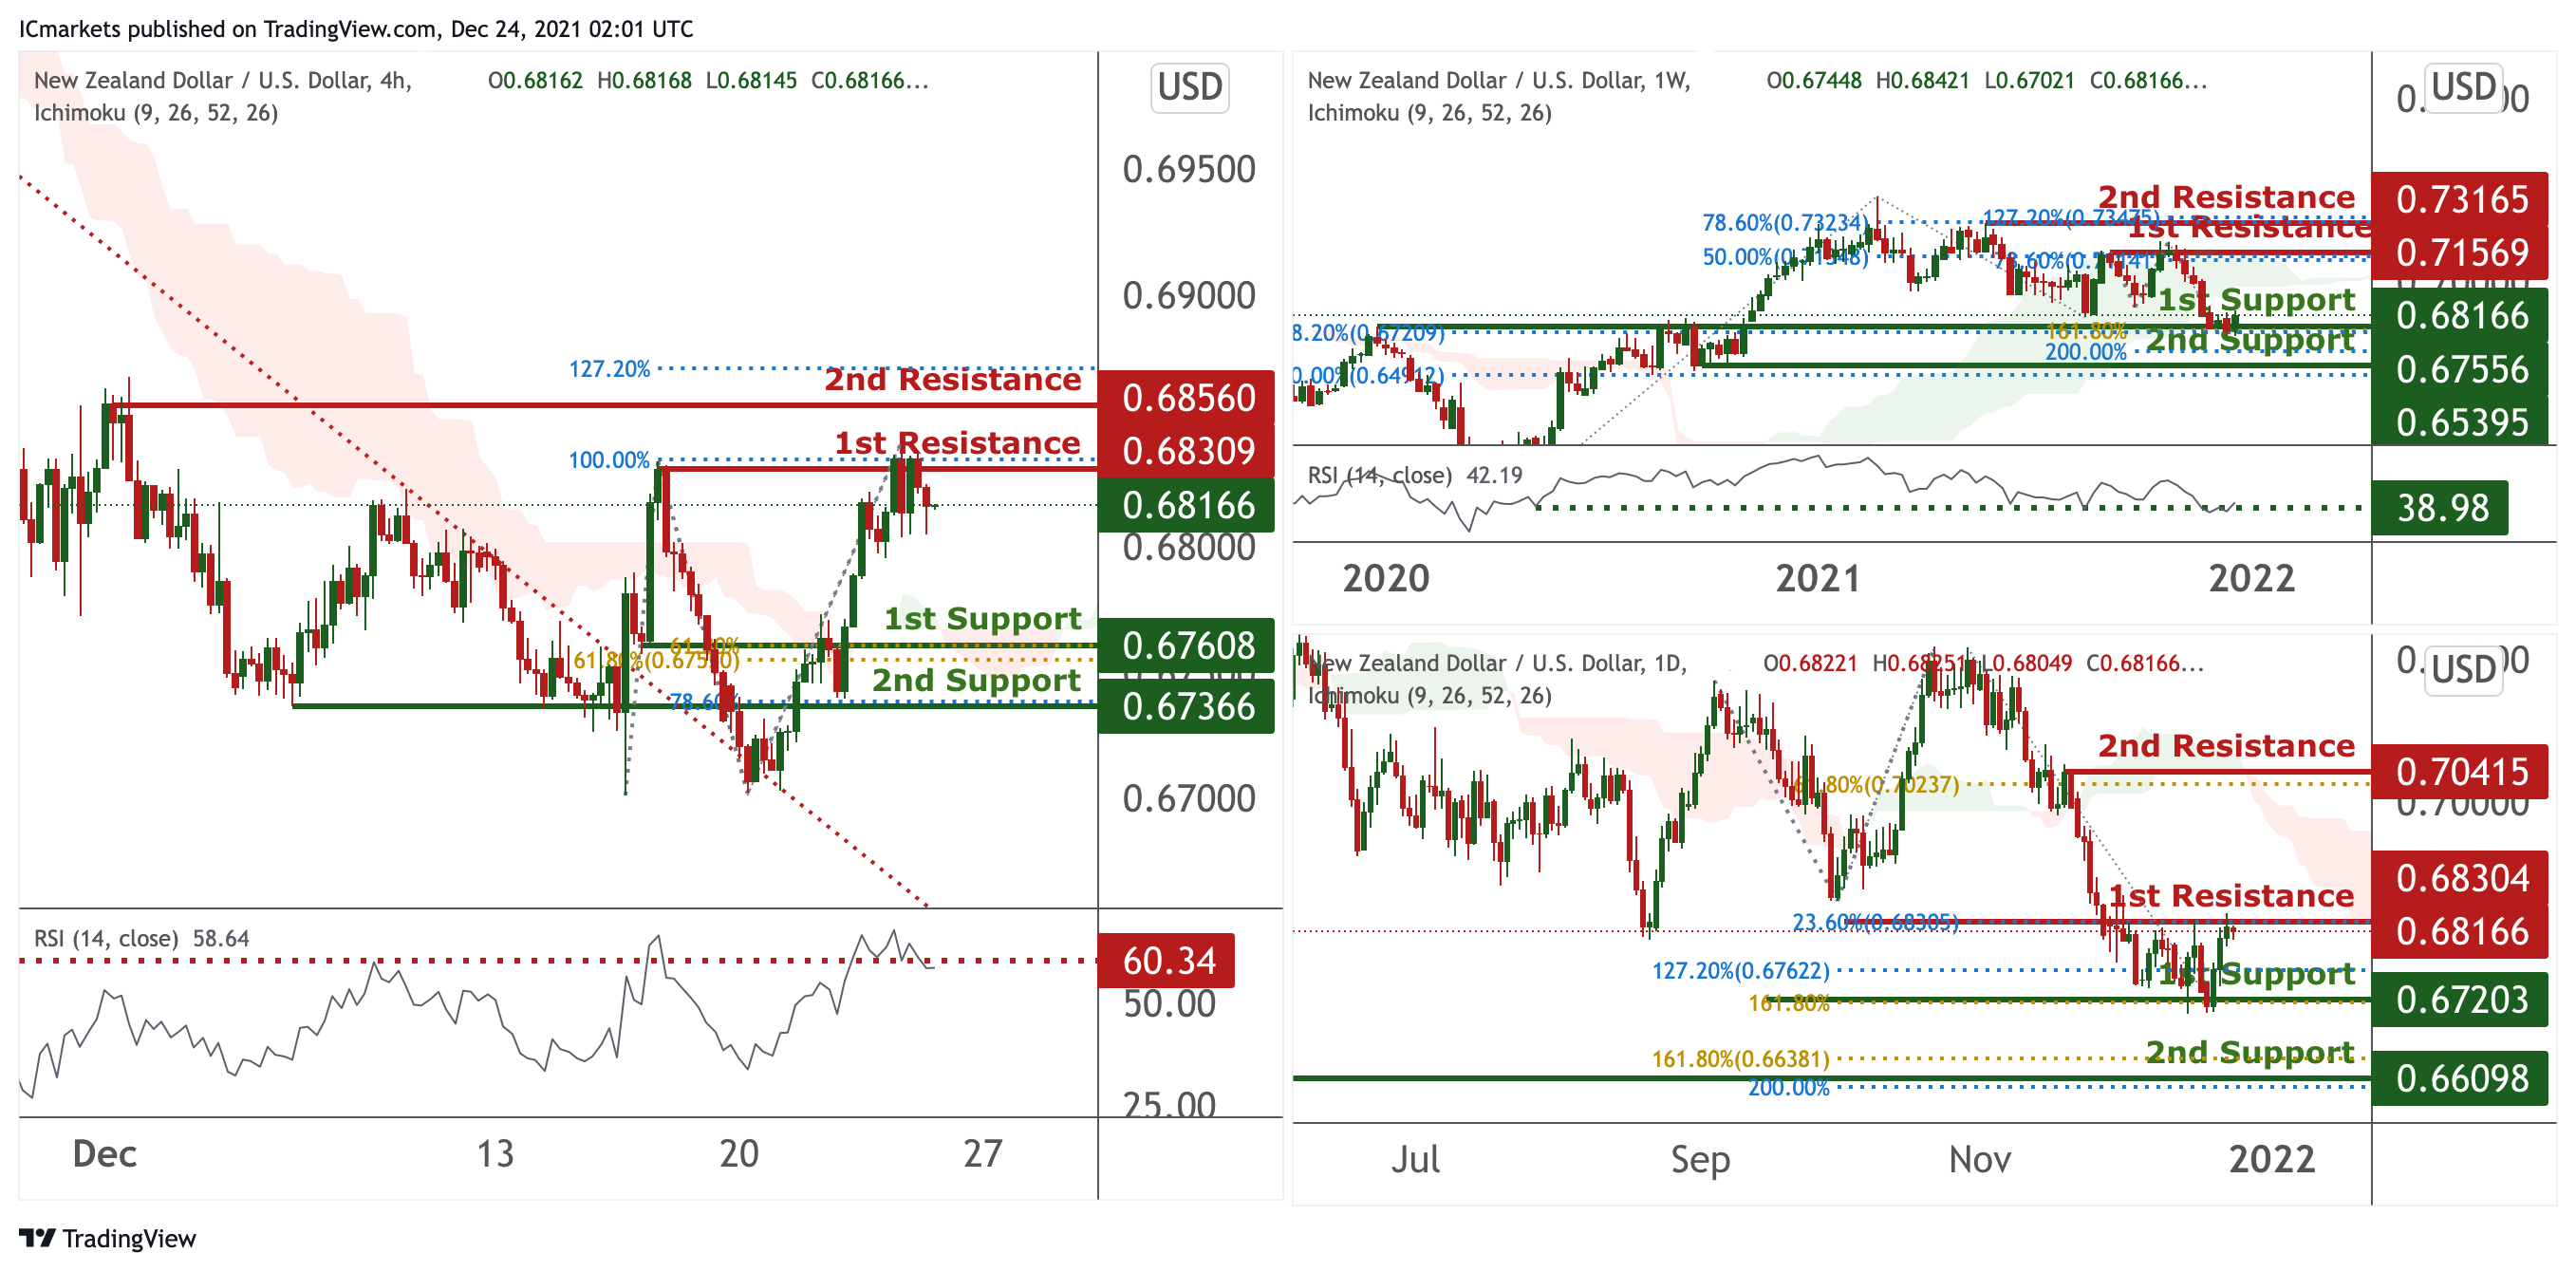
NZD/USD:
On the weekly, prices are on a bullish momentum. We see potential for a bounce at 1st support at 0.69794 in line with 23.6% Fibonacci retracement towards 1st resistance at 61.8% Fibonacci retracement. Technical indicators are showing bullish momentum. Alternatively, if prices break our 1st support, we might find it dipping towards our 2nd support at 0.69794 in line with 61.8% and 78.6% Fibonacci retracement.
On the daily, prices are on bearish momentum. We see potential for prices to dip from our 1st resistance at 0.68166 in line with 23.6% Fibonacci retracement towards our 1st support at 0.67203 in line with 127.2% Fibonacci retracement and 161.8% Fibonacci extension. Ichimoku clouds are forecasting the dips.
On the H4 timeframe, prices are at a Pivot and are experiencing a squeeze. We see potential for prices to dip from our 1st resistance at 0.68309 in line with 100% Fibonacci extension towards our 1st support at 0.67608 which is an area of Fibonacci confluences. Our bias is further supported by the Ichimoku Clouds forecasting bearish momentum and also RSI at a level where dips usually occur. If prices breaks our 1st resistance, we can potentially find prices climbing higher towards our 2nd resistance.
Areas of consideration:
- H4 time frame, 1st resistance at 0.68309
- H4 time frame, 1st support at 0.67609
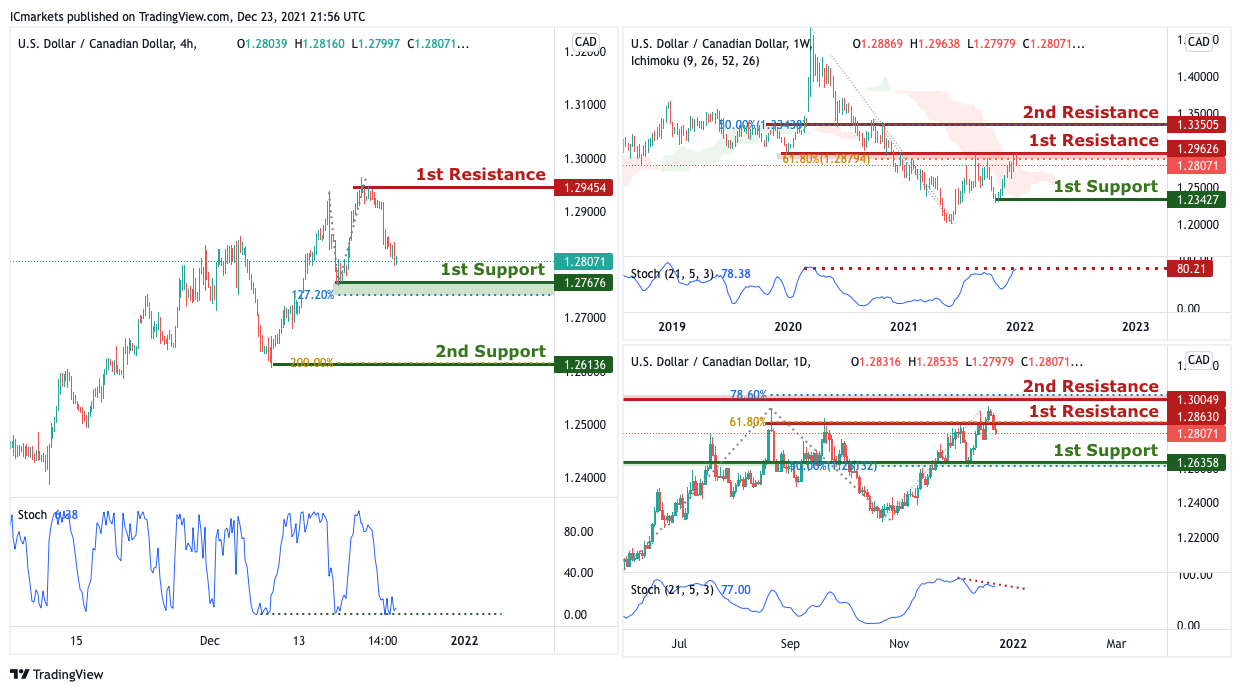
USD/CAD:
On the weekly timeframe, with price at the resistance of the ichimoku cloud and the stocastics indicator, we have a bearish bias that price will drop to 1st support at 1.23427 in line with the graphical swing low support from 1st resistance at 1.29626 in line with the 61.8% Fibonacci retracement and graphical swing high resistance. Alternatively, we may see price break 1st resistance and head for 2nd resistance at 1.33505 in line with the horizontal overlap resistance and 50% Fibonacci retracement.
On the daily timeframe, with price at the resistance of the stochastics indicator, we have a bearish bias that price will drop to 1st support at 1.26358 in line with the graphical overlap support and 50% Fibonacci retracement from 1st resistance at 1.28630 in line with the 61.8% Fibonacci retracement and graphical swing high resistance. Alternatively, we may see price break 1st resistance and head for 2nd resistance at 1.30049 in line with the horizontal swing high resistance and 78.6% Fibonacci retracement.
On the H4 timeframe,with price approaching the support of the stochastics indicator, we have a bullish bias that price will rise from 1st support at 1.27676 in line with the graphical swing low support and 127.2% Fibonacci extension to 1st resistance at 1.29454 in line with the graphical swing high resistance. Alternatively, we may see price break 1st support and head for 2nd support at 1.26136 in line with the horizontal swing low support and 200% Fibonacci projection.
Areas of consideration:
- H4 time frame, support at 1.27676
- H4 time frame, resistance at 1.29454
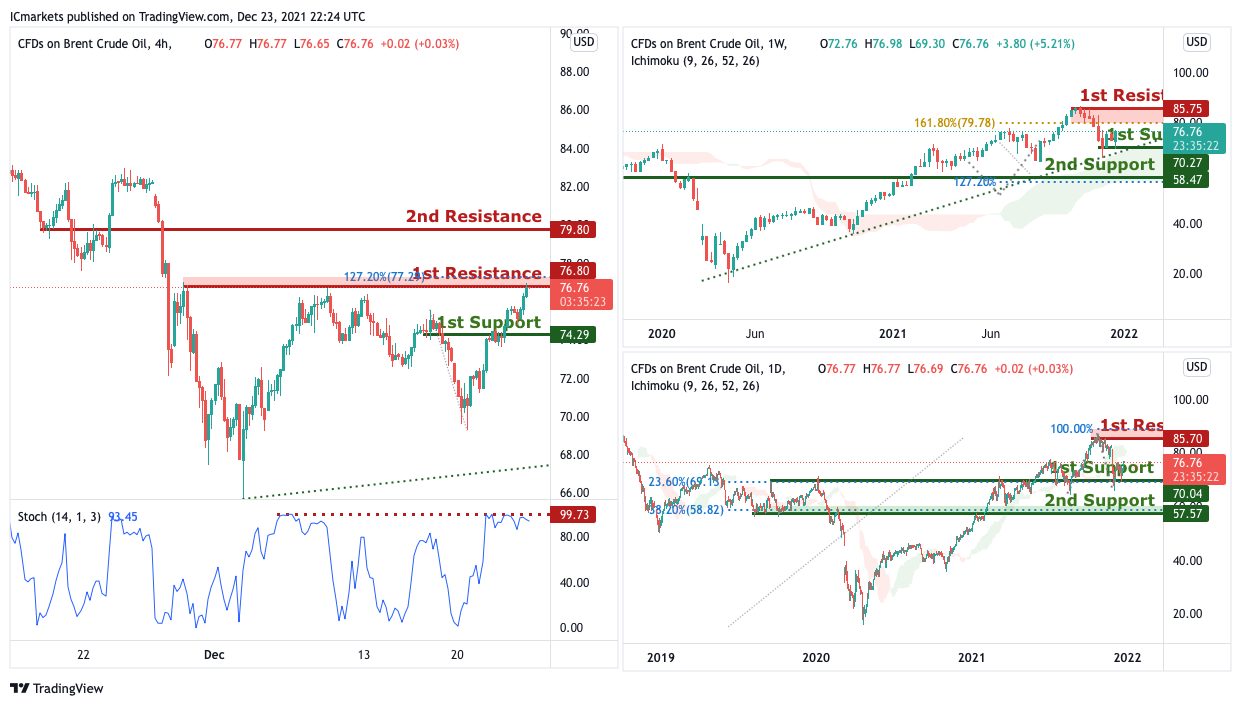
OIL:
On the weekly timeframe, with price moving above the ichimoku cloud, we have a bullish bias that price will rise from 1st support at 76.76 in line with the graphical swing low resistance to 1st resistance at 85.75 in line with the 161.8% Fibonacci projection and graphical swing high resistance. Alternatively, we may see price break 1st support and head for 2nd support at 58.47 in line with the horizontal overlap support and 127.2% Fibonacci extension.
On the daily timeframe, with price moving above the ichimoku cloud, we have a bullish bias that price will rise from 1st support at 76.76 in line 23.6% Fibonacci retracement and graphical overlap resistance to 1st resistance at 85.70 in line with the 100% Fibonacci projection and graphical swing high resistance. Alternatively, we may see price break 1st support and head for 2nd support at 57.57 in line with the horizontal overlap support and 38.2% Fibonacci retracement.
On the H4 timeframe,with price approaching the resistance of the stochastics indicator, we have a bearish bias that price will drop to 1st support at 74.29 in line with the graphical overlap support from 1st resistance at 76.80 in line with the 127.2% Fibonacci projection and graphical swing high resistance. Alternatively, we may see price break 1st resistance and head for 2nd resistance at 79.80 in line with the horizontal swing high resistance.
Areas of consideration:
- H4 time frame, 1st resistance of 80
- H4 time frame, 1st support of 29
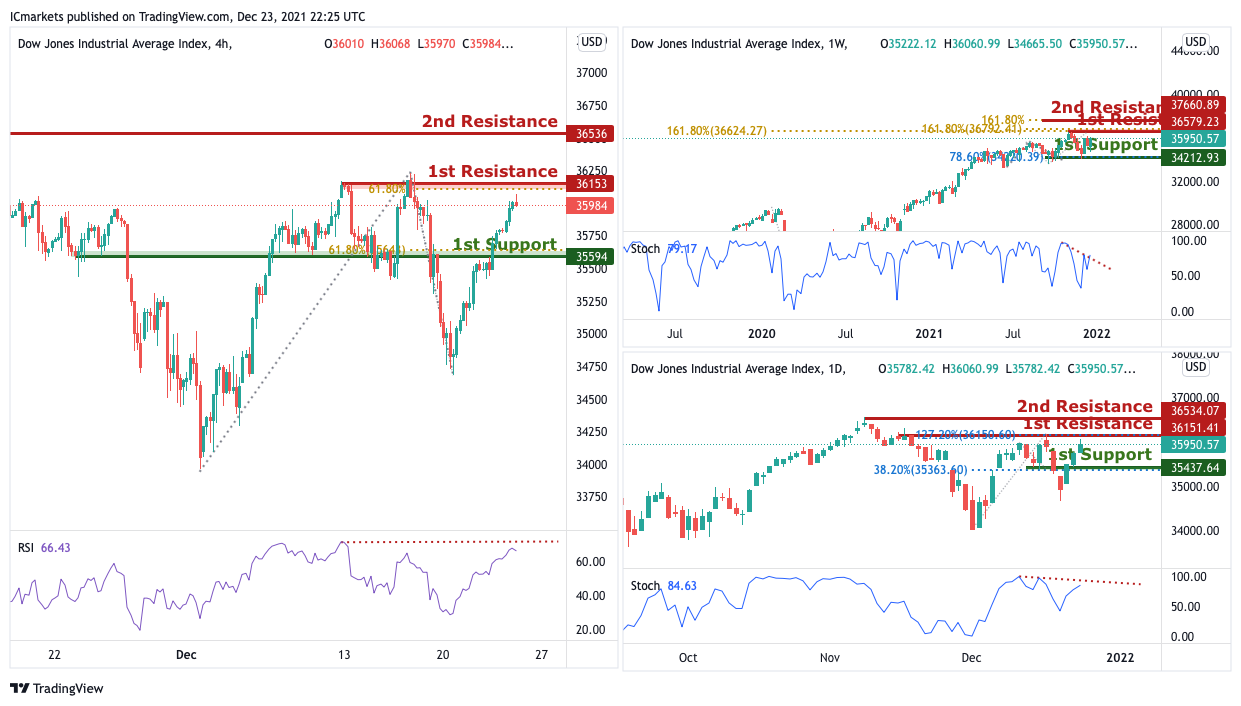
Dow Jones Industrial Average:
On the weekly timeframe, with price approaching the resistance of the stochastics indicator, we have a bearish bias that price will drop to 1st support at 34212 in line with the graphical overlap support and 78.6% Fibonacci retracement from 1st resistance at 36579 in line with the 161.8% Fibonacci projection and graphical swing high resistance. Alternatively, we may see price break 1st resistance and head for 2nd resistance at 37660 in line with the 161.8% Fibonacci extension.
On the daily timeframe, with price approaching the resistance of the stochastics indicator, we have a bearish bias that price will drop to 1st support at 35437 in line with the graphical overlap support and 38.2% Fibonacci retracement from 1st resistance at 36151 in line with the 127.2% Fibonacci projection and graphical swing high resistance. Alternatively, we may see price break 1st resistance and head for 2nd resistance at 36151 in line with the horizontal swing high resistance.
On the H4 timeframe,with price approaching the resistance of the stochastics indicator, we have a bearish bias that price will drop to 1st support at 35594 in line with the graphical overlap support and 61.8% Fibonacci retracement from 1st resistance at 36153 in line with the 61.8% Fibonacci retracement and graphical swing high resistance. Alternatively, we may see price break 1st resistance and head for 2nd resistance at 36536 in line with the horizontal swing high resistance.
Area of consideration:
- 4H resistance at 36153
- 4H support at 35594
The accuracy, completeness and timeliness of the information contained on this site cannot be guaranteed. IC Markets does not warranty, guarantee or make any representations, or assume any liability regarding financial results based on the use of the information in the site.
News, views, opinions, recommendations and other information obtained from sources outside of www.icmarkets.com.au, used in this site are believed to be reliable, but we cannot guarantee their accuracy or completeness. All such information is subject to change at any time without notice. IC Markets assumes no responsibility for the content of any linked site.
The fact that such links may exist does not indicate approval or endorsement of any material contained on any linked site. IC Markets is not liable for any harm caused by the transmission, through accessing the services or information on this site, of a computer virus, or other computer code or programming device that might be used to access, delete, damage, disable, disrupt or otherwise impede in any manner, the operation of the site or of any user’s software, hardware, data or property.


