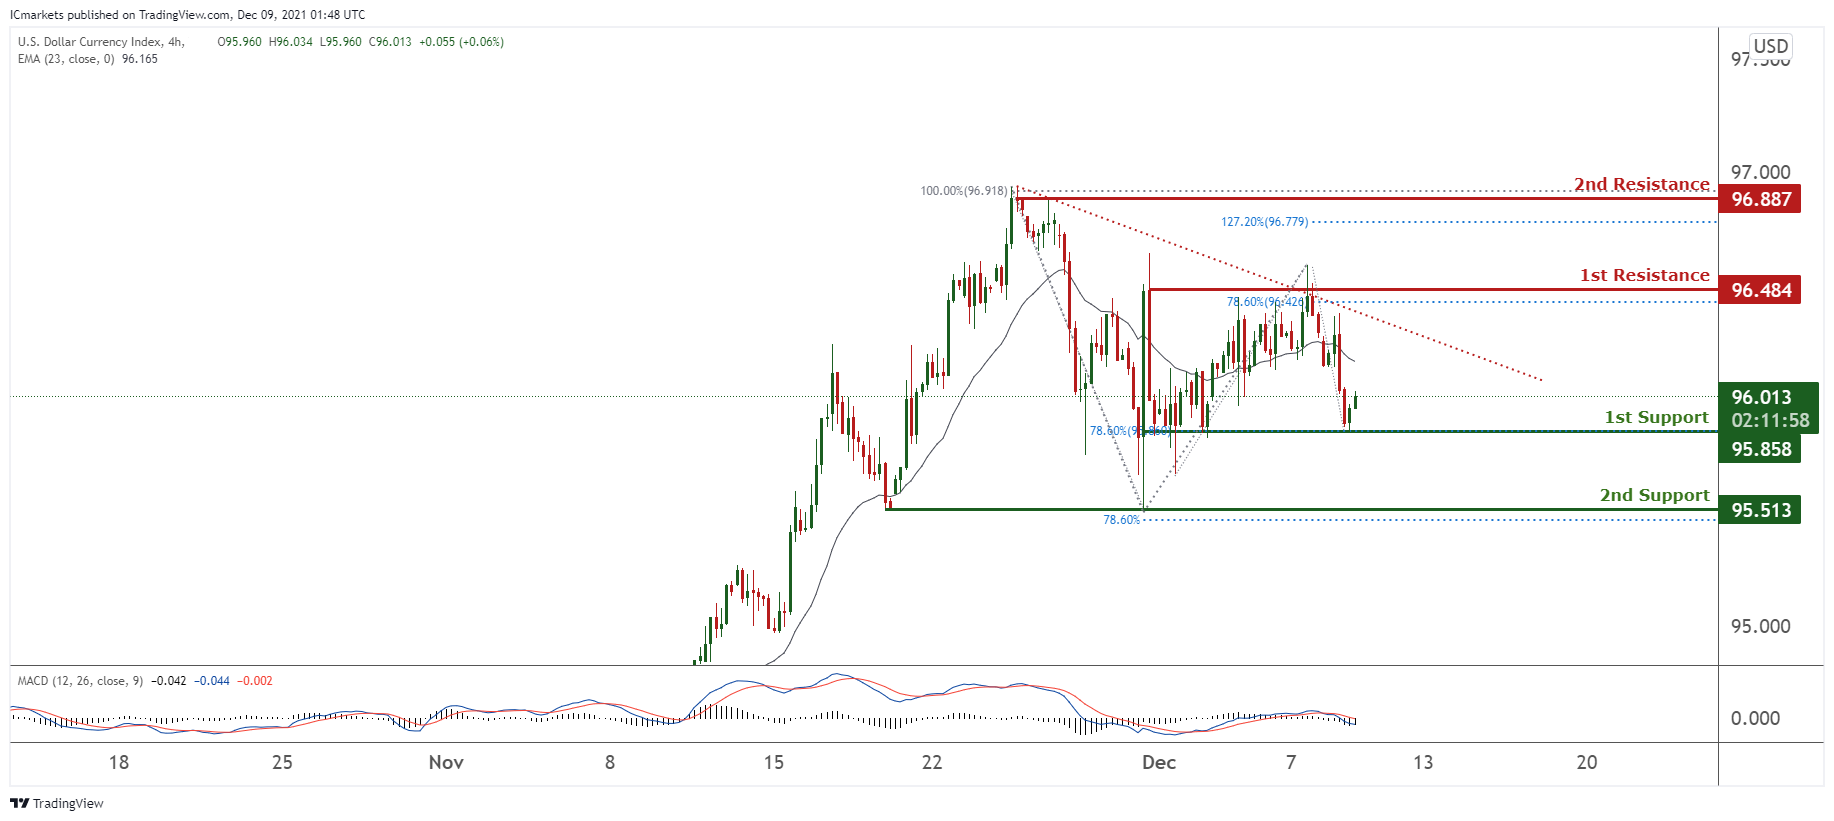
DXY:
On the H4 timeframe, prices are on bearish momentum. We see the potential for prices to dip from 1st resistance at 96.484 in line with 78.6% Fibonacci extension and descending trendline towards our 1st support at 95.858 in line with 78.6% Fibonacci retracement. Technical indicators are showing bearish momentum. Alternatively, breaking our 1st support will find prices dipping towards 2nd support at 95.513 in line with 78.6% Fibonacci extension.
Areas of consideration:
- H4 time frame, 1st resistance at 96.484
- H4 time frame, 1st support at 95.585
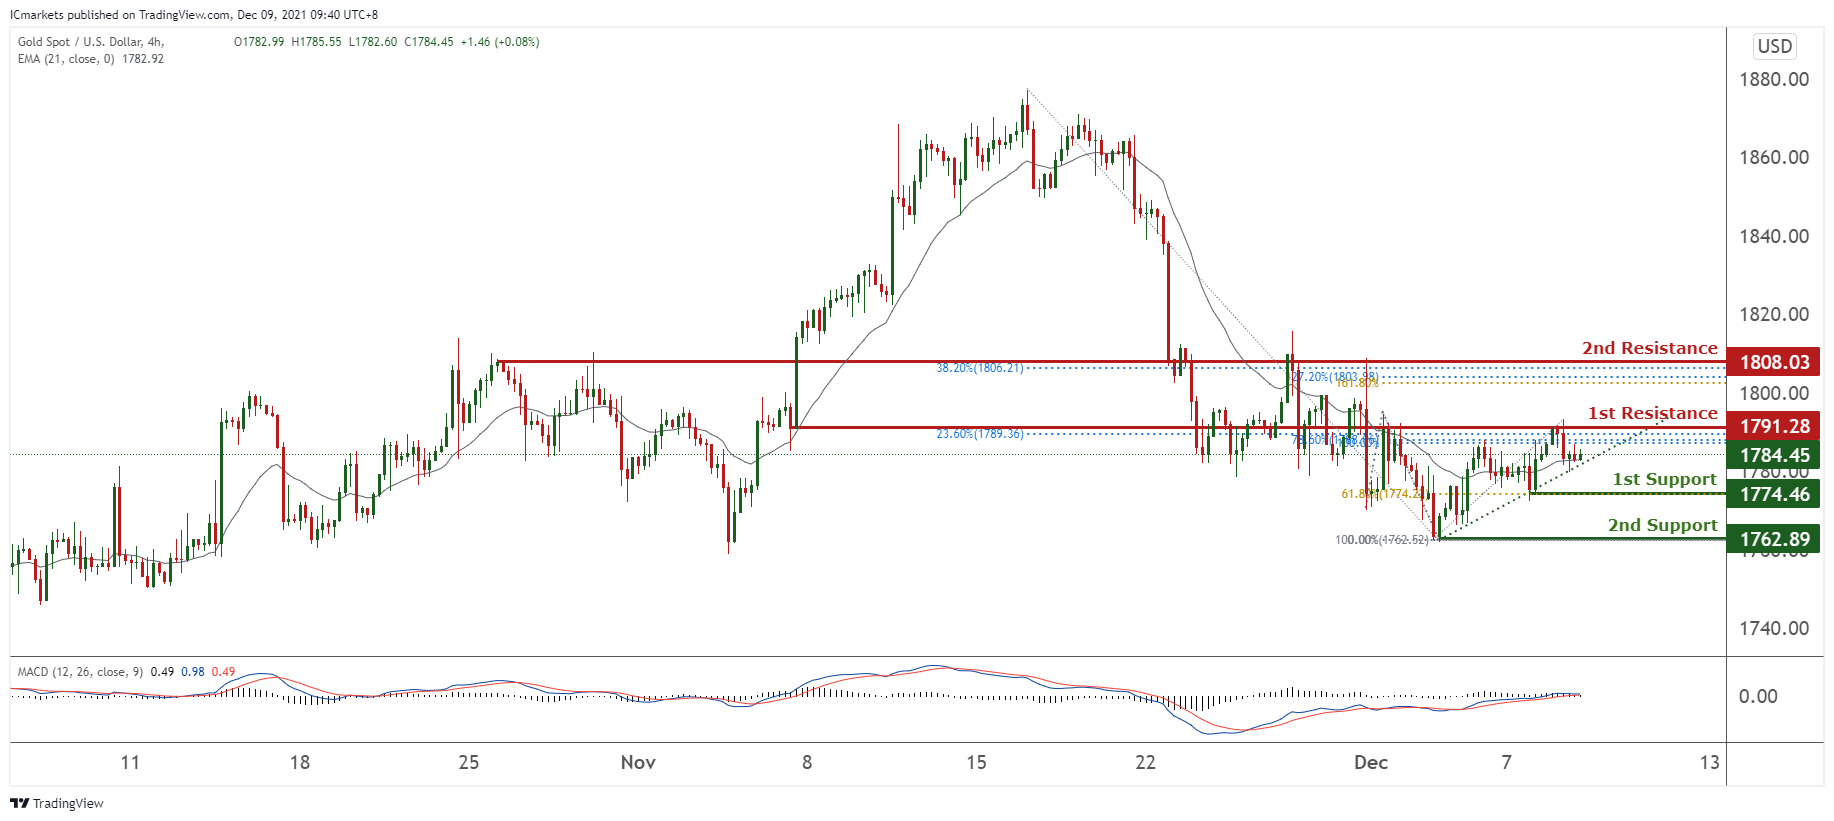
XAU/USD (GOLD):
On the H4 chart, prices are on bullish momentum. We foresee a potential bounce from our 1st support at 1781.3 in line with 23.6% Fibonacci retracement towards our 1st resistance at 1791.28 which is an area of Fibonacci confluences. Breaking it will find prices climbing higher toward our 2nd resistance at 1808.03 which is an area of Fibonacci confluences. Technical indicators are showing bullish momentum.
Areas of consideration:
- 4h 1st resistance at 1791.28
- 4h 1st support at 1774.46
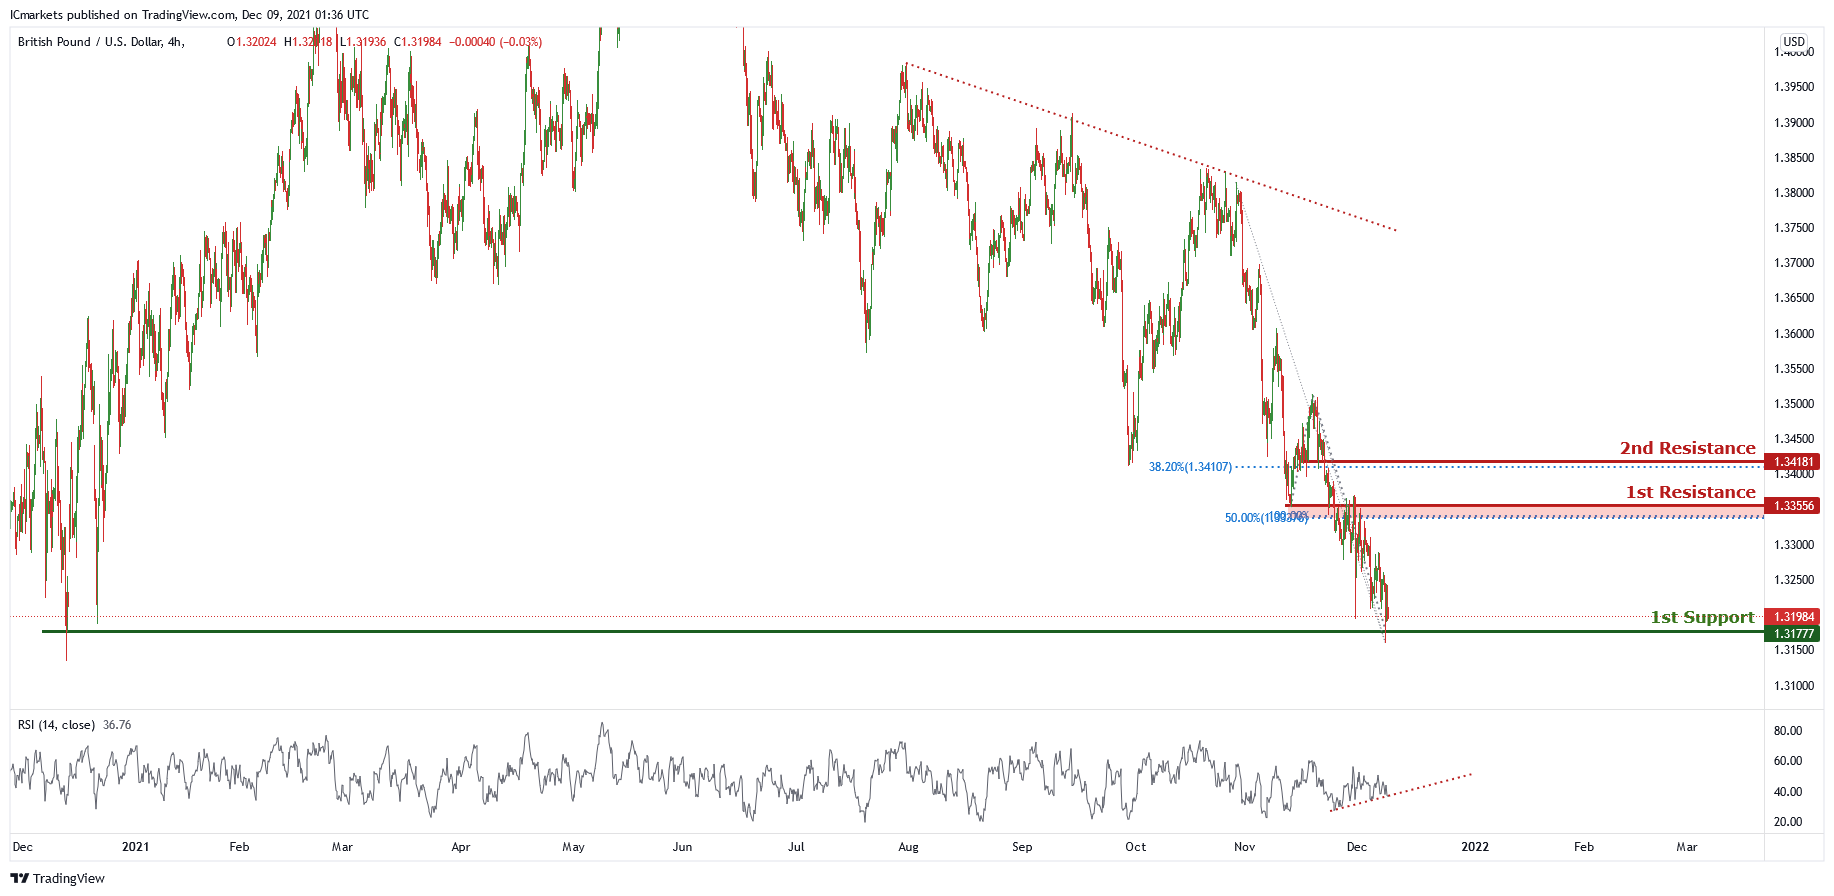
GBP/USD
On the H4 chart , price is abiding by a descending trendline and is near the first support level of 1.31777 which is also the graphical overlap support. Price can potentially go to the first resistance level of 1.33556 which is also 100% Fibonacci projection and 50% Fibonacci retracement. Our bullish bias is supported by RSI indicator as it is abiding by the ascending trendline
Areas of consideration :
- H4 1st resistance at 1.33556
- H4 1st support at 1.31777
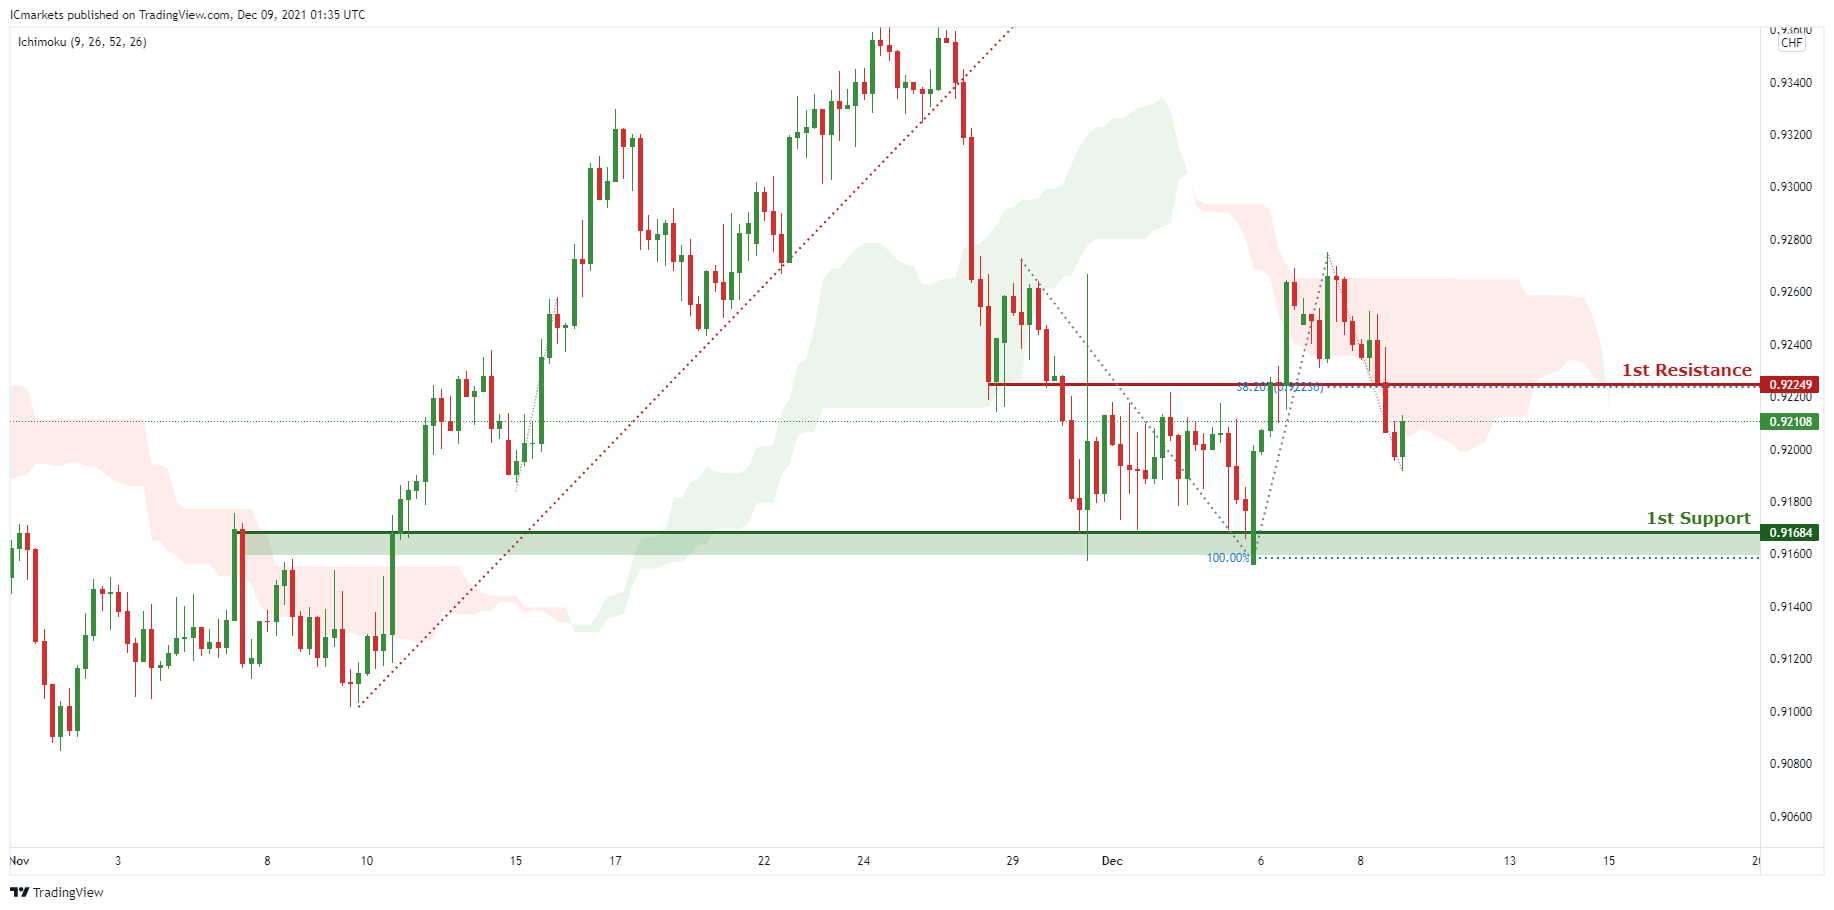
USD/CHF
In reference to yesterday’s analysis, price indeed dropped to 1st Support at 0.91684. On the H4 timeframe, we can expect price to drop from 1st Resistance in line with 38.2% Fibonacci retracement toward 1st Support in line with 100% Fibonacci projection. Our bearish bias is further supported by the Ichimoku cloud indicator where price is holding below it. Traders should wait for prices to swing higher or lower before entering. Traders should wait for price to swing higher or lower to enter.
Areas of consideration:
- Watch 1st Support at 0.91684
- Watch 1st Resistance at 0.92249
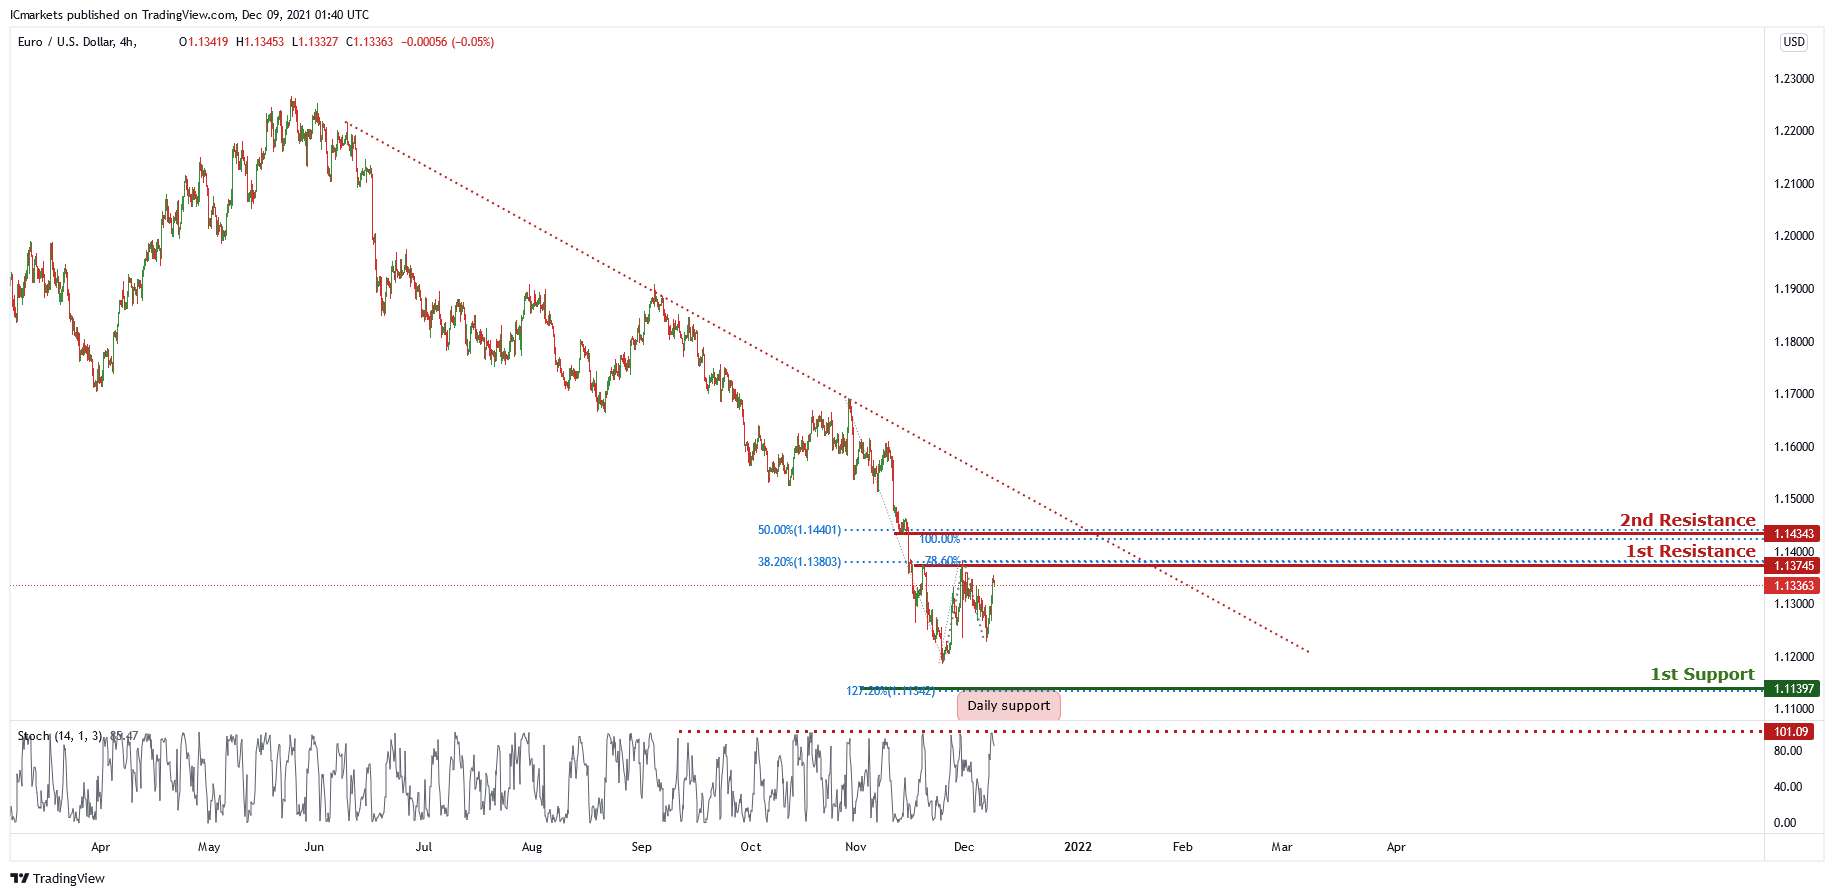
EUR/USD :
On the H4 chart price is abiding by the descending trendline and near the first resistance level of 1.13745 which is also 38.2% Fibonacci retracement and 78.6% Fibonacci projection. Price can potentially dip to the first support which is also the daily support level and Fibonacci retracement level of 127.2%. Our bearish bias is supported by the stochastic indicator as it is at resistance level.
Areas of consideration :
- H4 first resistance at 1.13745
- H4 1st support at 1.11397
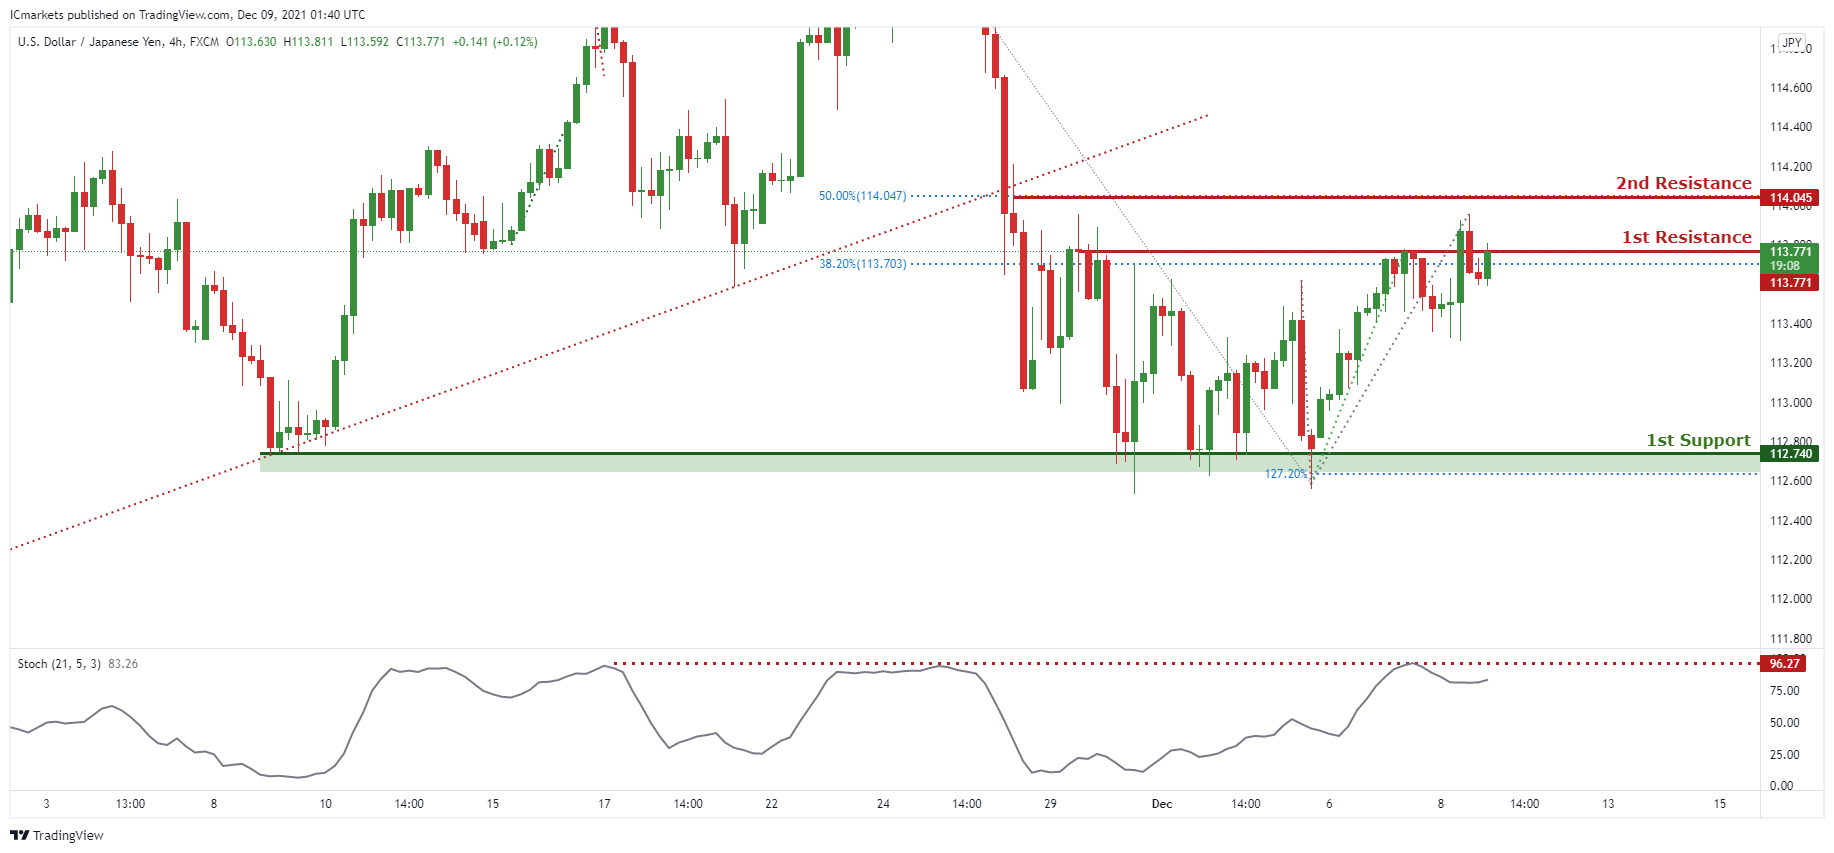
USD/JPY
On the H4 timeframe, price broke out of the ascending trendline support, signifying a bearish momentum. We can expect price to drop from 1st Resistance in line with 38.2% Fibonacci retracement to the 1st Support in line with 127.7% Fibonacci projection and horizontal support. Our bearish bias is further supported by the stochastic indicator where the %K line is at the resistance level.
Areas of consideration:
- H4 1st resistance level 113.559
- H4 1st support level 112.740
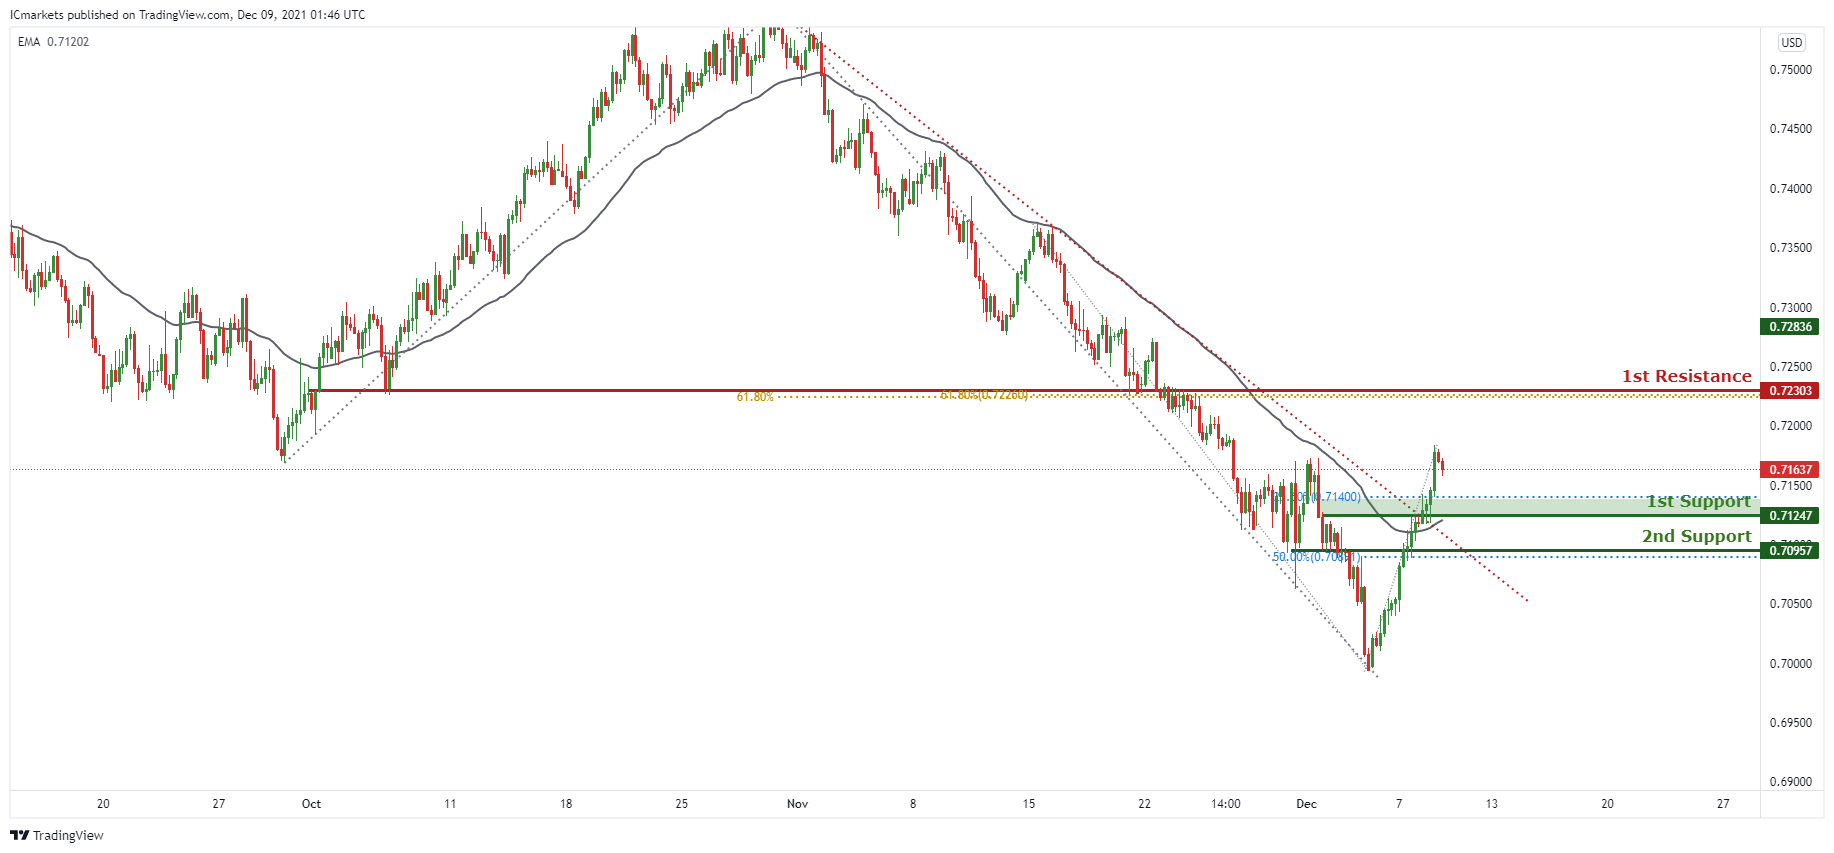
AUD/USD:
On the H4, price has broken out of the descending trendline resistance, signifying bullish momentum. We can expect price to bounce from 1st Support in line with 23.6% Fibonacci retracement towards 1st Resistance in line with 61.8% Fibonacci projection and 61.8% Fibonacci retracement. Our bullish bias is further supported by the EMA period 50 acting as a support.
Areas of consideration:
- H4 1st Support level 0.71247
- H4 1st resistance level 0.72303
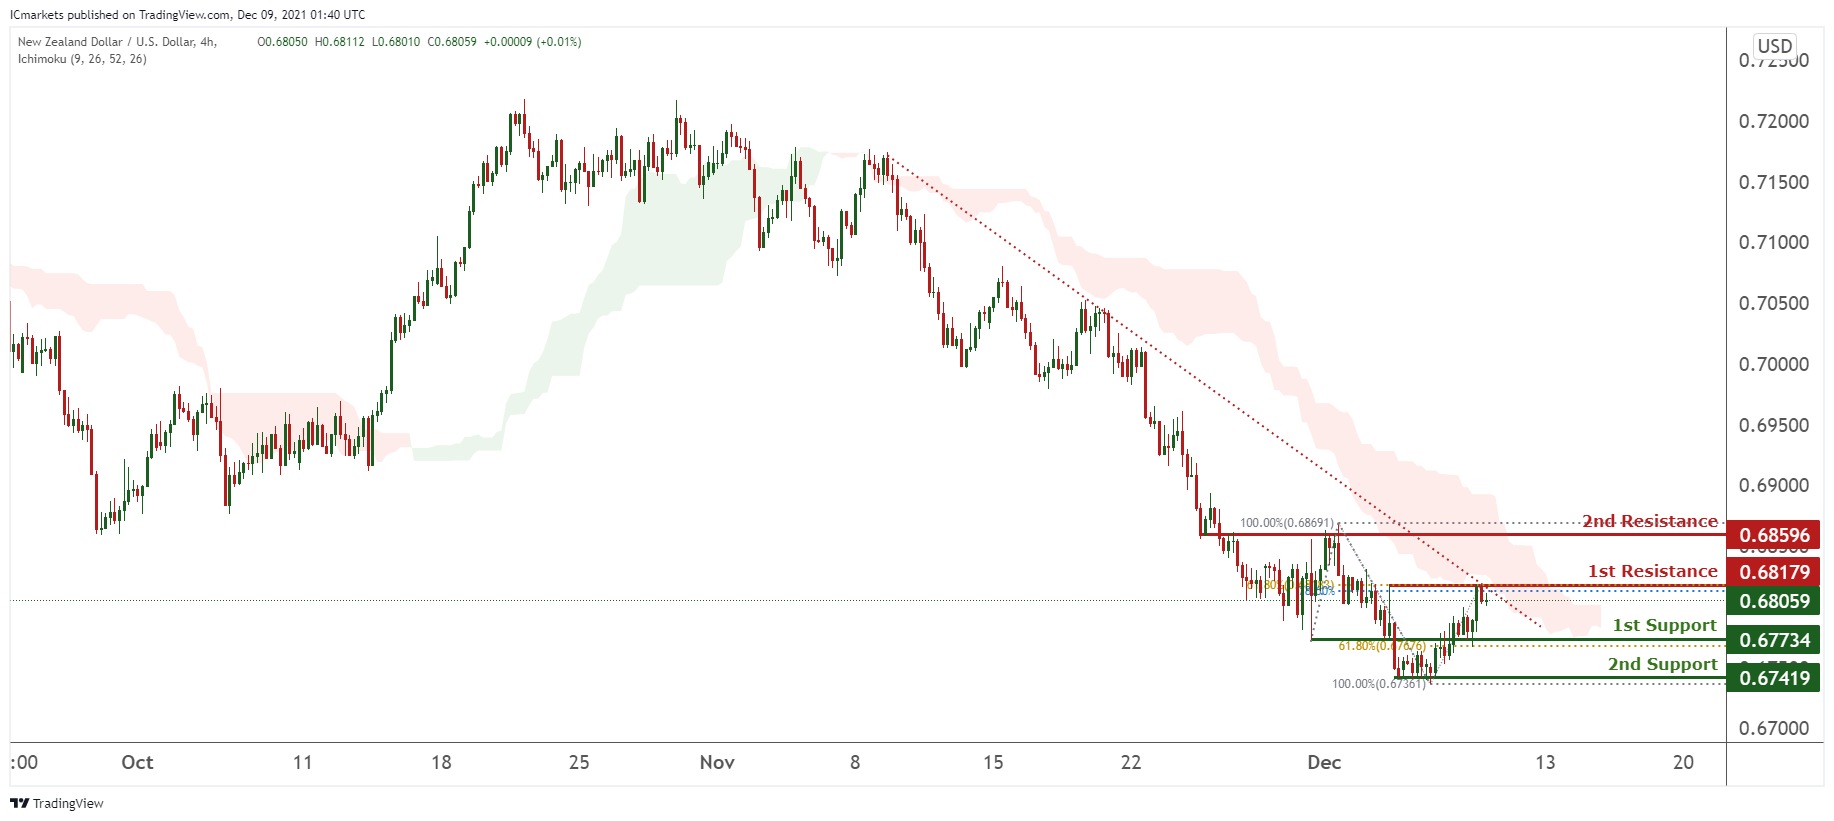
NZD/USD:
On the H4 timeframe, prices are on bearish momentum. We see potential for prices to dip from our 1st resistance at 0.68179 in line with 61.8% Fibonacci extension and 78.6% Fibonacci retracement towards our 1st support at 0.67734 which is a graphical overlap and in line with 61.8% Fibonacci retracement. If prices break our 1st support, prices can potentially dip further towards our 2nd support at 0.67419 in line with 100% Fibonacci retracement. Technical indicators are showing bearish momentum.
Areas of consideration:
- H4 time frame, 1st resistance at 0.68179
- H4 time frame, 1st support at 0.67734
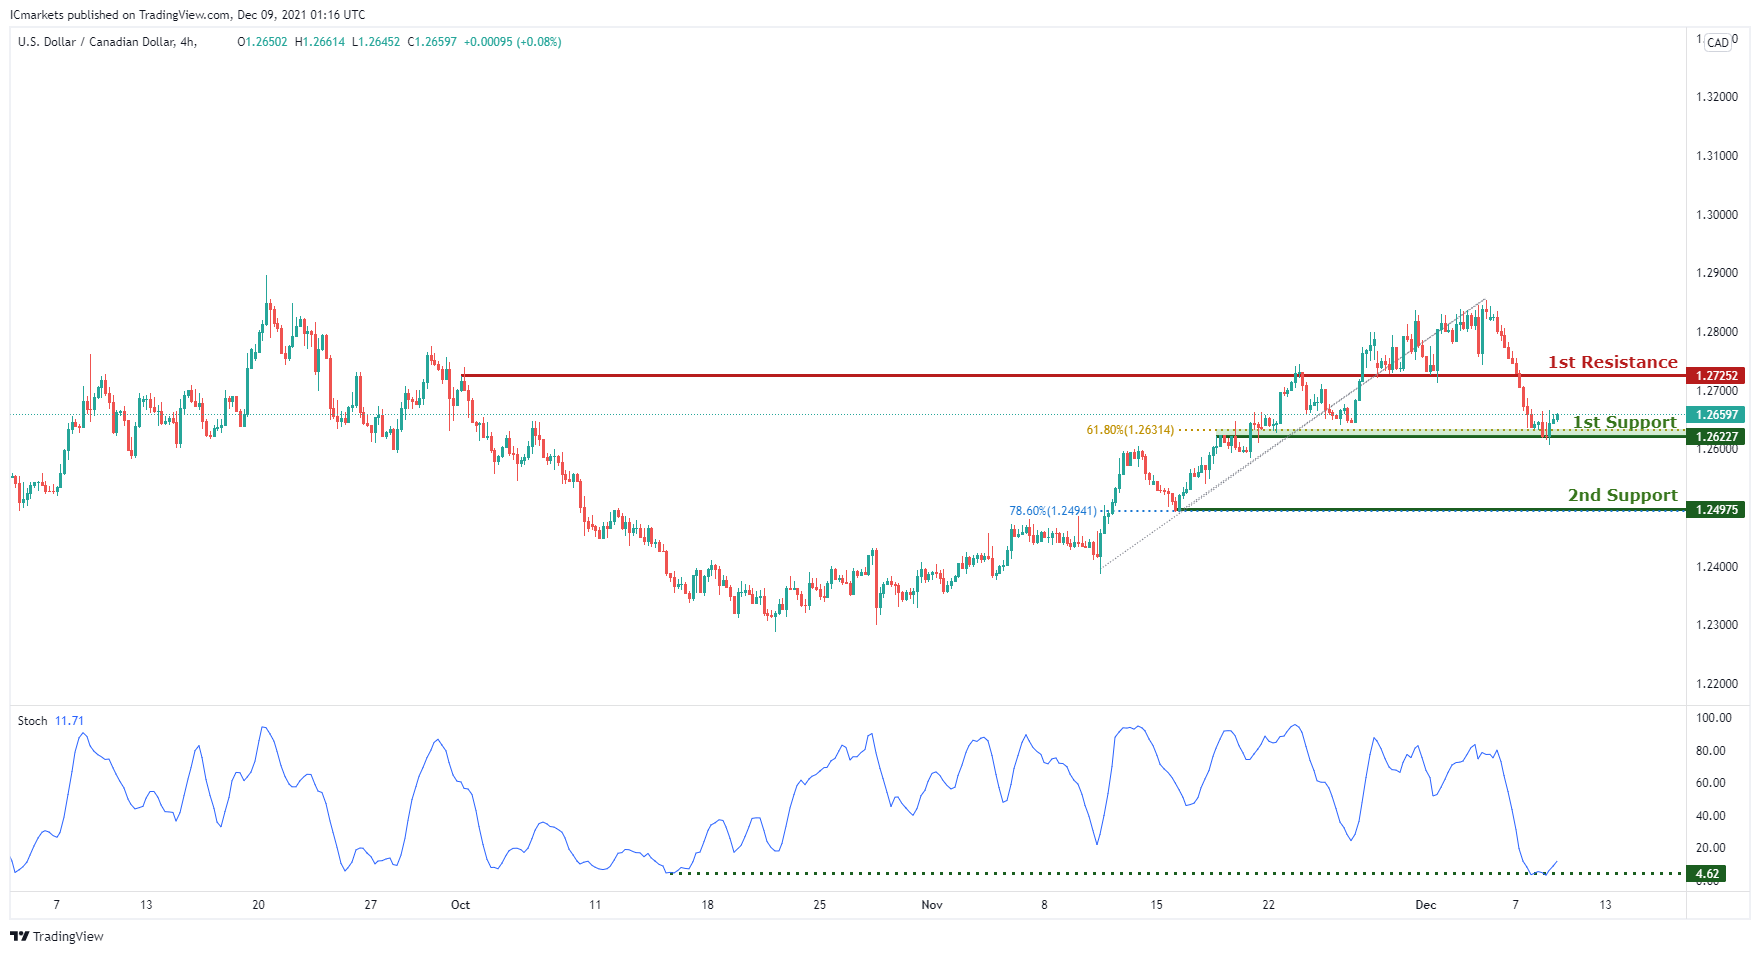
USD/CAD:
On the H4, with price approaching the support of the stochastics indicator, we have a bullish bias that price will rise from 1st support at 1.26227 in line with the graphical overlap support and 61.8% Fibonacci retracement to 1st resistance at 1.27252 in line with the graphical swing high resistance. Alternatively, we may see price break 1st support structure and head for 2nd support at 1.24975 in line with the horizontal swing low support and 78.6% Fibonacci retracement.
Areas of consideration:
- H4 time frame, support at 26227
- H4 time frame, resistance at 1.27252
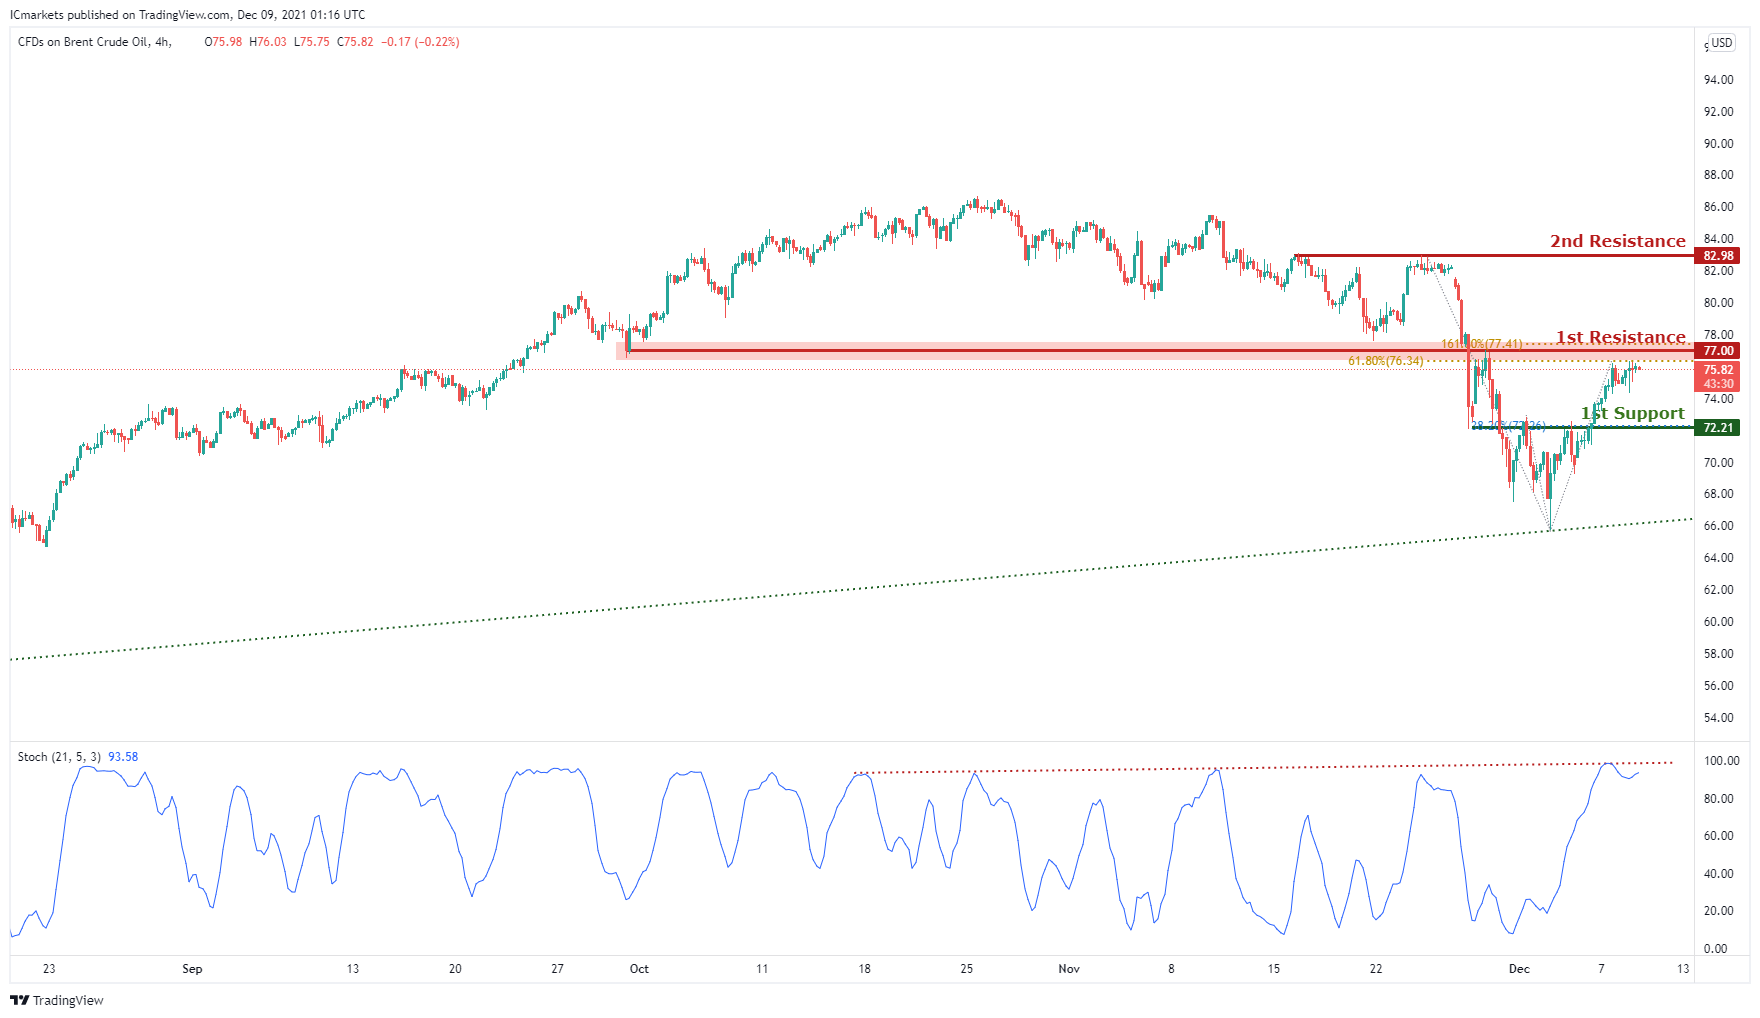
OIL:
On the H4 timeframe, with price rejecting the ascending trendline of the stochastics indicator and the approaching the horizontal graphical level at 1st resistance at 77.00 in line with two 61.8% Fibonacci retracements , we have a bearish bias that price will drop from 1st resistance to 1st support at 72.21 in line with the horizontal overlap support and 23.6% Fibonacci retracement. Alternatively, price may break 1st resistance structure and head for 2nd resistance at 82.98 in line with the horizontal swing high resistance.
Areas of consideration:
- H4 time frame, 1st resistance of 77.00
- H4 time frame, 1st support of 21
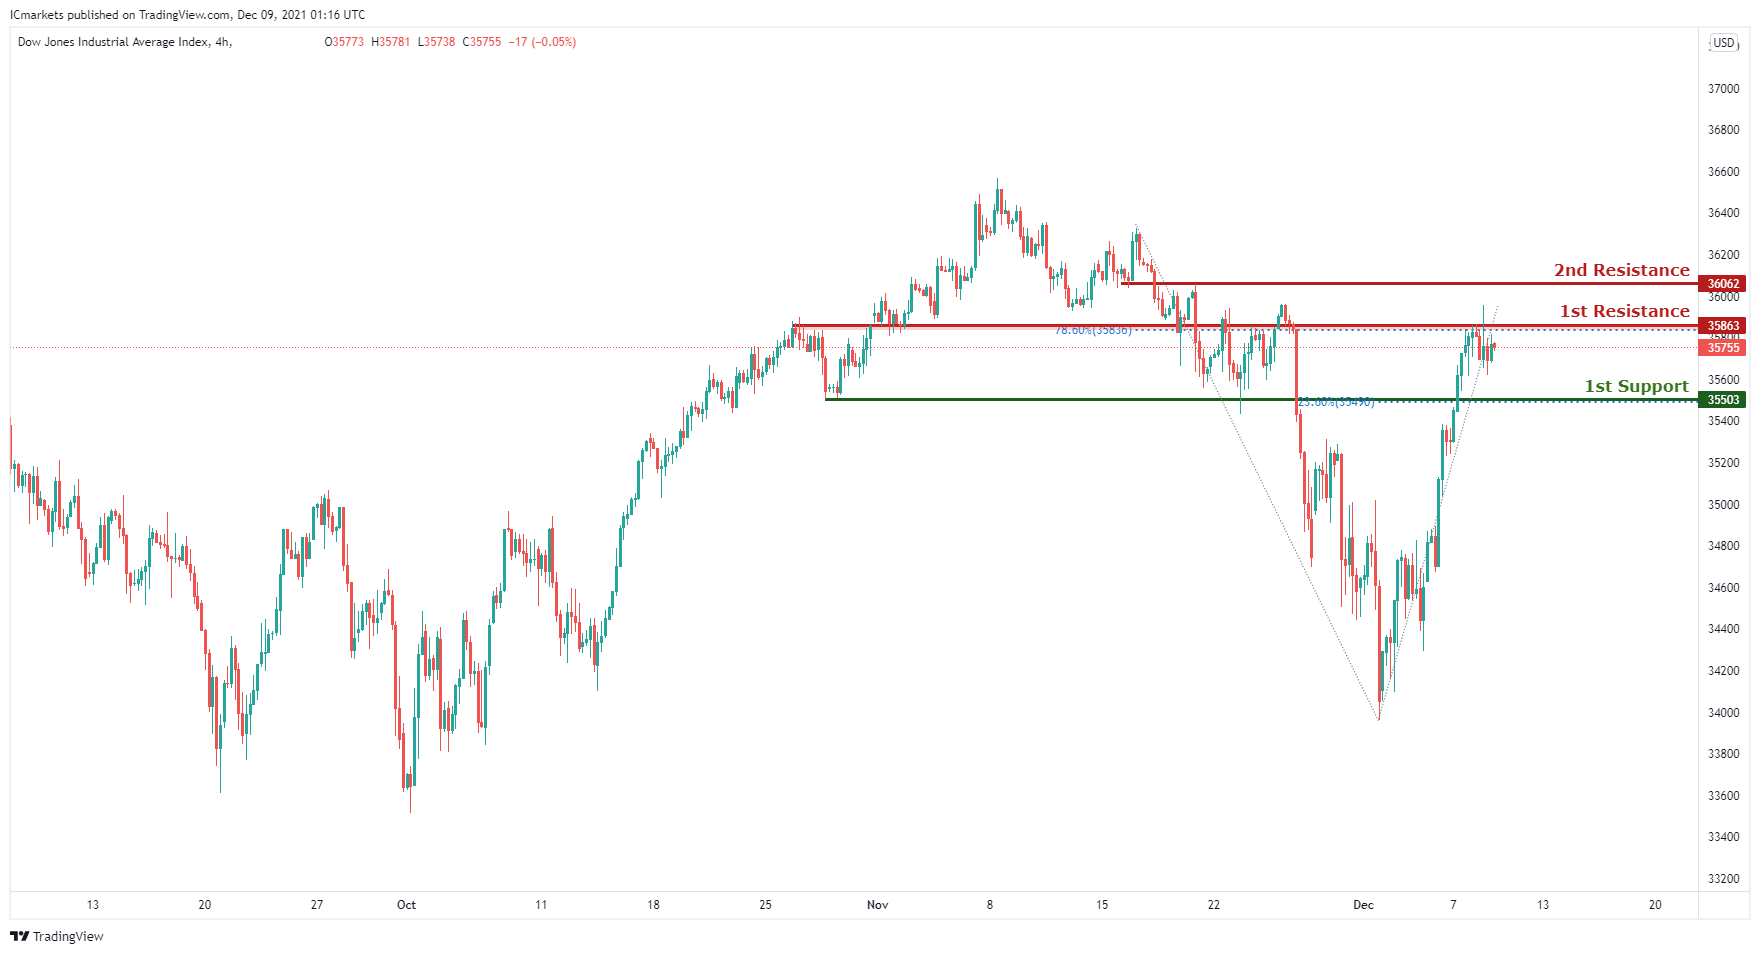
Dow Jones Industrial Average:
On the H4, with approaching the resistance of the stochastics indicator and the horizontal graphical level, we have a bearish bias that price will drop to 1st support at 35503 in line with the horizontal overlap support from 1st resistance at 35863 in line with the 78.6% Fibonacci retracement. Alternatively, price may break 1st resistance structure and head for 2nd resistance at 36062 in line with the horizontal swing high resistance.
- 4H resistance at 35863
- 4H support at 35503
The accuracy, completeness and timeliness of the information contained on this site cannot be guaranteed. IC Markets does not warranty, guarantee or make any representations, or assume any liability regarding financial results based on the use of the information in the site.
News, views, opinions, recommendations and other information obtained from sources outside of www.icmarkets.com.au, used in this site are believed to be reliable, but we cannot guarantee their accuracy or completeness. All such information is subject to change at any time without notice. IC Markets assumes no responsibility for the content of any linked site.
The fact that such links may exist does not indicate approval or endorsement of any material contained on any linked site. IC Markets is not liable for any harm caused by the transmission, through accessing the services or information on this site, of a computer virus, or other computer code or programming device that might be used to access, delete, damage, disable, disrupt or otherwise impede in any manner, the operation of the site or of any user’s software, hardware, data or property.


