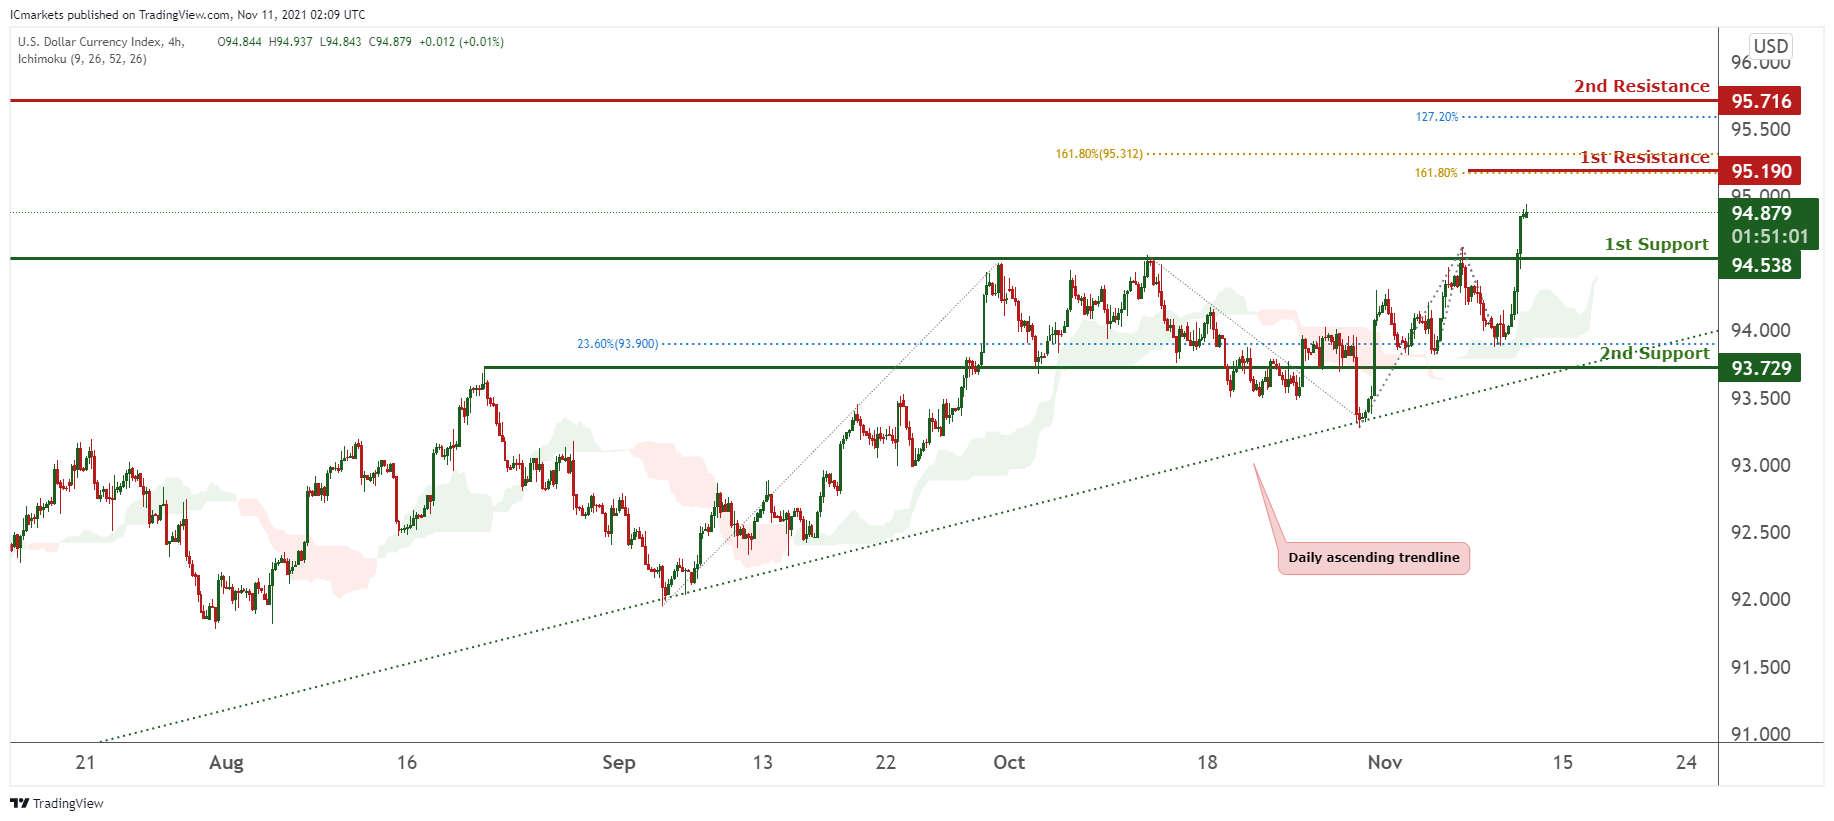
DXY:
On the H4 timeframe, prices are on a bullish momentum and abiding to a daily ascending trendline. We see the potential for prices to continue to climb towards our 1st resistance at 95.190 in line with 161.8% Fibonacci extension and 161.8% Fibonacci projection. Technical indicators are showing bullish momentum. Alternatively, prices might retest our 1st support at 94.538 which is a graphical overlap.
Areas of consideration:
● H4 time frame, 1st resistance at 95.190
● H4 time frame, 1st support at 94.538
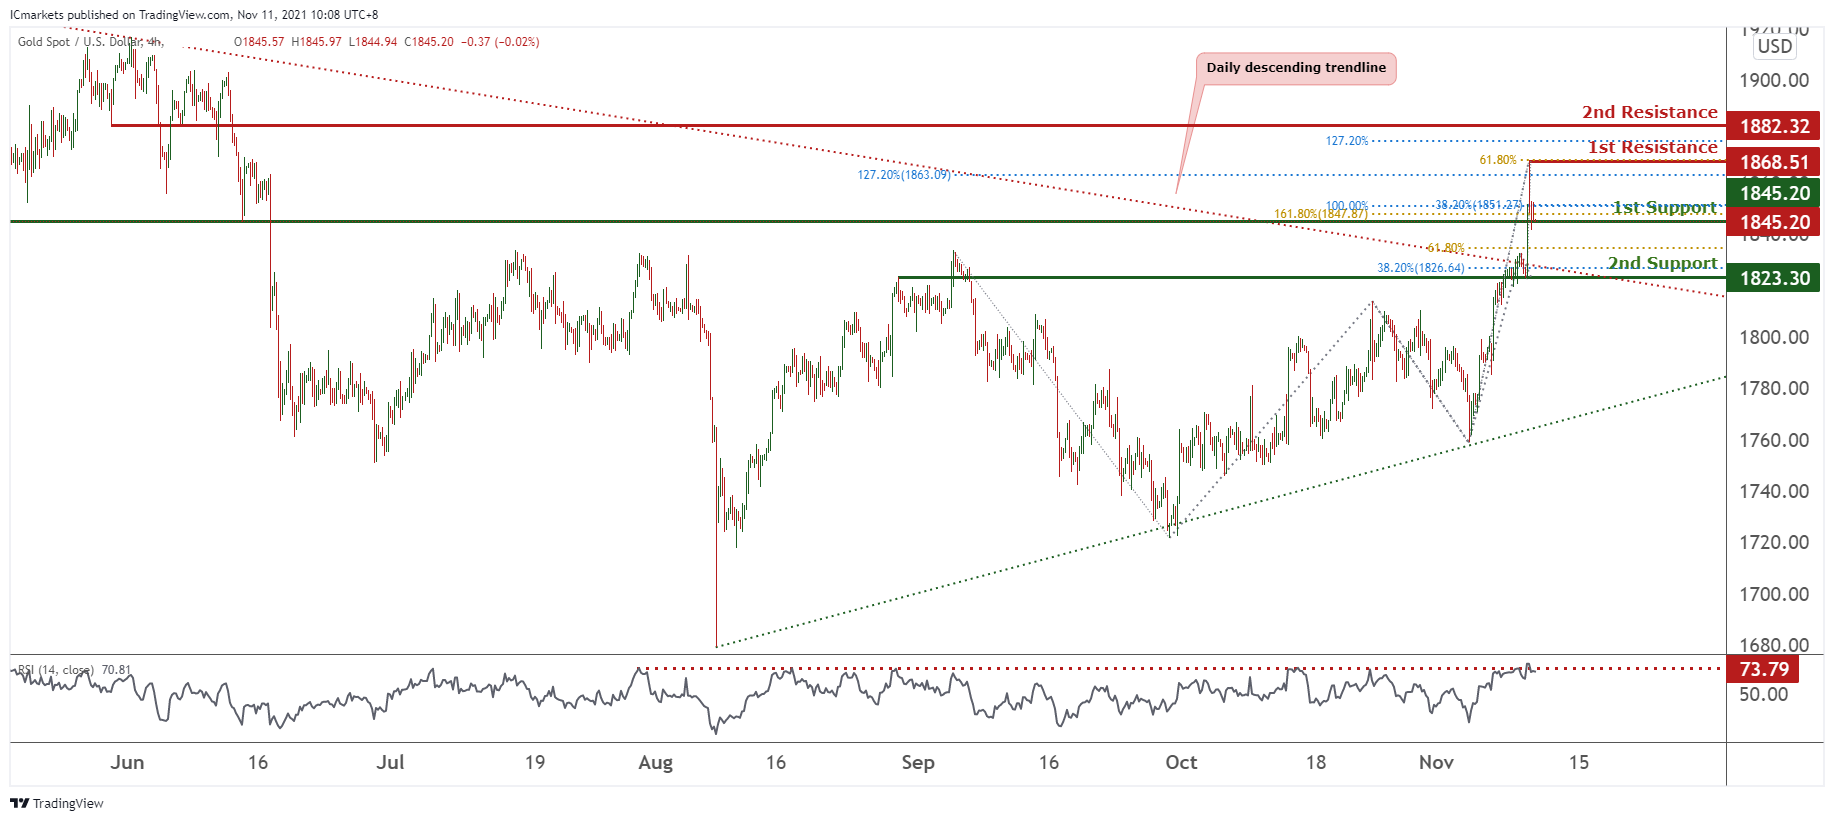
XAU/USD (GOLD):
On the H4 chart, prices are abiding to a daily triangle. We see potential for prices to dip from our 1st resistance at 1868.51 in line with 61.8% Fibonacci retracement and 127.2% Fibonacci extension towards our 1st support at 1845.2 which is an area of Fibonacci confluences. Technical indicators are showing bearish momentum. Alternatively, breaking our 1st resistance will find prices climbing further towards our 2nd resistance at 1882.32 in line with 127.2% Fibonacci extension.
Areas of consideration:
● 4h 1st support at 1845.2
● 4h 1st resistance at 1868.51
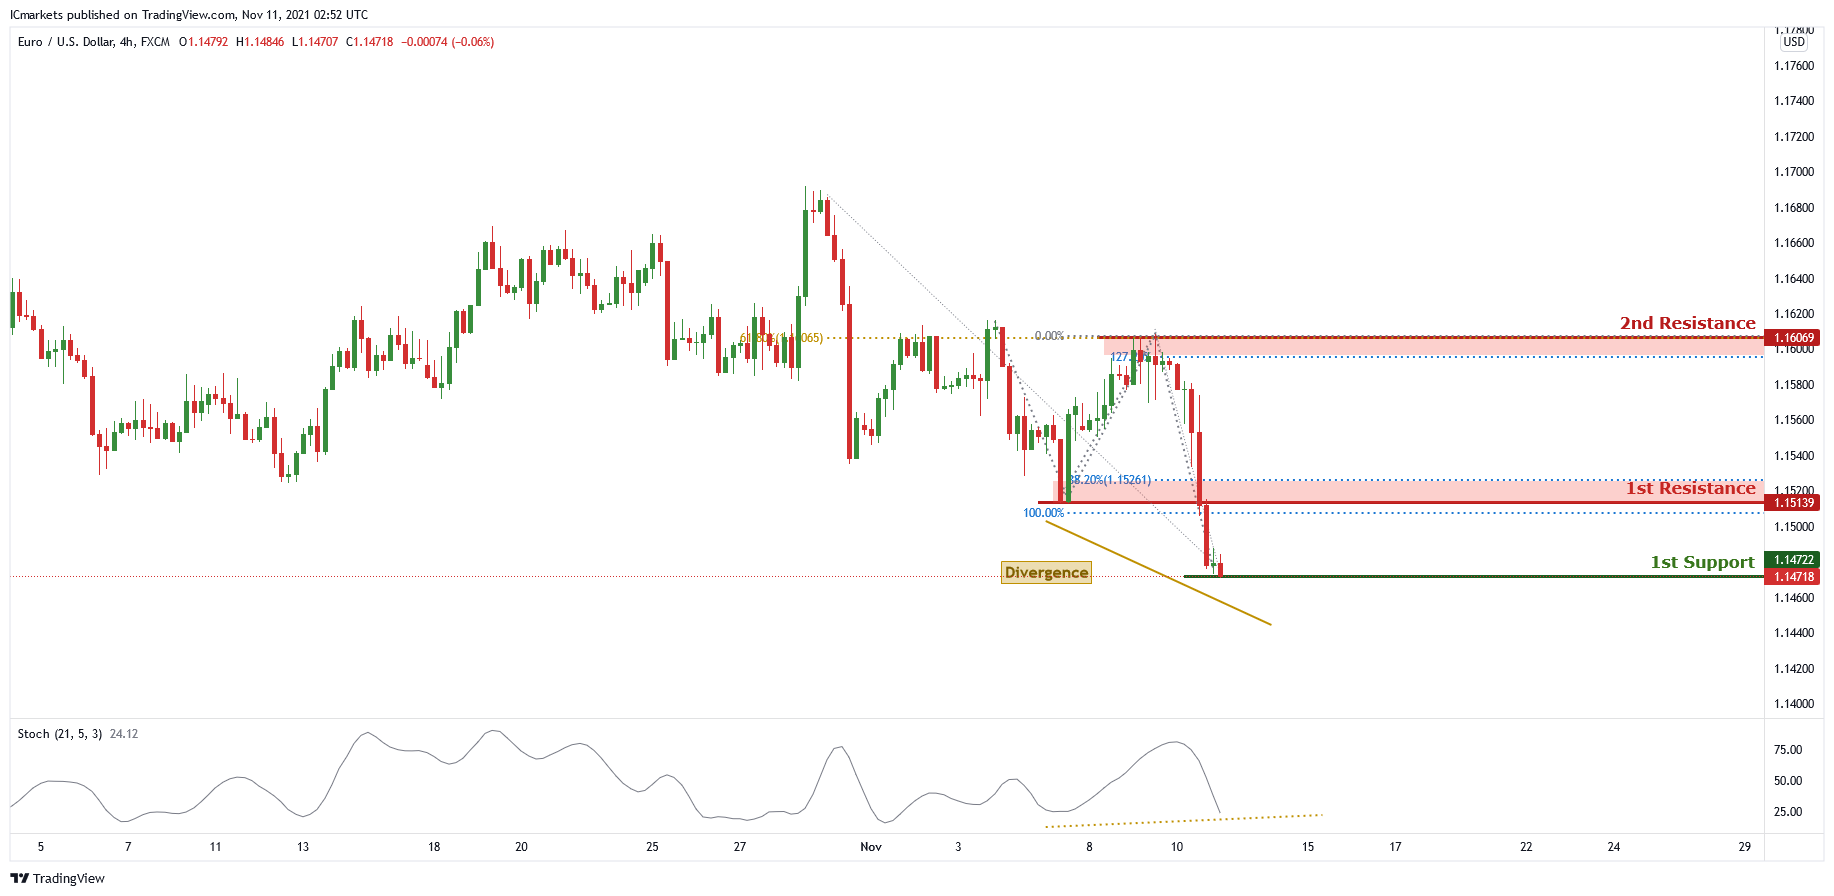
EUR/USD:
On the H4 chart, price is near the first support level of 1.14750 which is the graphical swing low level. Price can potentially go to the first resistance of 1.15139 which is 38.2% Fibonacci retracement and 100% Fibonacci projection. Oue bullish bias is supported by a stochastic indicator as it is near support level.
Areas of consideration :
H4 first resistance – 1.15139
H4 second resistance – 1.16069
H4 first support – 1.14750
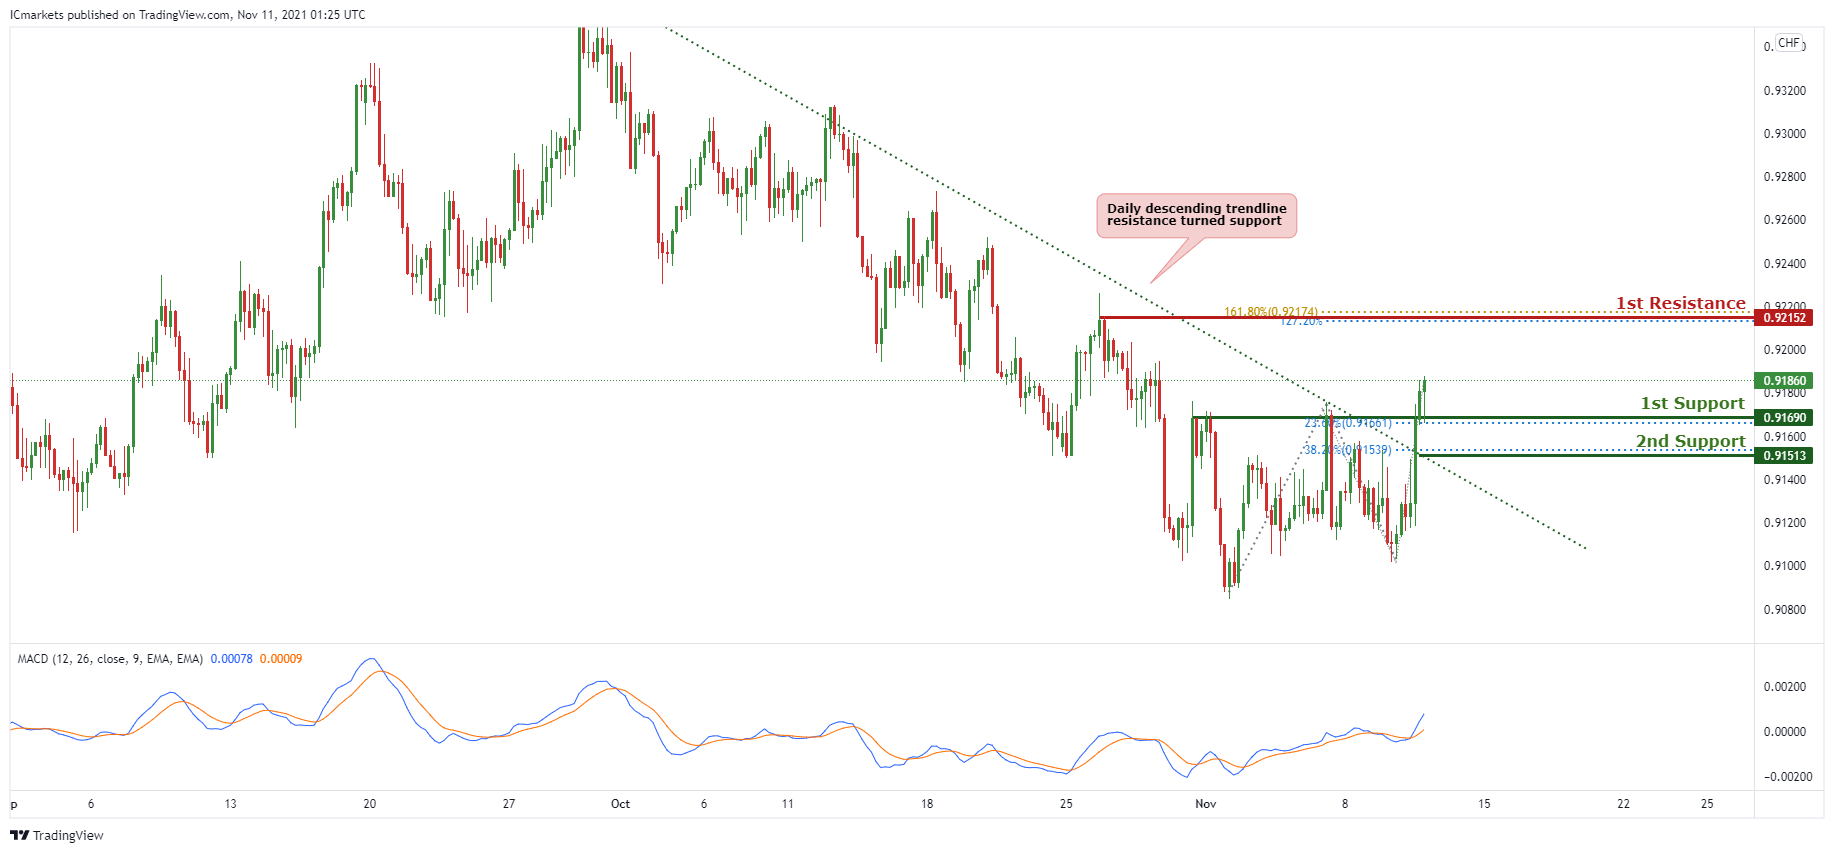
USD/CHF:
In reference to yesterday’s analysis, price indeed bounced and hit our 1st resistance at 0.91690. On the H4 timeframe, we can see that price have broken out of the descending trendline resistance, signifying a bullish momentum. We can expect price to bounce from 1st Support in line with 23.6% Fibonacci retracement towards 1st Resistance in line with 127.2% Fibonacci projection and 161.8% Fibonacci retracement. Our bullish bias is further supported by MACD indicator where the MACD line crosses above the signal line.
Areas of consideration:
● Watch 1st Support at 0.91690
● Watch 1st Resistance at 0.92152
GBP/USD:
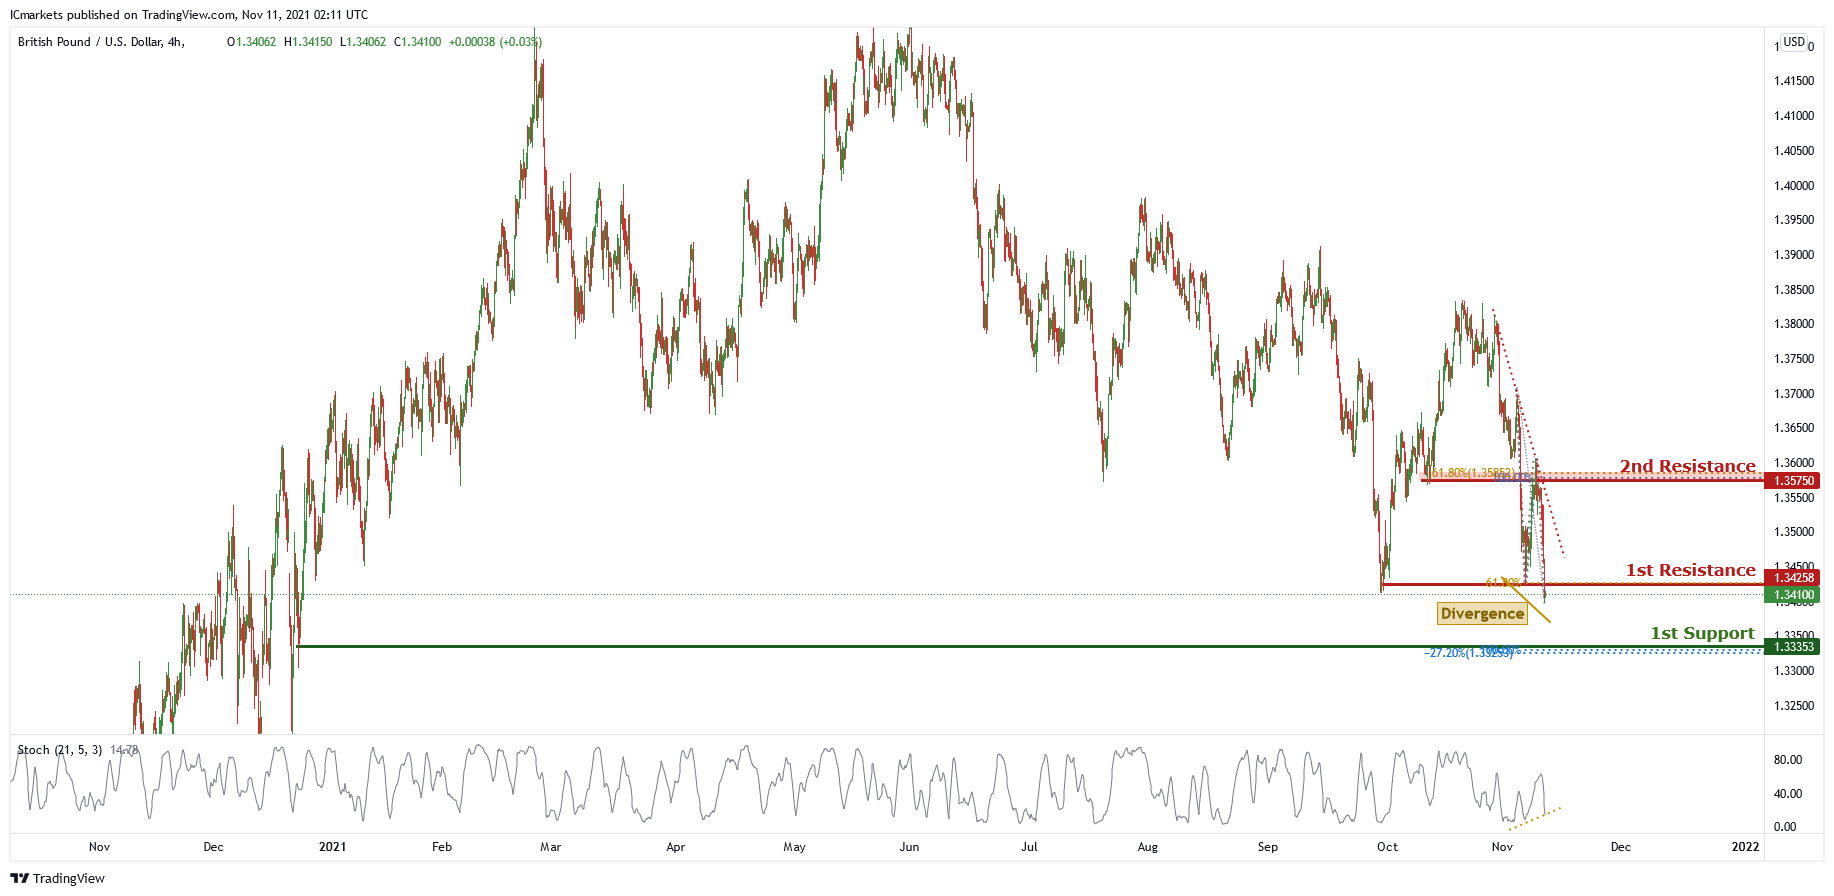
On the H4 chart price is near the first resistance price of 1.34258 which is 61.8% Fibonacci projection projection. Price can potentially go to the 2nd resistance of 1.35750 which is 100% Fibonacci projection and 61.8% Fibonacci retracement. Our bullish bias is supported by RSI indicator as there is a divergence. Alternatively, price can potentially dip to the first support level of 1.33353 which is a graphical overlap support.
Areas of consideration:
H4 first support – 1.33353
H4 first resistance – 1.34528
H4 first support – 1.33353
USD/JPY:
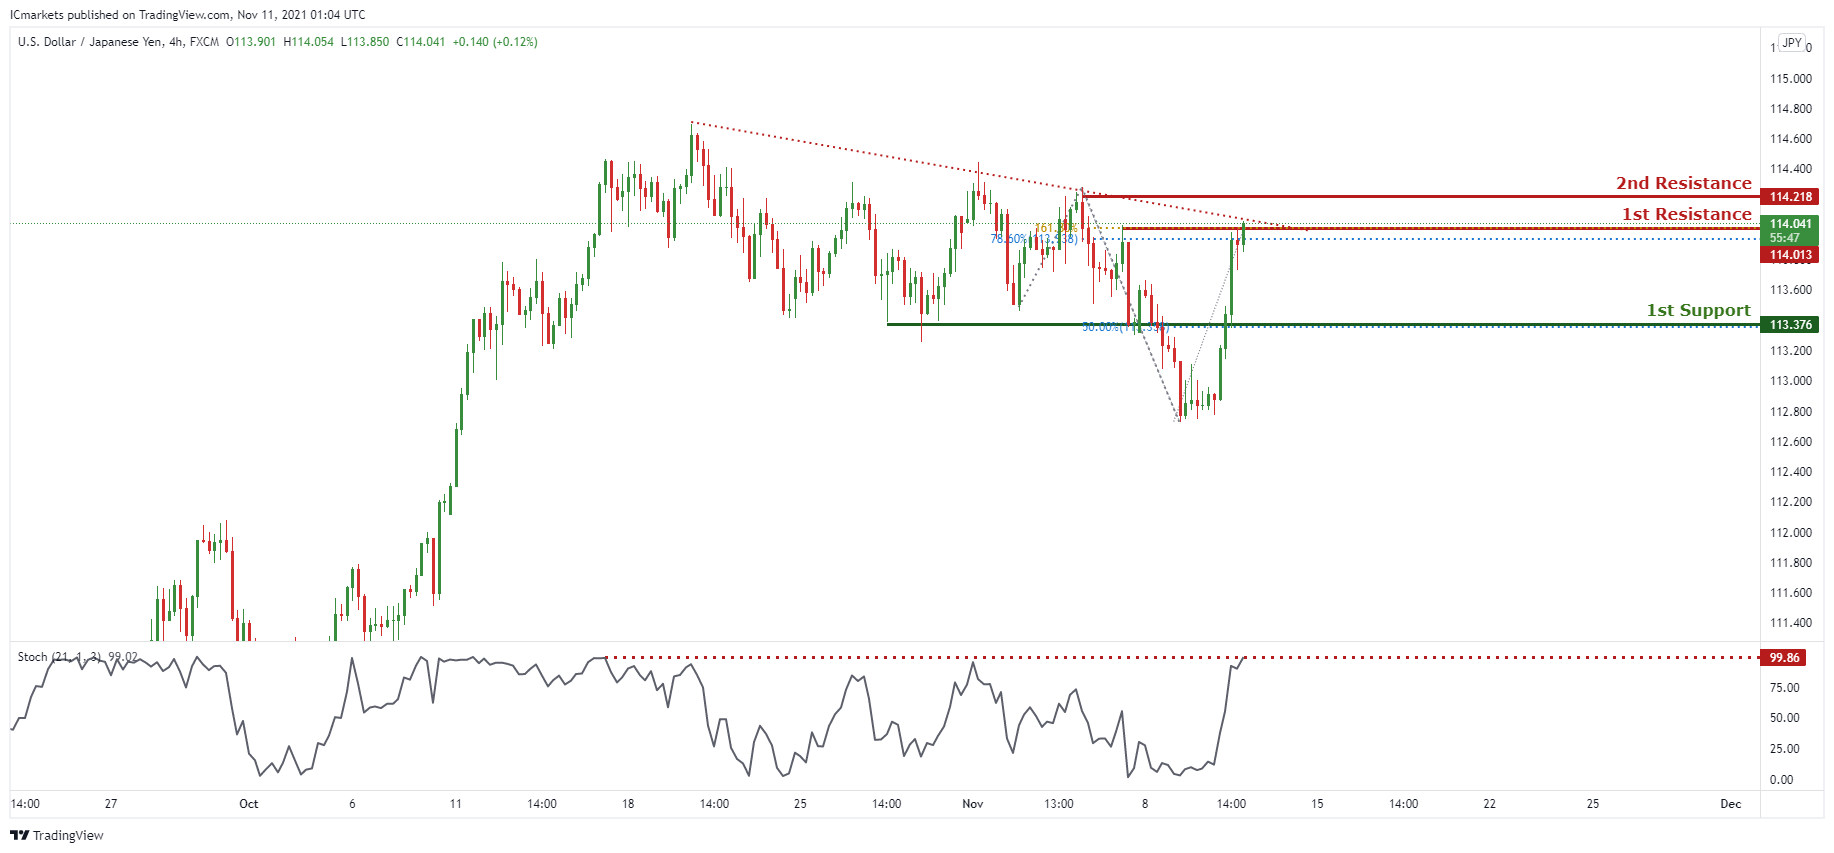
On the H4 timeframe, price is abiding to the descending trendline resistance. In reference to yesterday’s analysis, price indeed bounced to the 1st resistance now we can expect price to make a drop from 1st resistance in line with 161.8% Fibonacci projection and 78.6% Fibonacci retracement towards the 1st Support level in line with 50% Fibonacci retracement. Our bearish bias is further supported by the stochastic indicator where the %K line approaching the resistance level.
Areas of consideration:
● H4 1st resistance level 114.013
● H4 1st support level 113.376
AUD/USD:
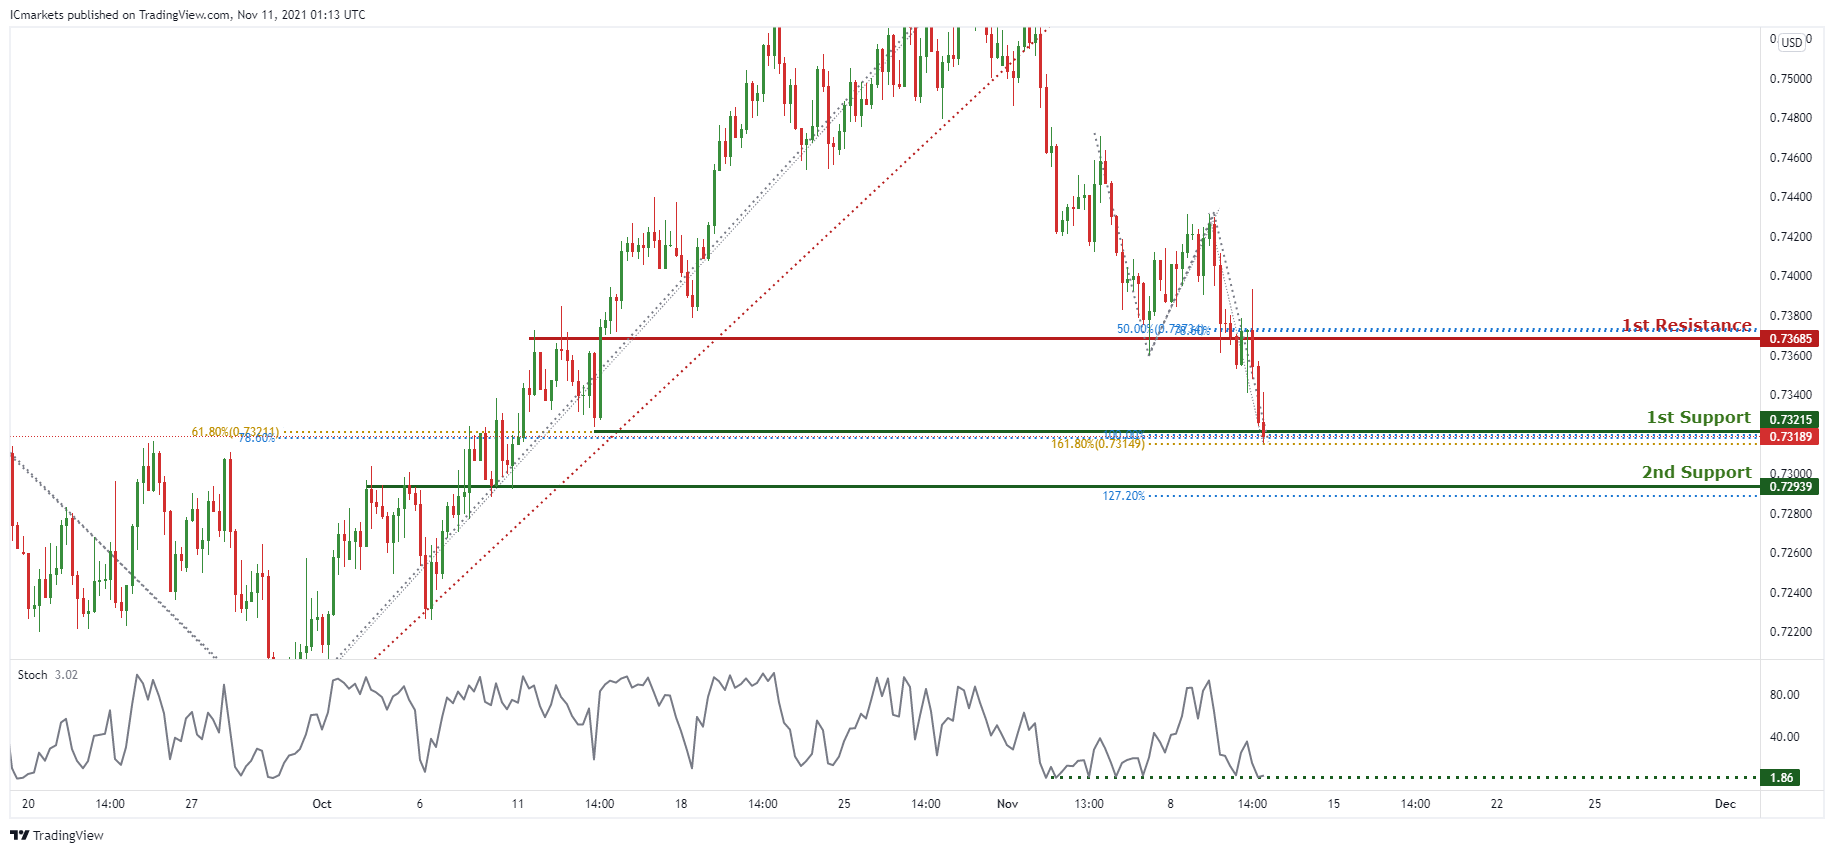
On the H4, we can see that price broke past the ascending trendline support, signifying a bearish trend momentum. However, we can expect a short-term bullish bounce from the 1st Support in line with multiple fibonacci confluence (78.6% Fibonacci projection, 100% Fibonacci projection,61.8% Fibonacci retracement, 161.8% Fibonacci retracement) towards 1st Resistance in line with 50% Fibonacci retracement and 78.6% Fibonacci projection. Our short-term bullish bias is further supported by the stochastic indicator where the %K line bounced at the support level.
Areas of consideration:
● H4 1st resistance level 0.73685
● H4 1st support level 0.73215
NZD/USD:
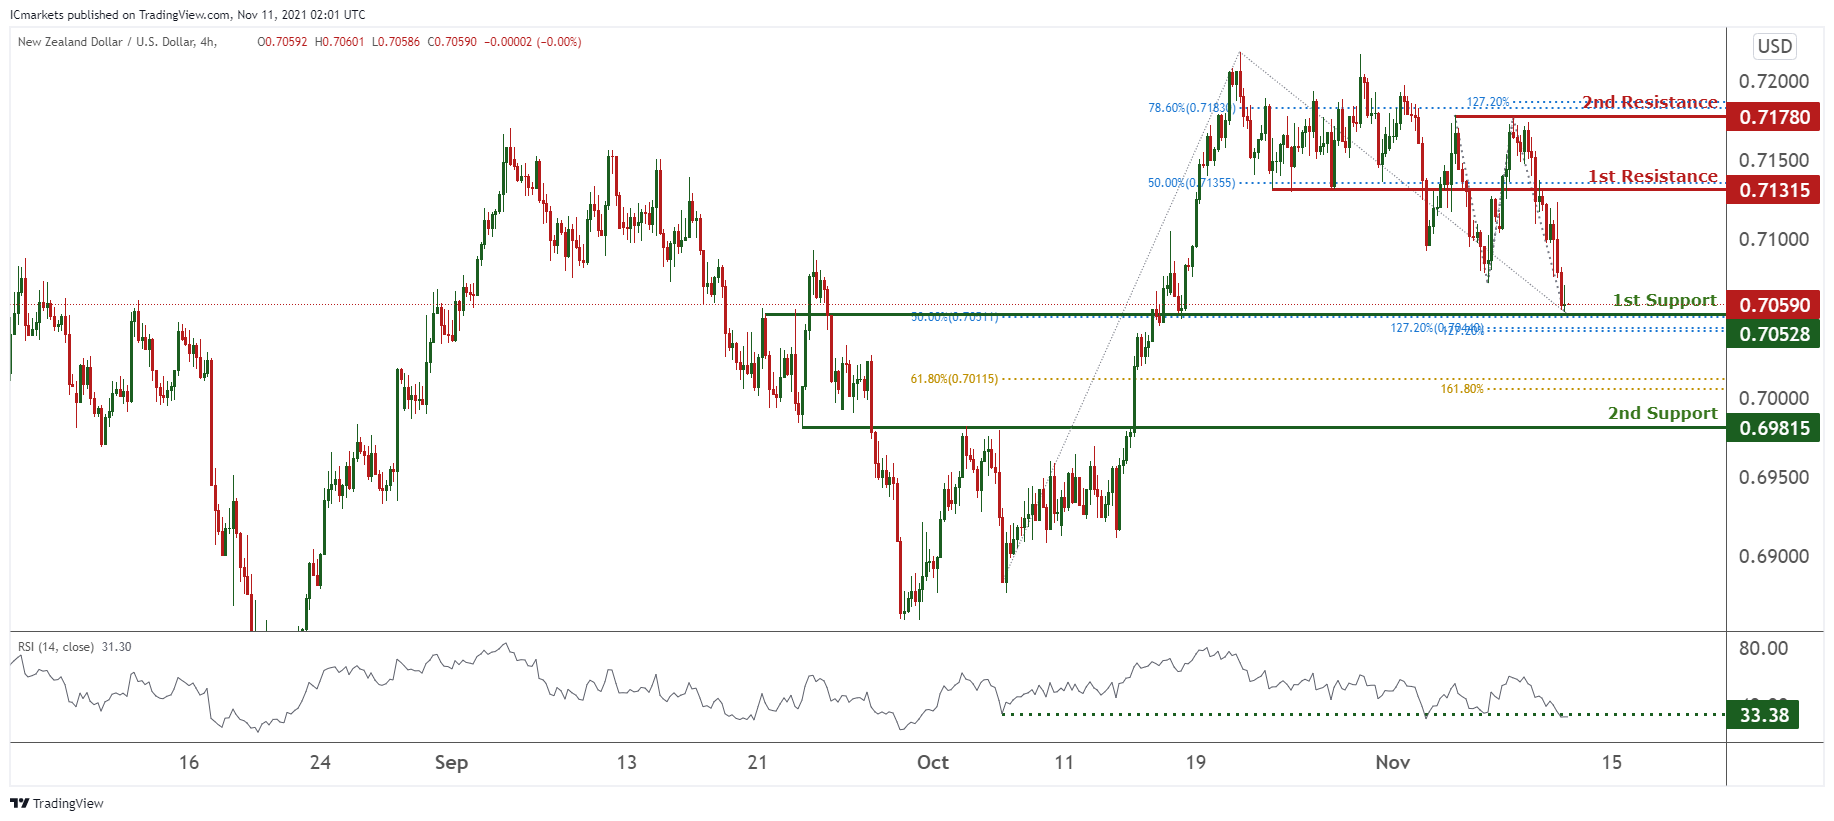
On the H4 timeframe, prices have recently tested our 1st support at 0.70528 which is an area of Fibonacci confluences and we see potential for a bounce towards our 1st resistance at 0.71315 in line with 50% Fibonacci retracement. RSI is at a level where bullish bounces happened previously. Alternatively, breaking our 1st support will find prices dipping towards our 2nd support at 0.69815 which is a graphical overlap.
Areas of consideration:
● H4 time frame, 1st resistance at 0.71315
● H4 time frame, 1st support at 0.70528
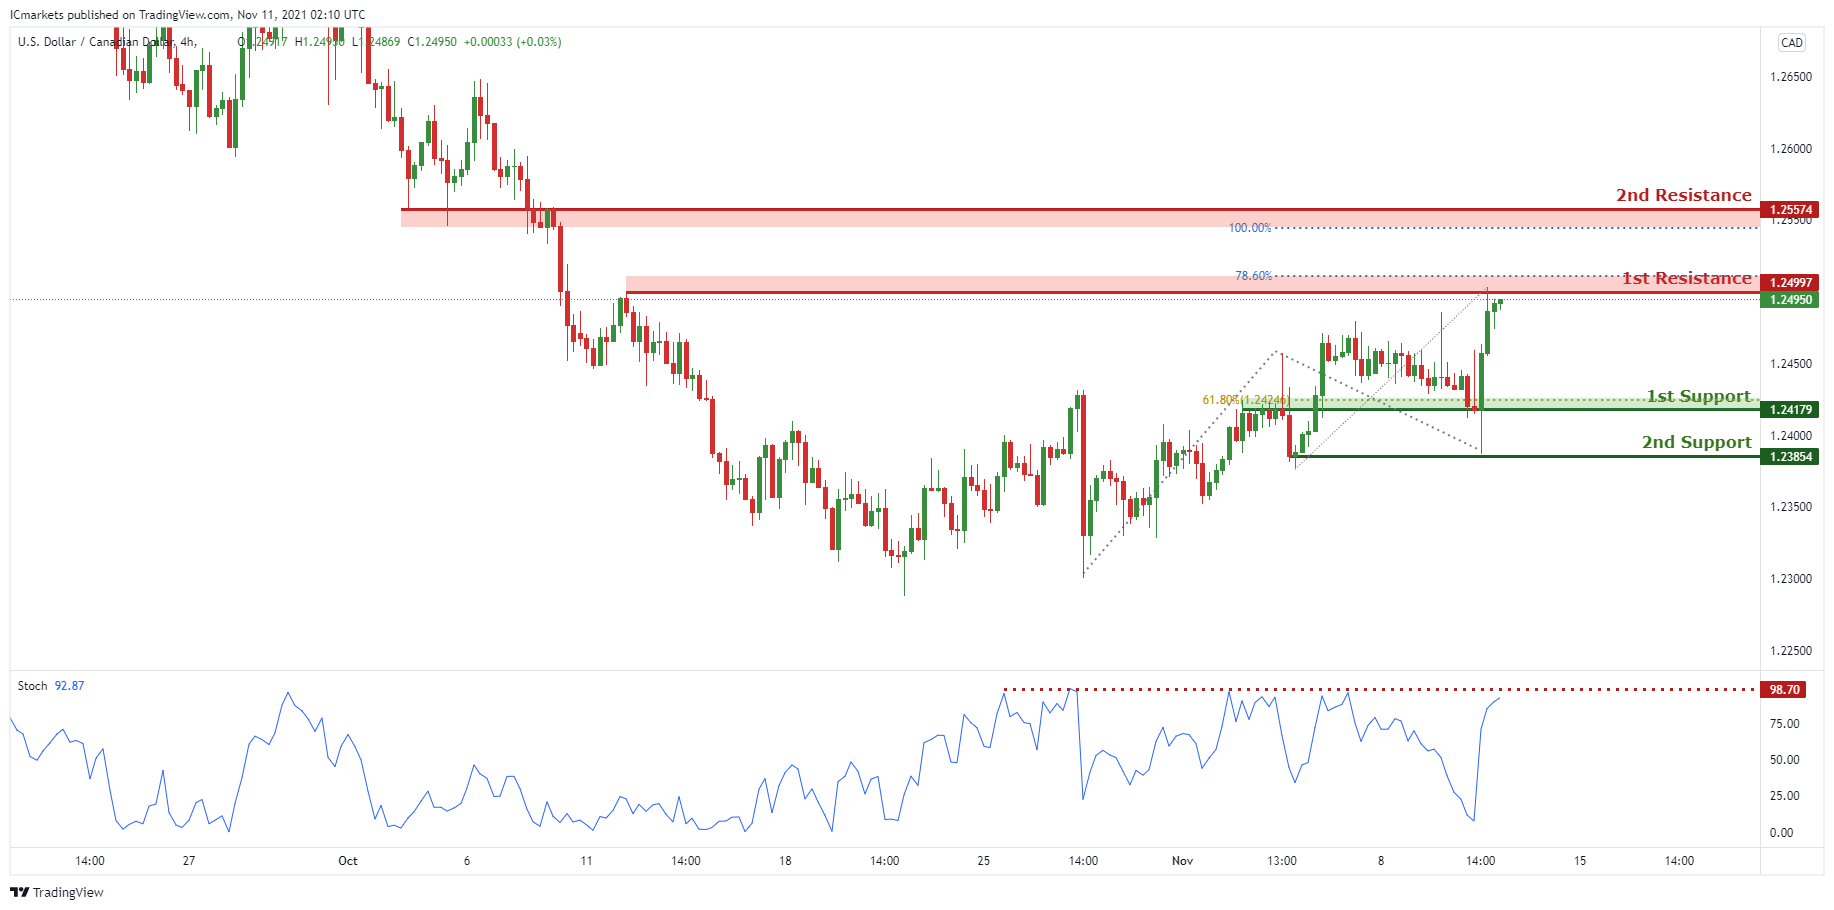
USD/CAD:
On the H4, with price approaching resistance on the stochastics indicator, we have a bearish bias that price will rise from 1st resistance at 1.24997 in line with the 78.6% Fibonacci projection level and the horizontal swing high resistance to 1st support at 1.24179 in line with the graphical swing overlap support and 61.8% Fibonacci retracement and possibly to 2nd support at 1.23854 in line with the horizontal swing low support. Alternatively, we may see price break 1st resistance structure and head for 2nd resistance at 1.25574 in line with the 100% Fibonacci projection level and horizontal overlap resistance.
Areas of consideration:
● H4 time frame, support at 1.24179
● H4 time frame, resistance at 1.24997
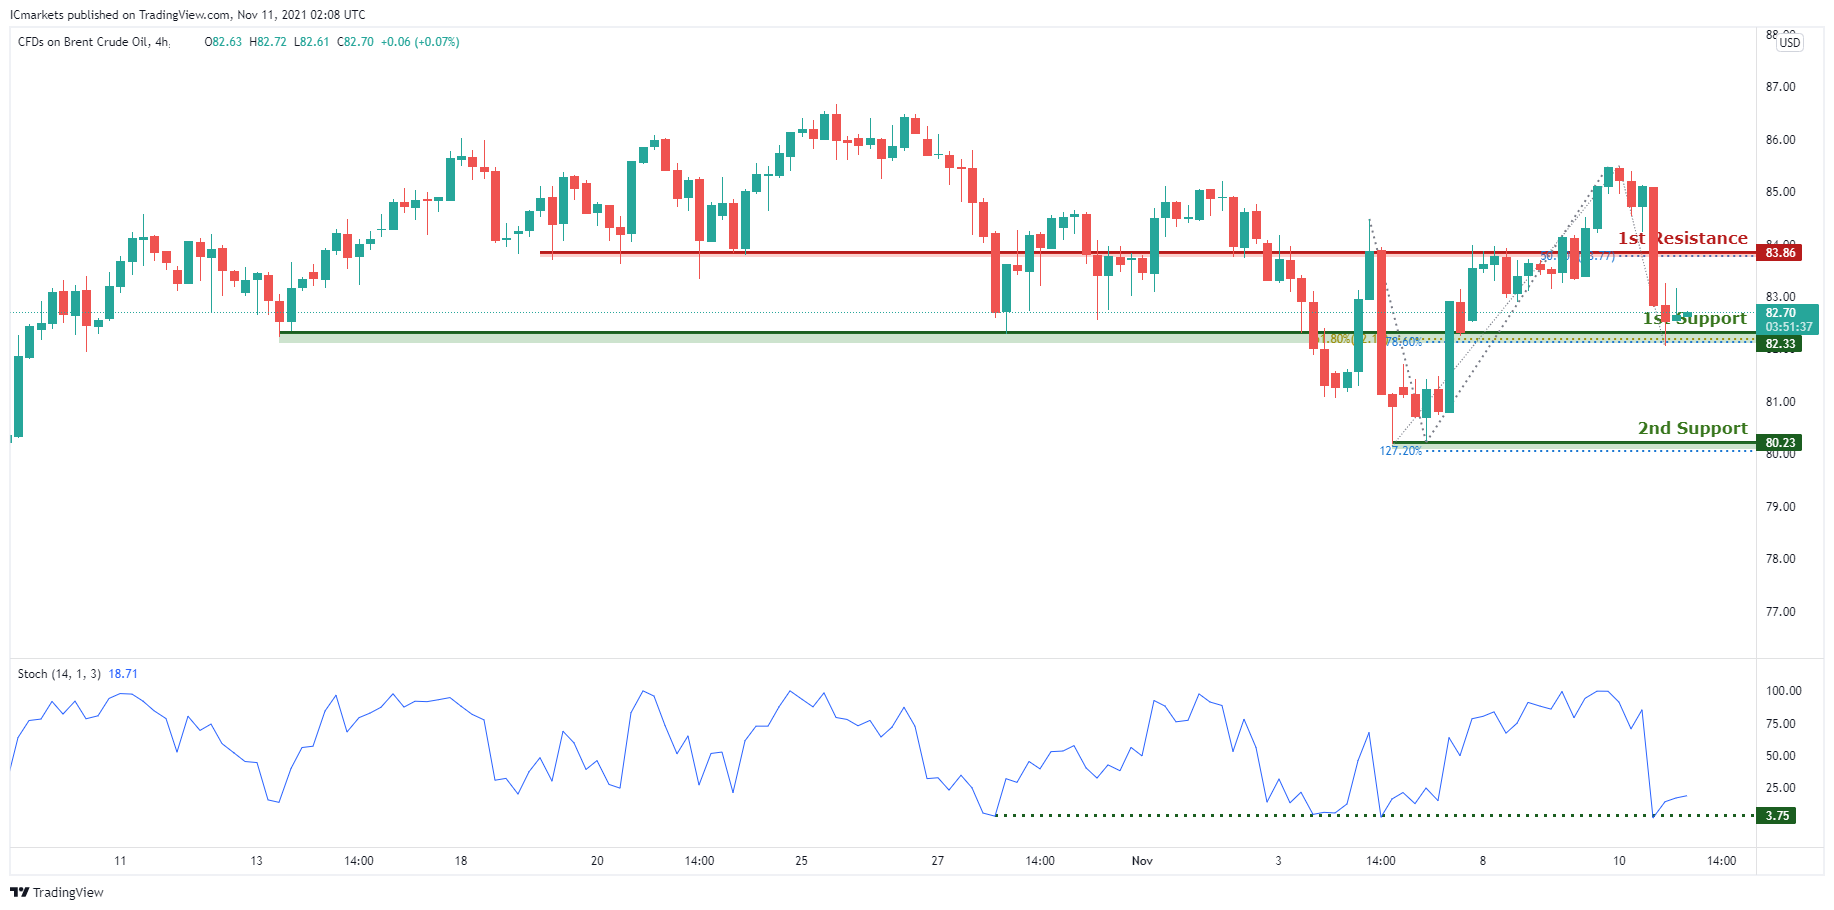
OIL:
On the H4 timeframe,with price bouncing off the stochastics support level, we are expecting a bullish rise to our 1st resistance at 83.86 in line with the 50% Fibonacci retracement level from 1st support at 82.33 in line with our horizontal overlap support, 61.8% Fibonacci retracement level and 78.6% Fibonacci projection level. Alternatively, price may break 1st support and head for 2nd support at 80.23 in line with our 127.2% Fibonacci projection levels.
Areas of consideration:
● H4 time frame, 1st resistance of 83.86
● H4 time frame, 1st support of 82.33
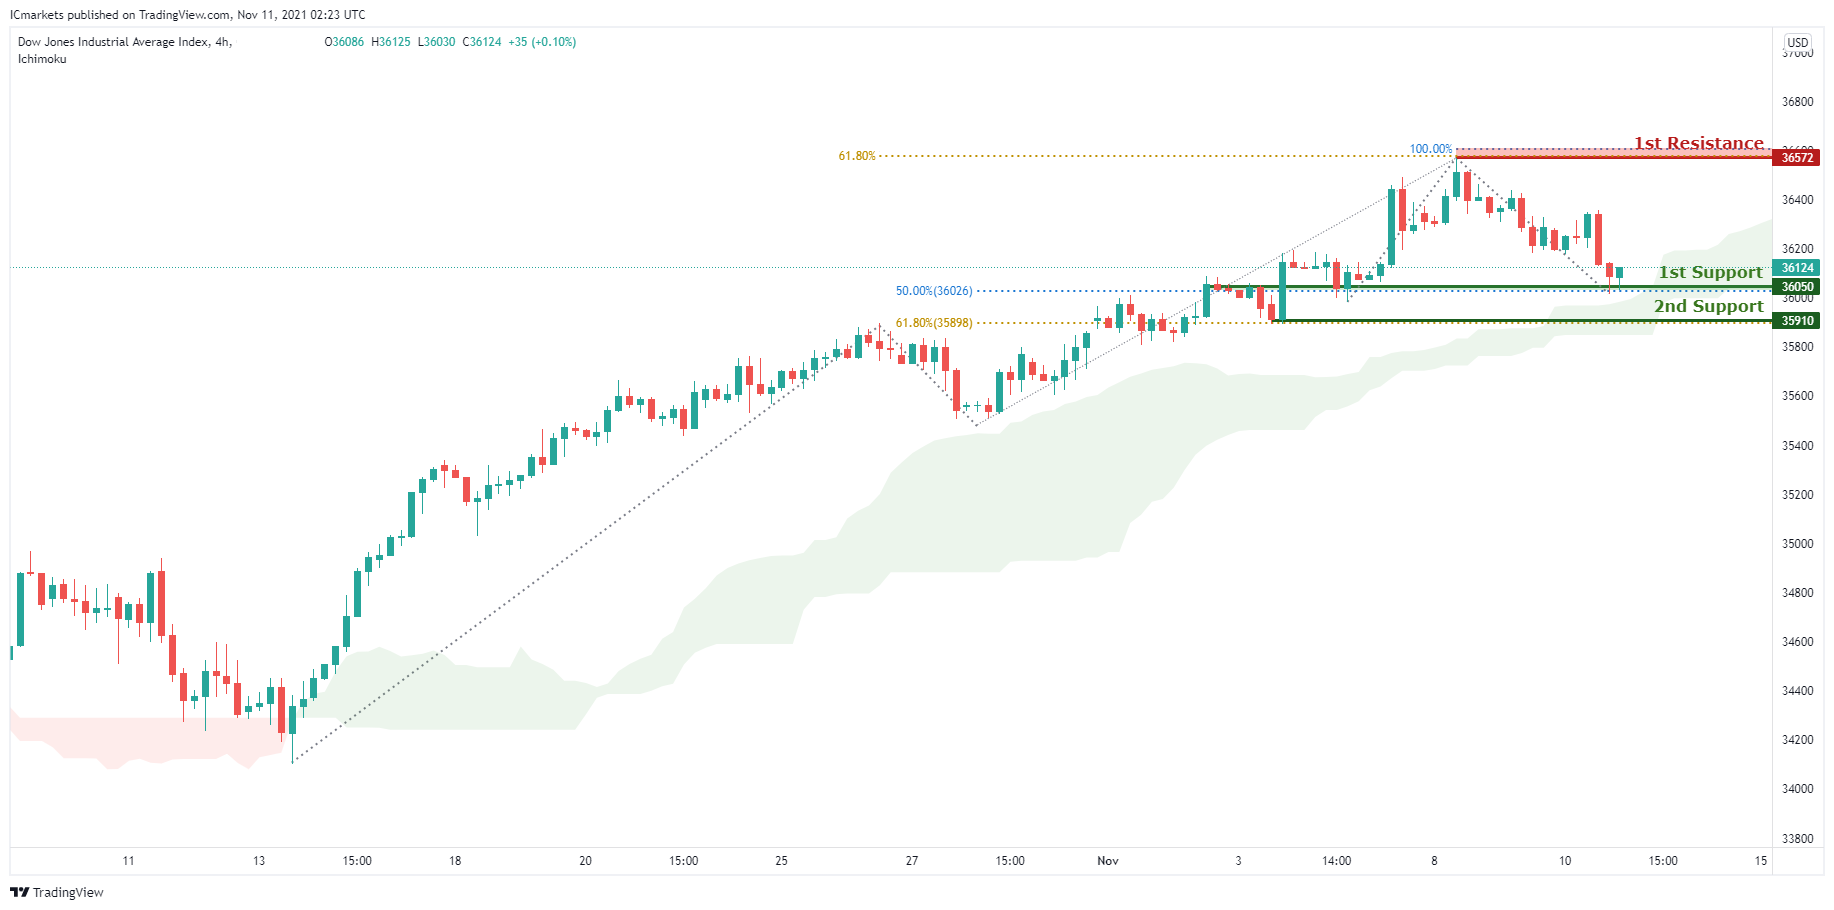
Dow Jones Industrial Average:
On the H4, with price moving above our ichimoku cloud and moving in an uptrend, we are biased that price will rise from out 1st support at 36050 in line with the 50% Fibonacci retracement level to 1st resistance at 36572 in line with 61.8% and 100% Fibonacci projection. Alternatively, we may see price break 1st support and head for 2nd support at 35910 in line with 61.8% Fibonacci retracement and graphical swing low.
Areas of consideration:
● 4H resistance at 36572
● 4H support at 36050
The accuracy, completeness and timeliness of the information contained on this site cannot be guaranteed. IC Markets does not warranty, guarantee or make any representations, or assume any liability regarding financial results based on the use of the information in the site.
News, views, opinions, recommendations and other information obtained from sources outside of www.icmarkets.com.au, used in this site are believed to be reliable, but we cannot guarantee their accuracy or completeness. All such information is subject to change at any time without notice. IC Markets assumes no responsibility for the content of any linked site.
The fact that such links may exist does not indicate approval or endorsement of any material contained on any linked site. IC Markets is not liable for any harm caused by the transmission, through accessing the services or information on this site, of a computer virus, or other computer code or programming device that might be used to access, delete, damage, disable, disrupt or otherwise impede in any manner, the operation of the site or of any user’s software, hardware, data or property.


