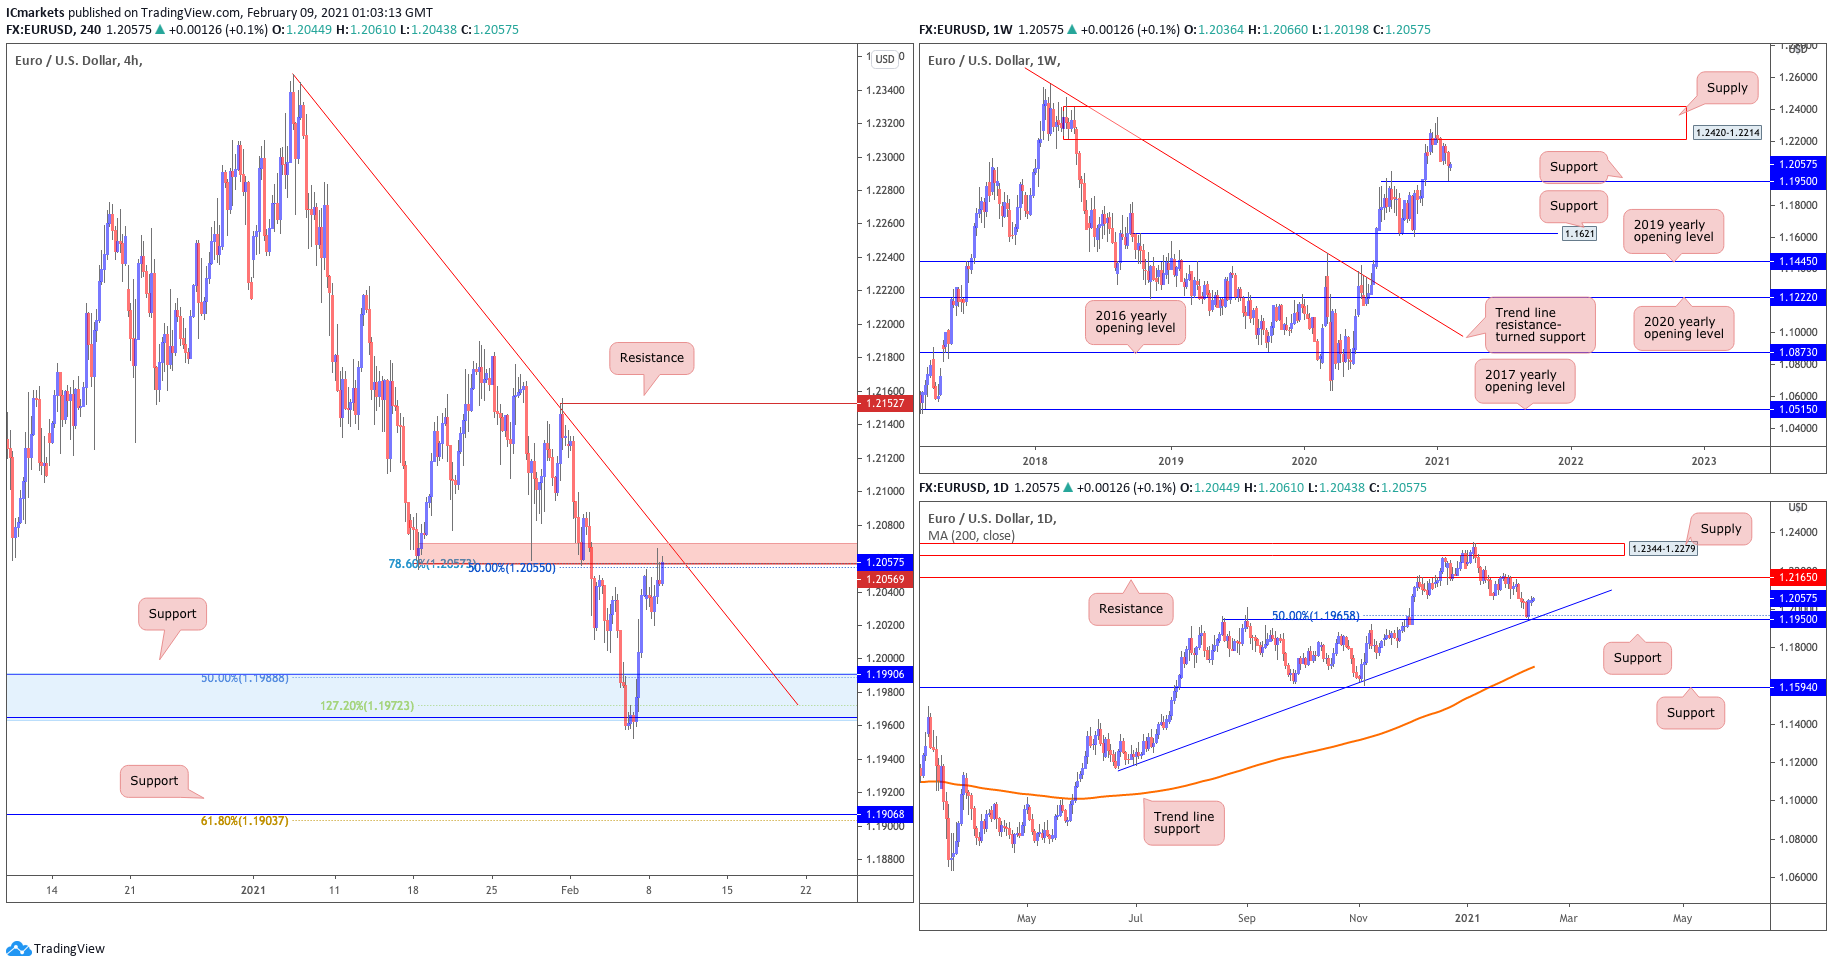
EUR/USD:
Looking at the weekly chart, we can see that prices are still in an uptrend and are holding above the key support level at 1.19500 which can be found on the weekly and daily time frame. This level also coincides with our 50% fibonacci retracement and ascending trend line on the daily time frame.
On the H4 timeframe, prices are testing our short term resistance area at 1.20569 which coincides with our descending trend line, 78.6% fibonacci extension and 50% fibonacci retracement as well as the graphical resistance area. This would be an interesting level for sellers and recent price action around that area suggests it is a weak area of supply flowing in where a break above this resistance area could see a further upside to our next resistance level at 1.21527.
Areas of consideration:
- 20569 resistance area found on H4 time frame
- 21527 resistance level found on H4 frame frame
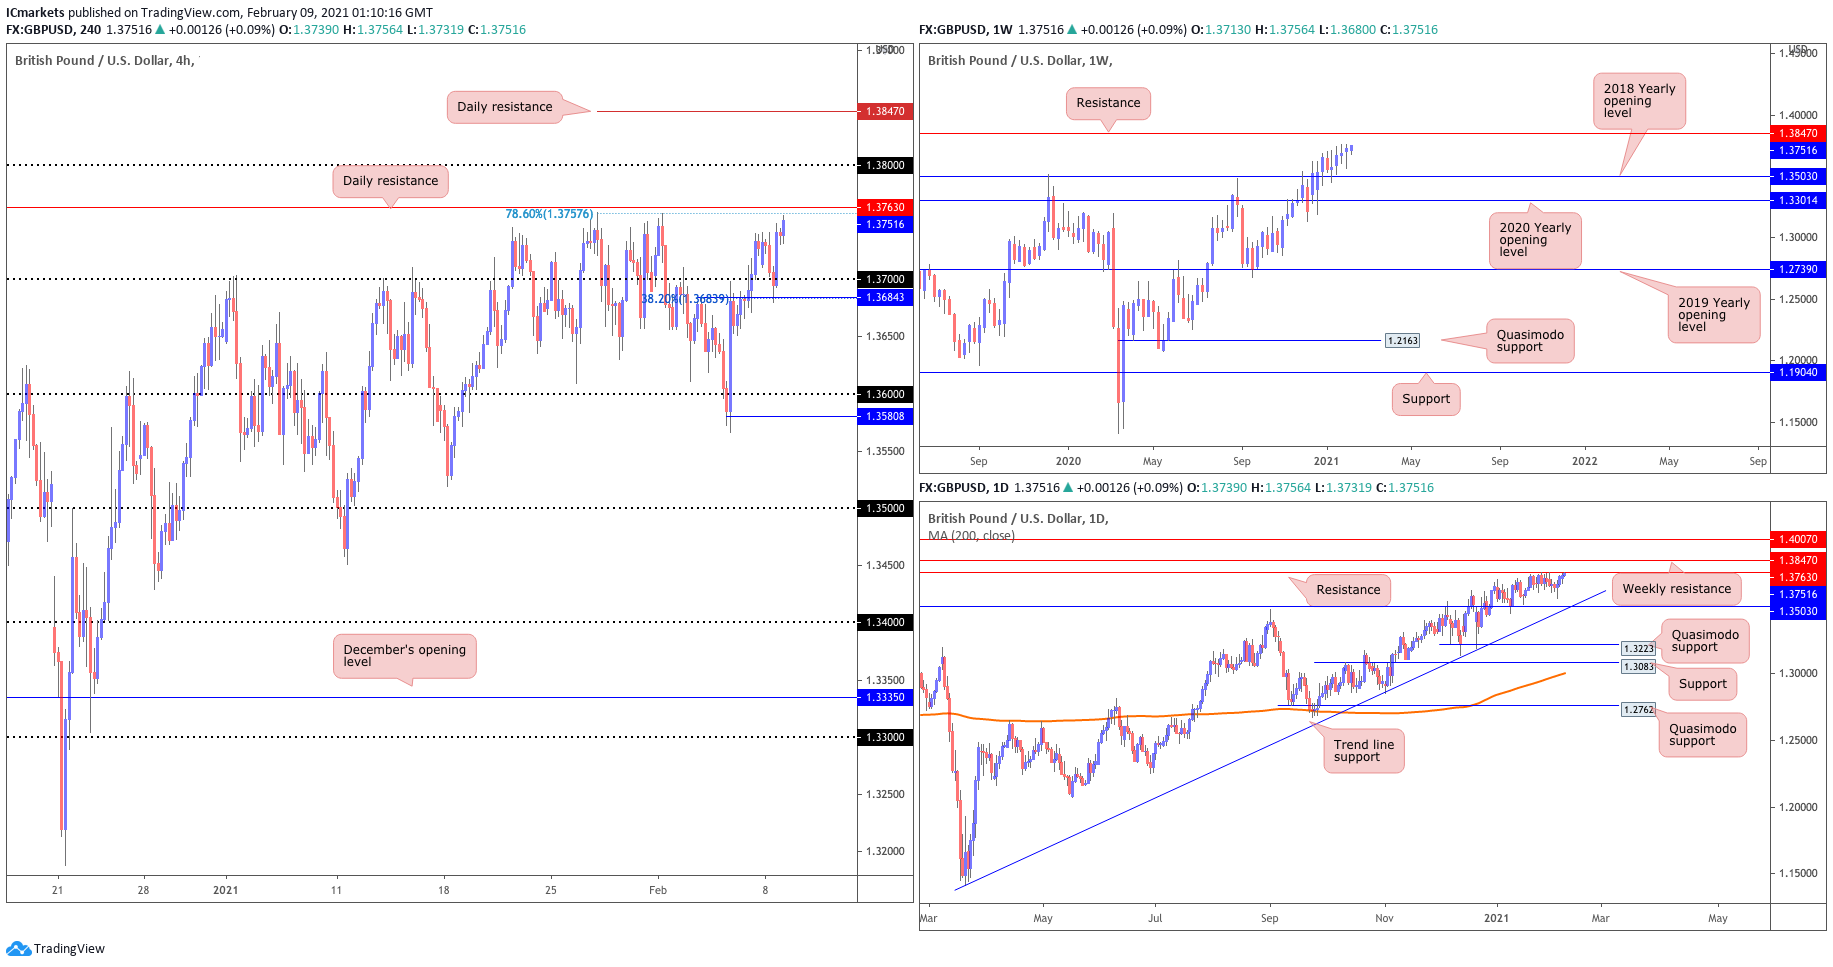
GBP/USD:
Looking at the weekly chart, we can see that prices are trading between our weekly support at 1.35030 and weekly resistance at 1.38470. On the daily time frame, prices are approaching resistance at 1.37630 and we are seeing limited downside before prices reach our weekly and daily support at 1.35030, in line with our daily ascending trend line.
On the H4 timeframe, short term resistance at the 1.37630 resistance area which can also be found on the daily time frame, coincides with the graphical resistance area. This would be an interesting level for sellers and recent price action around that area suggests it is a weak area of supply flowing in where a break above this level could see a further push up to our next resistance level at 1.38470 found on the daily time frame.
Areas of consideration:
- 37630 resistance area resistance area found on H4 and Daily timeframe
- 36843 support area on H4 timeframe
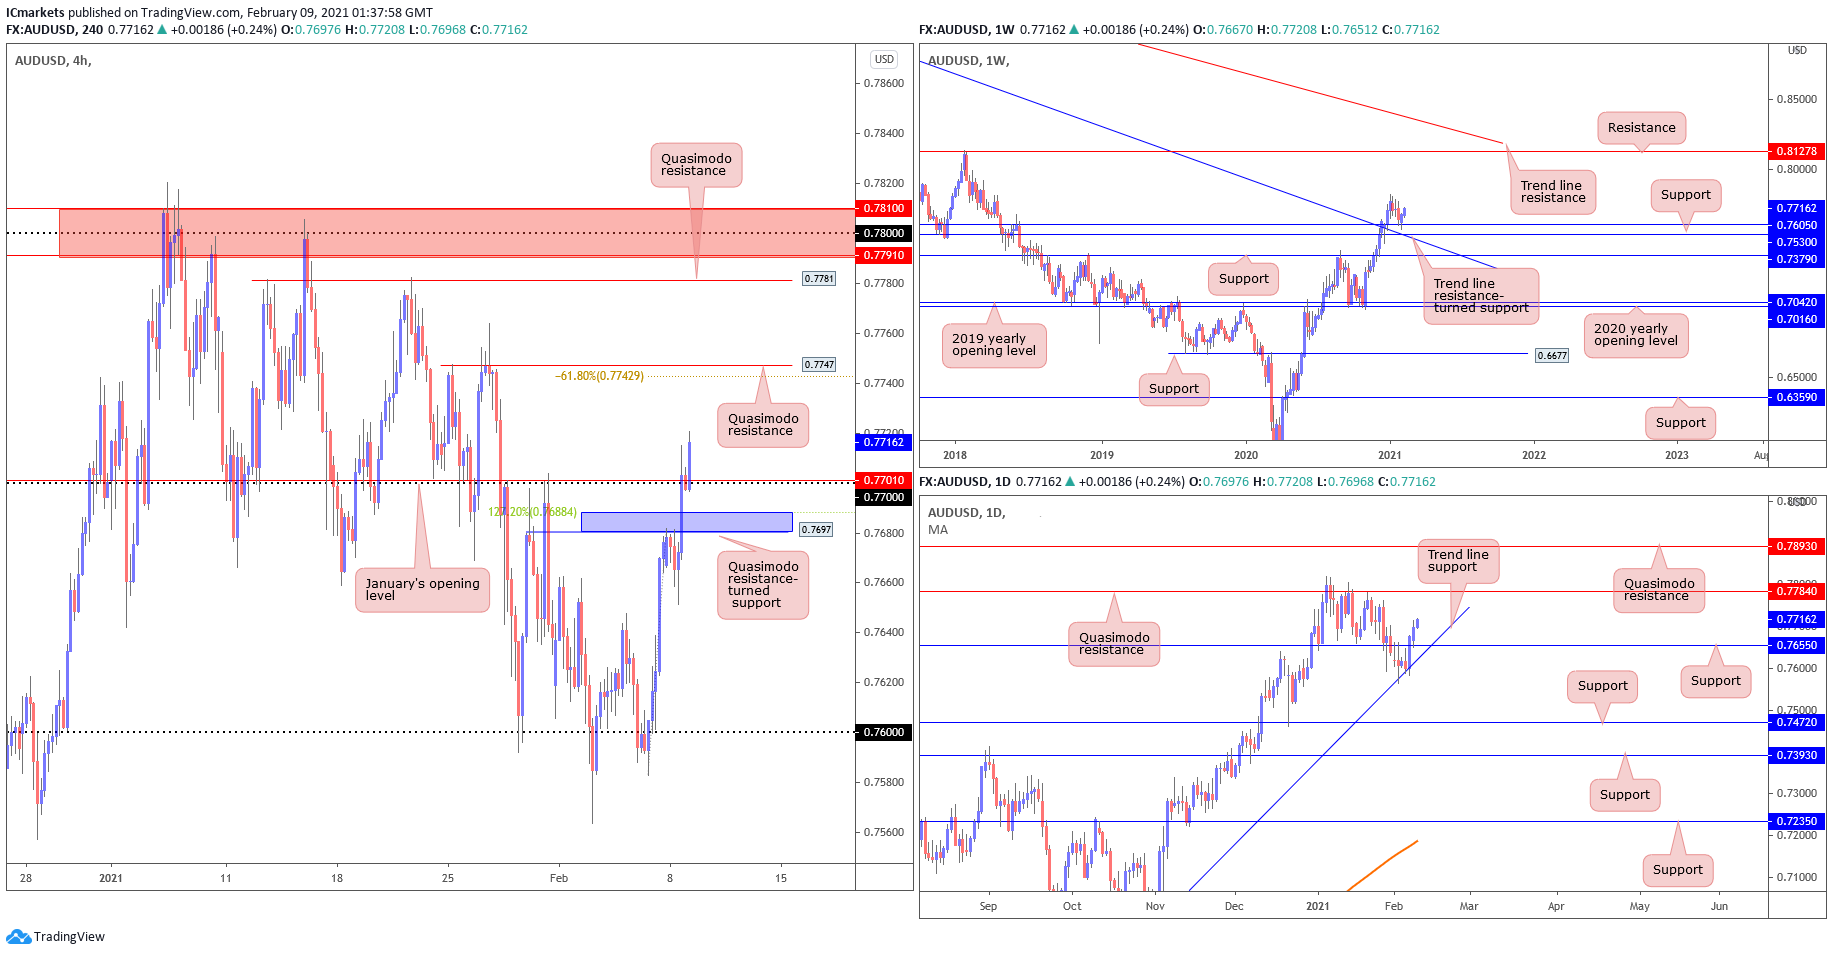
AUD/USD:
AUDUSD showed strong bullish moves from Friday which extends to Tuesday.
From the weekly timeframe, prices showed a bullish bounce above the Trendline resistance-turned support taken from the high 1.1080, and the support level of 0.7605, a previous Quasimodo resistance. The bullish momentum has been established since March (2020). On the Daily, prices have continued to respect the trendline support and shown a 100pip bounce from the level, turning the 0.76717 resistance level into a support level, which also happen to be a previous Quasimodo resistance. And the view on H4, buyers have pushed price to above the Quasimodo resistance, 127% fibonacci retracement, major 0.77 figure, as well as January’s opening. We may witness a testing of the next Quasimodo resistance level at 0.7747, as well as the -61.8% Fibonacci retracement.
Areas of consideration:
- Support at major level of 0.77 and January’s opening.
- Resistance near the previous Quasimodo level of 0.7747 and -61.8% retracement.
- Weekly and Daily timeframe show more room for upside.
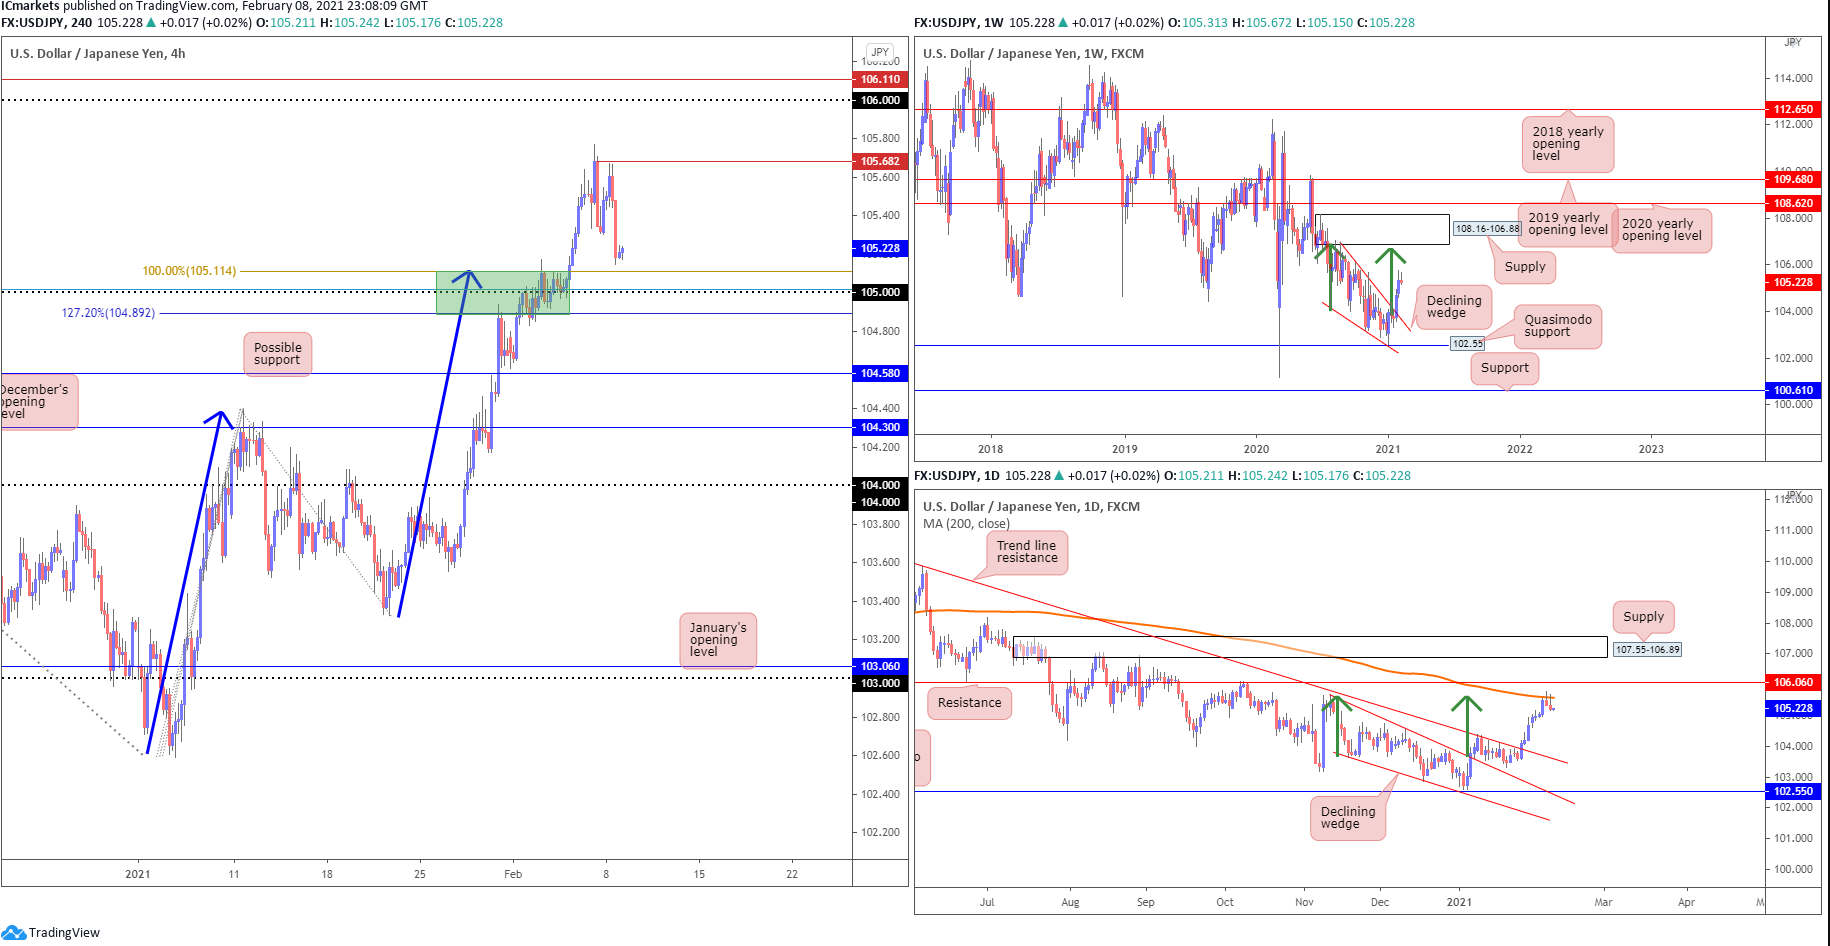
USD/JPY
The US dollar reversed on Monday after failing to break above 106 and is making its way back into the 105 zone , with H4 retesting 100% Fibonacci extension at 105.11 seen in AB=CD (blue arrows) . We have seen buyers step in after price approached 105.11
Against the backdrop of the H4 timeframe, Monday’s advance added upside impetus to the recent breakout above the weekly declining wedge (106.94/104.18). On the daily chart, price broke above the declining wedge and bounced further towards the weekly resistance level at 106.06, in line with the MA200 resistance. The daily timeframes displaying room to reach 106.06 underpins the possibility of further buying materialising north of 104.914(H4). However, before that on the H4 chart, we couldn’t ignore the resistance at 105.114 where the 100% fib extension is. If price is able to break above this 105 to 105.114 resistance zone, then we could expect the price to go north of 106.06 (weekly and daily).
Areas of consideration:
- 06 resistance on the Daily timeframe
- 11 support on H4 timeframe, in line with horizontal pullback support and 100% fib extension
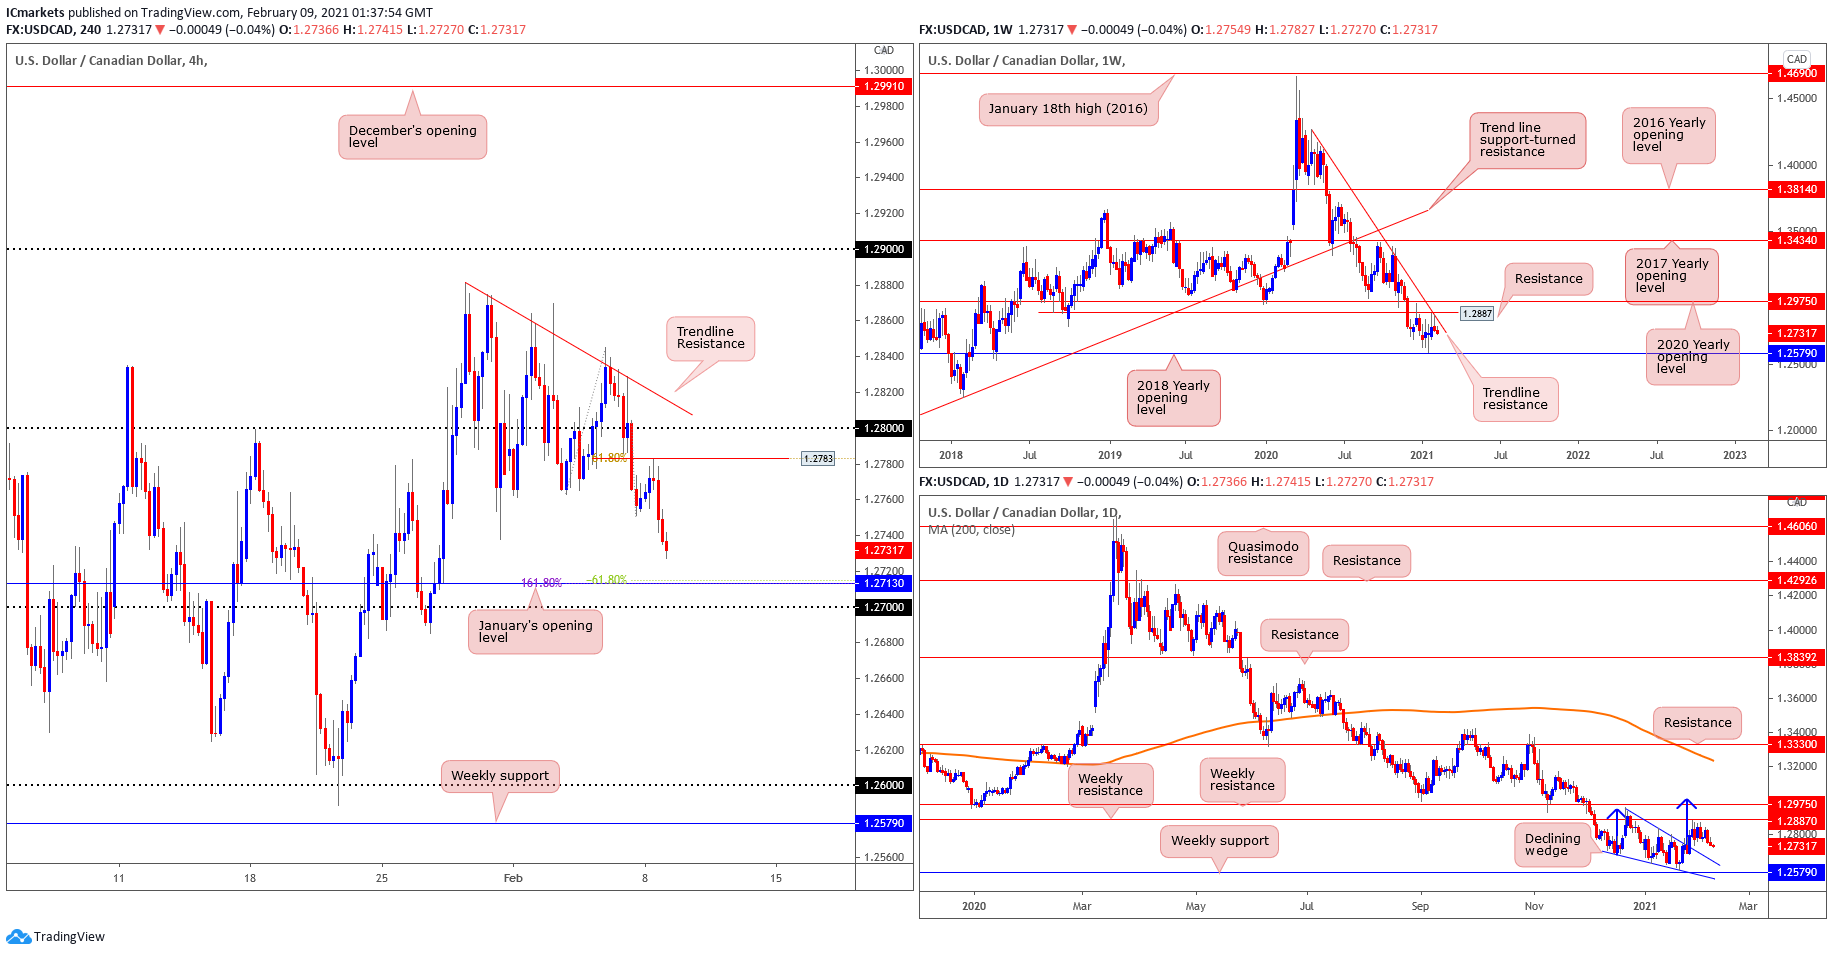
USD/CAD:
Looking at the weekly chart, price have respected the descending trendline drawn from 13 April (2020) high, which is also the 1.2887 resistance level (a previous Quasimodo support level). It is important to note that the long-term picture has pointed the direction down (trend) since March (2020). On the daily time frame, the resistance target obtained using a 100% projection starting from the breakout of the declining wedge lines up with the weekly resistance area we have identified and was a key graphical resistance area, price has yet to reach the target at 1.2975.
H4 has reversed perfectly from the call made yesterday at 61.8% retracement. And the current move is heading towards the support area made up of, January opening level at 1.2713, in line with 161.8% and -61.8% fibonacci retracement, taken from recent price action. That said, keeping in mind the strength of support level as prices have been showing a bearish move since March (2020).
Areas of consideration:
- Support level at 1.2713 where January opening, 161.8% retracement and -61.8% retracement are in confluence.
- Resistance level at 1.2783 where 61.8% retracement and horizontal overlap are.
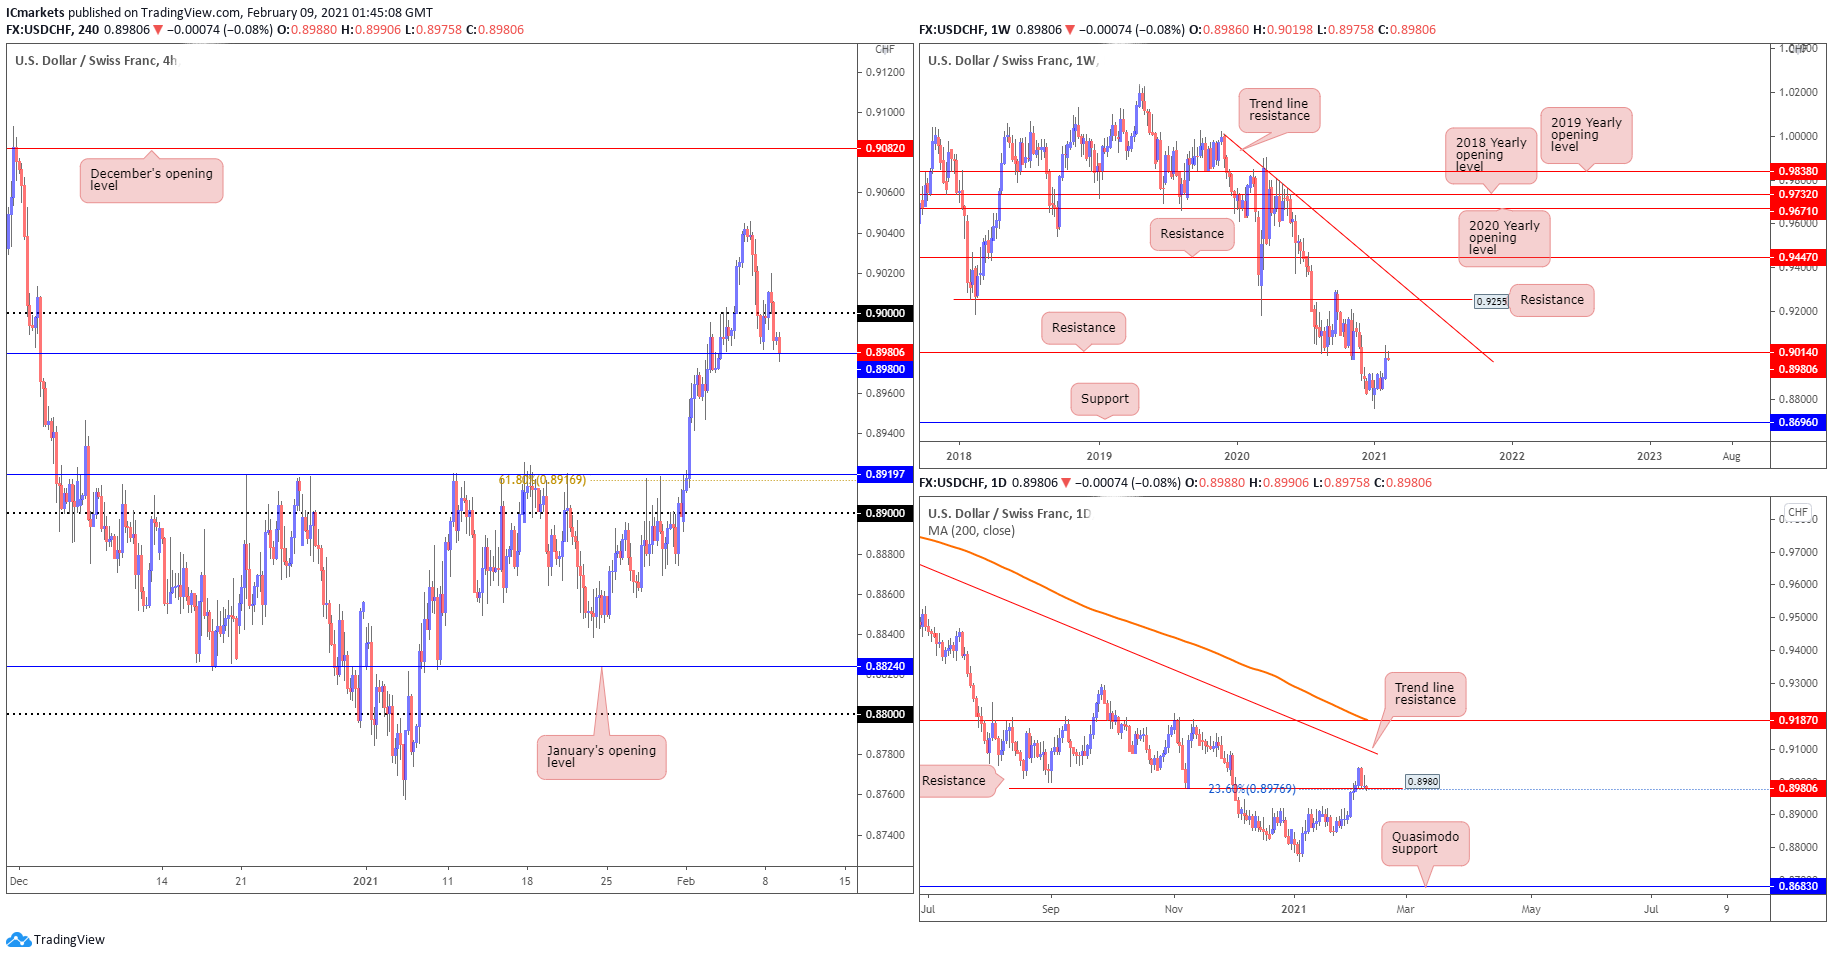
USD/CHF:
On the weekly timeframe, USD/CHF shows difficulty breaking above the resistance level at 0.9014, which is a horizontal pullback resistance level. Should price fail to break above this level, we could be looking at a bearish scenario where price falls to the next support level at 0.86960. A break above this level may provide the momentum needed for continuation of the bullish move towards the net resistance at 0.9255.
On the daily timeframe, price is showing a stronger pullback to the 0.8980 level which it is now testing, in line with our 23.6% Fibonacci retracement level. We can see that price is facing major resistance from the descending trendline and moving average resistance. It remains to be seen if price can hold above the 0.8980 level. If it does, we could possibly see a further push up to test the trendline and moving average resistance.
Looking at the H4 timeframe, we see a similar picture of price making a strong retracement to the 0.89800 level. We expect a bounce at this level, which lines up with our daily horizontal pullback support and 23.6% Fibonacci retracement level, and a further push up to test December’s opening level at 0.90820. If price fails to hold above the 0.8980 level, price could swing south and pullback to our next major support level at 0.89197 which is in line with our 61.8% Fibonacci retracement.
Areas of consideration:
- USD/CHF is showing a strong pullback to the 0.89197 level after a strong bullish move up from last week
- 8980 level is an important level to watch and see if price manages to hold above it for a continuation of the bullish move up.
- 90820 is a potential upside level in line with December’s opening level.
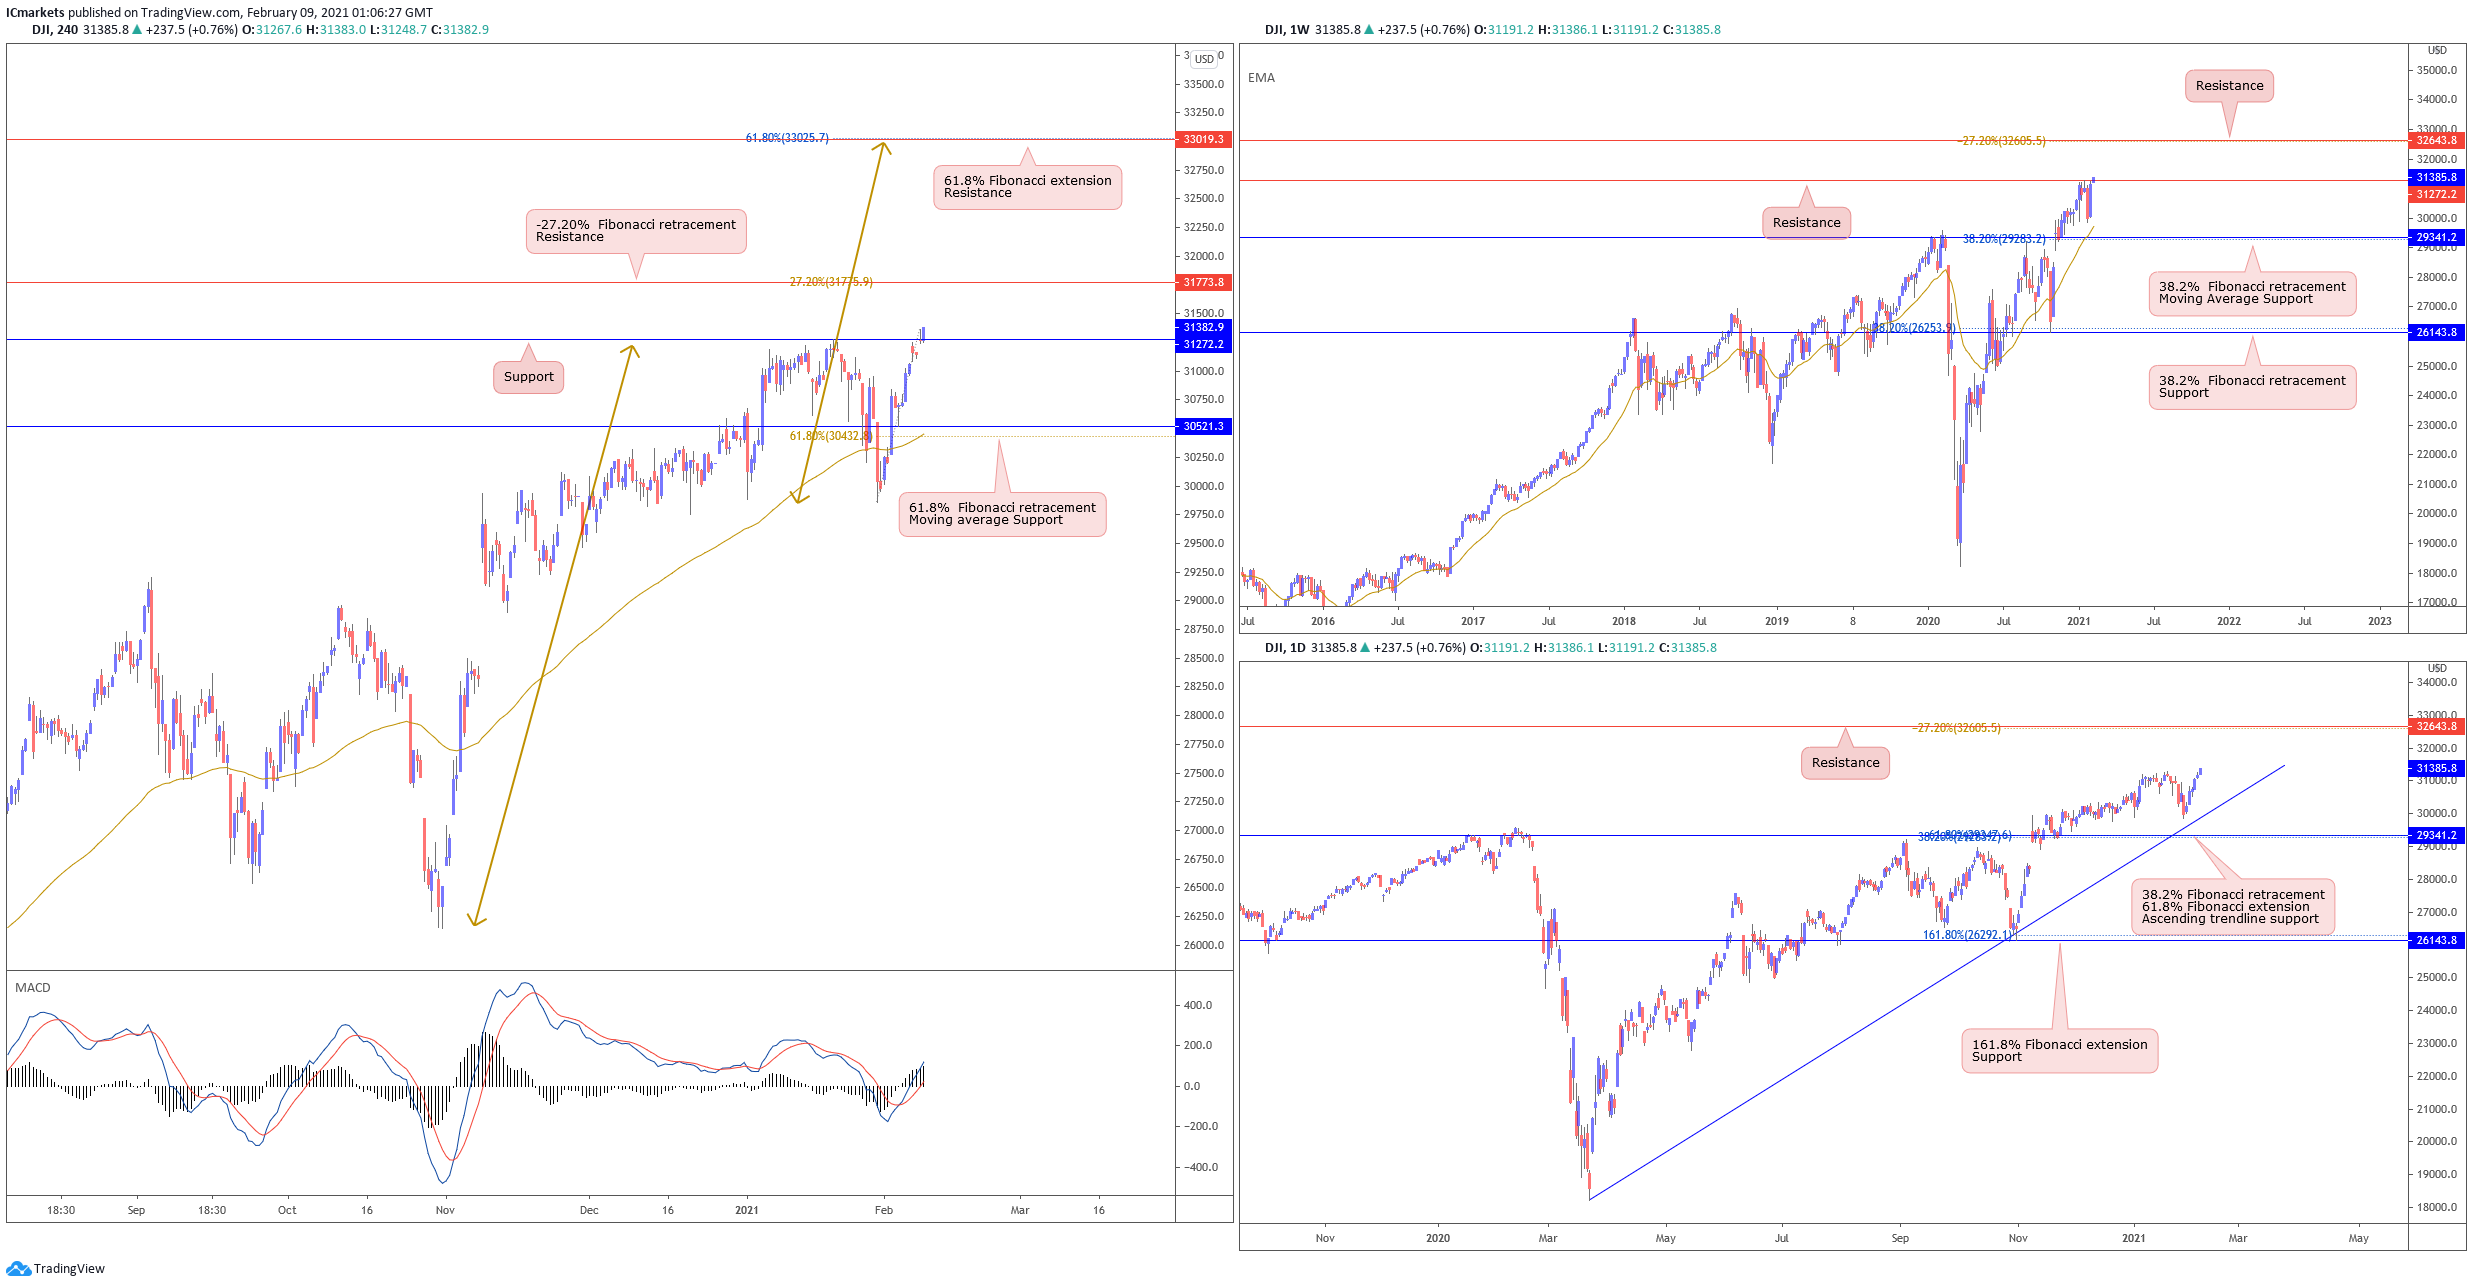
Dow Jones Industrial Average:
Price pushed higher and made new highs overnight. On the weekly, price still testing the 31272 level. A weekly close above this level should see price pushing even higher towards the next resistance at 32643. Otherwise, failure to hold above 31272 could mean that this is a fake out and probably pull back towards 29341 support. On the Daily, price continues to hold very strongly above ascending trendline support. Traders should be careful when deciding to trade any short term pullbacks as the bullish momentum on the longer term is very strong.
On the H4, price has closed above our previous all time high at 31272 and has made a new high. With price holding above moving average and MACD indicator above 0, showing room for further bullish upside, it is possible to see buyers pile in and add to their longs with a possible resistance target at 31773.8. Otherwise, failure to hold above 31272 could see price swing back and come back to the 61.8% Fibonacci retracement level and moving average support at 30521.
Areas of consideration:
- 31272 key support to watch
- Bullish momentum on both the weekly and H4 chart is very strong.
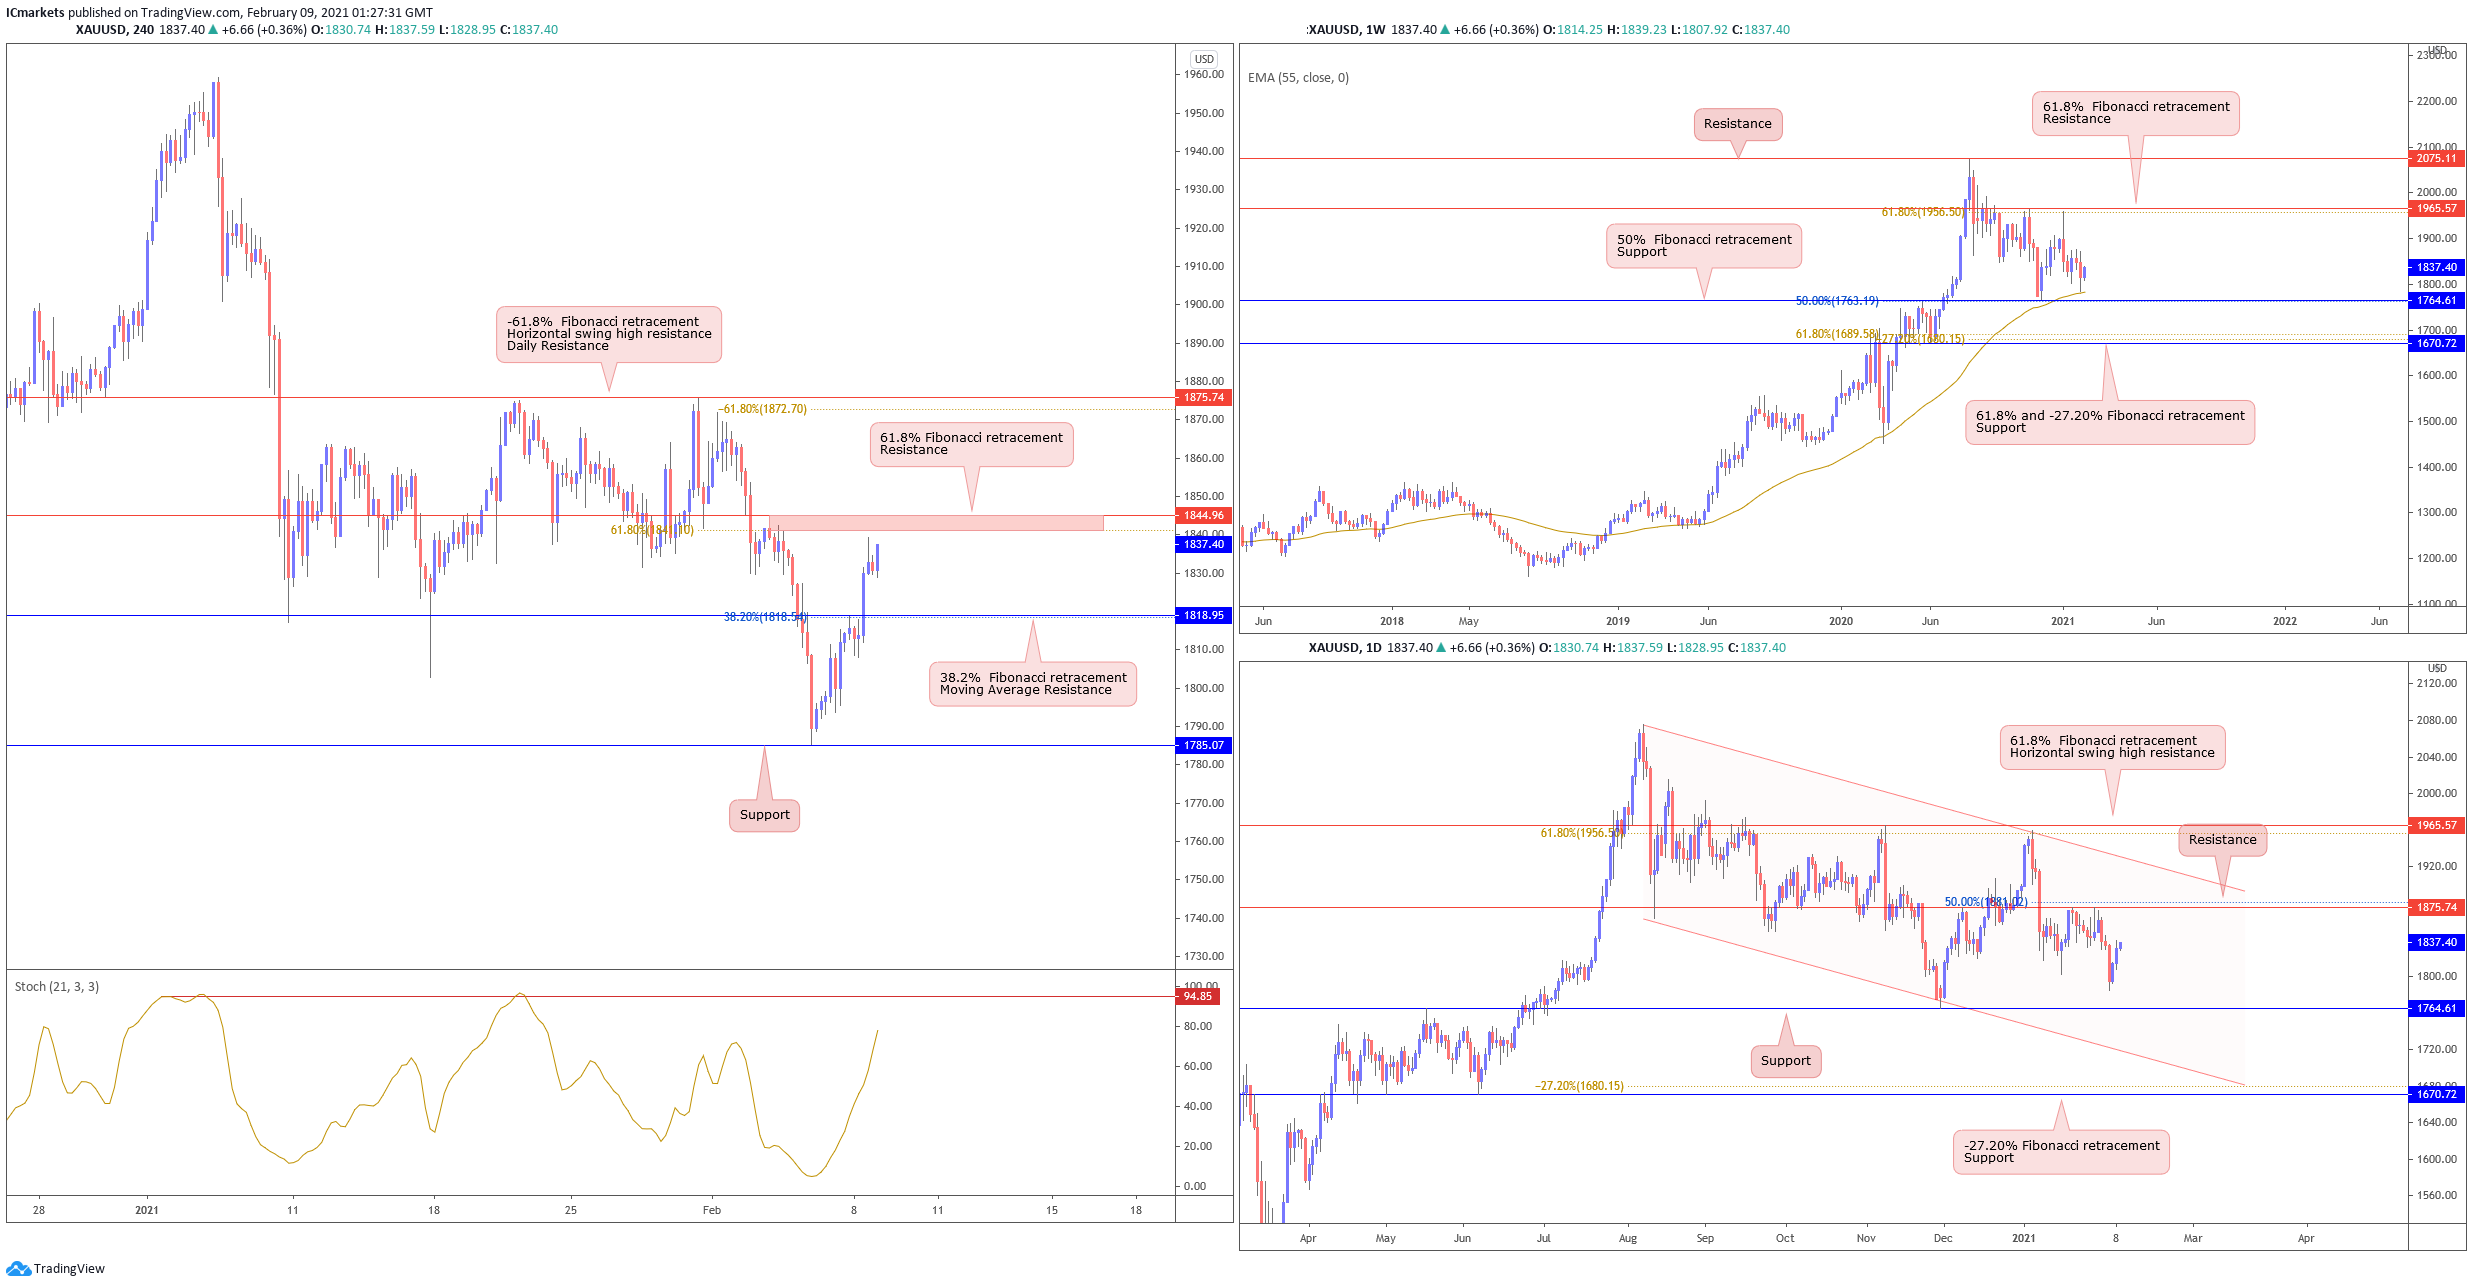
XAU/USD (GOLD):
On the weekly timeframe, gold is still holding above long term moving average support. With price now close to support at 1764, traders can expect price to show a small bounce reaction above this level. On the daily chart, price came shy of 1764 support and showed a bounce reaction. Over the course of this week, we should see price ranging between 1875 resistance and 1764 support.
On the 4H timeframe, price surpassed previous resistance at 1802 and pushed higher, coming close to 1845 resistance which is also our 61.8% Fibonacci retracement level. With stochastic indicator coming close to resistance wher price reacted in the past, it is possible to see sellers enter with their shorts to push price down towards intraday support at 1818. Otherwise, failure to hold below 1845 will see price swing the other way towards 1875.
Areas of consideration:
- 1845 resistance is a strong intraday resistance to watch
- Stochastic indicator coming close to resistance where price reacted in the past
The accuracy, completeness and timeliness of the information contained on this site cannot be guaranteed. IC Markets does not warranty, guarantee or make any representations, or assume any liability regarding financial results based on the use of the information in the site.
News, views, opinions, recommendations and other information obtained from sources outside of www.icmarkets.com.au, used in this site are believed to be reliable, but we cannot guarantee their accuracy or completeness. All such information is subject to change at any time without notice. IC Markets assumes no responsibility for the content of any linked site.
The fact that such links may exist does not indicate approval or endorsement of any material contained on any linked site. IC Markets is not liable for any harm caused by the transmission, through accessing the services or information on this site, of a computer virus, or other computer code or programming device that might be used to access, delete, damage, disable, disrupt or otherwise impede in any manner, the operation of the site or of any user’s software, hardware, data or property.


