Key risk events today:
UK CPI y/y; MPC Member Ramsden Speaks; Canada CPI m/m; Canada Core Retail Sales m/m and Retail Sales m/m.
(Previous analysis as well as outside sources – italics).
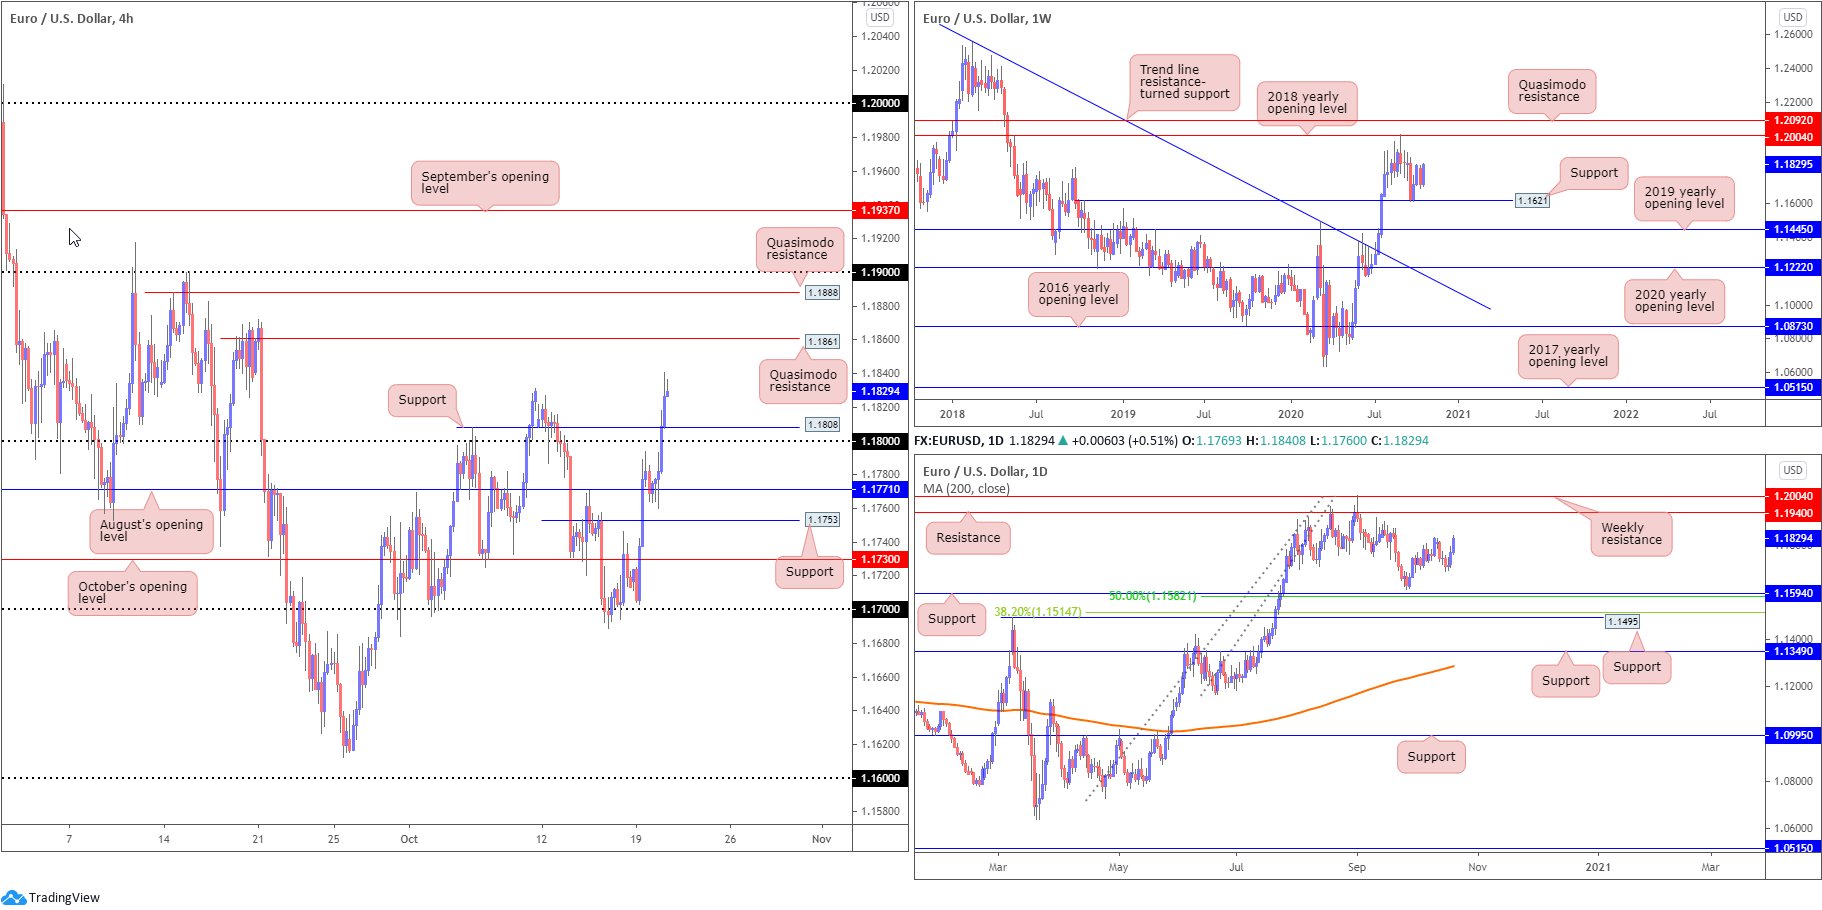
EUR/USD:
As the DXY toys with breaking 94.00 support, down 0.4% on Tuesday, EUR/USD, following a retest at August’s opening value at 1.1771, destroyed a number of key resistances on the H4 timeframe. This shed light on Quasimodo resistance at 1.1861, followed by another layer of Quasimodo resistance at 1.1888 and then the 1.19 handle.
From the weekly timeframe, technicians will acknowledge room to advance (after testing minor support from 1.1621) until shaking hands with the 2018 yearly opening value at 1.2004 (a level that capped upside attempts in late August).
With regards to the technical picture on the daily chart, we see little stopping bulls from taking a run at resistance coming in at 1.1940. It is worth noting this base is sited just under weekly resistance mentioned above at 1.2004.
Areas of consideration:
Given broader bullish signs on the higher timeframes (weekly and daily timeframes both appear to be free of any obvious resistance – on top of this, the immediate trend has curved higher since early 2020), further buying to H4 Quasimodo resistance at 1.1861 is a possibility.
Before reaching this far north, however, a retest at 1.1808 H4 support/1.18 handle could materialise, likely welcomed by dip-buyers.
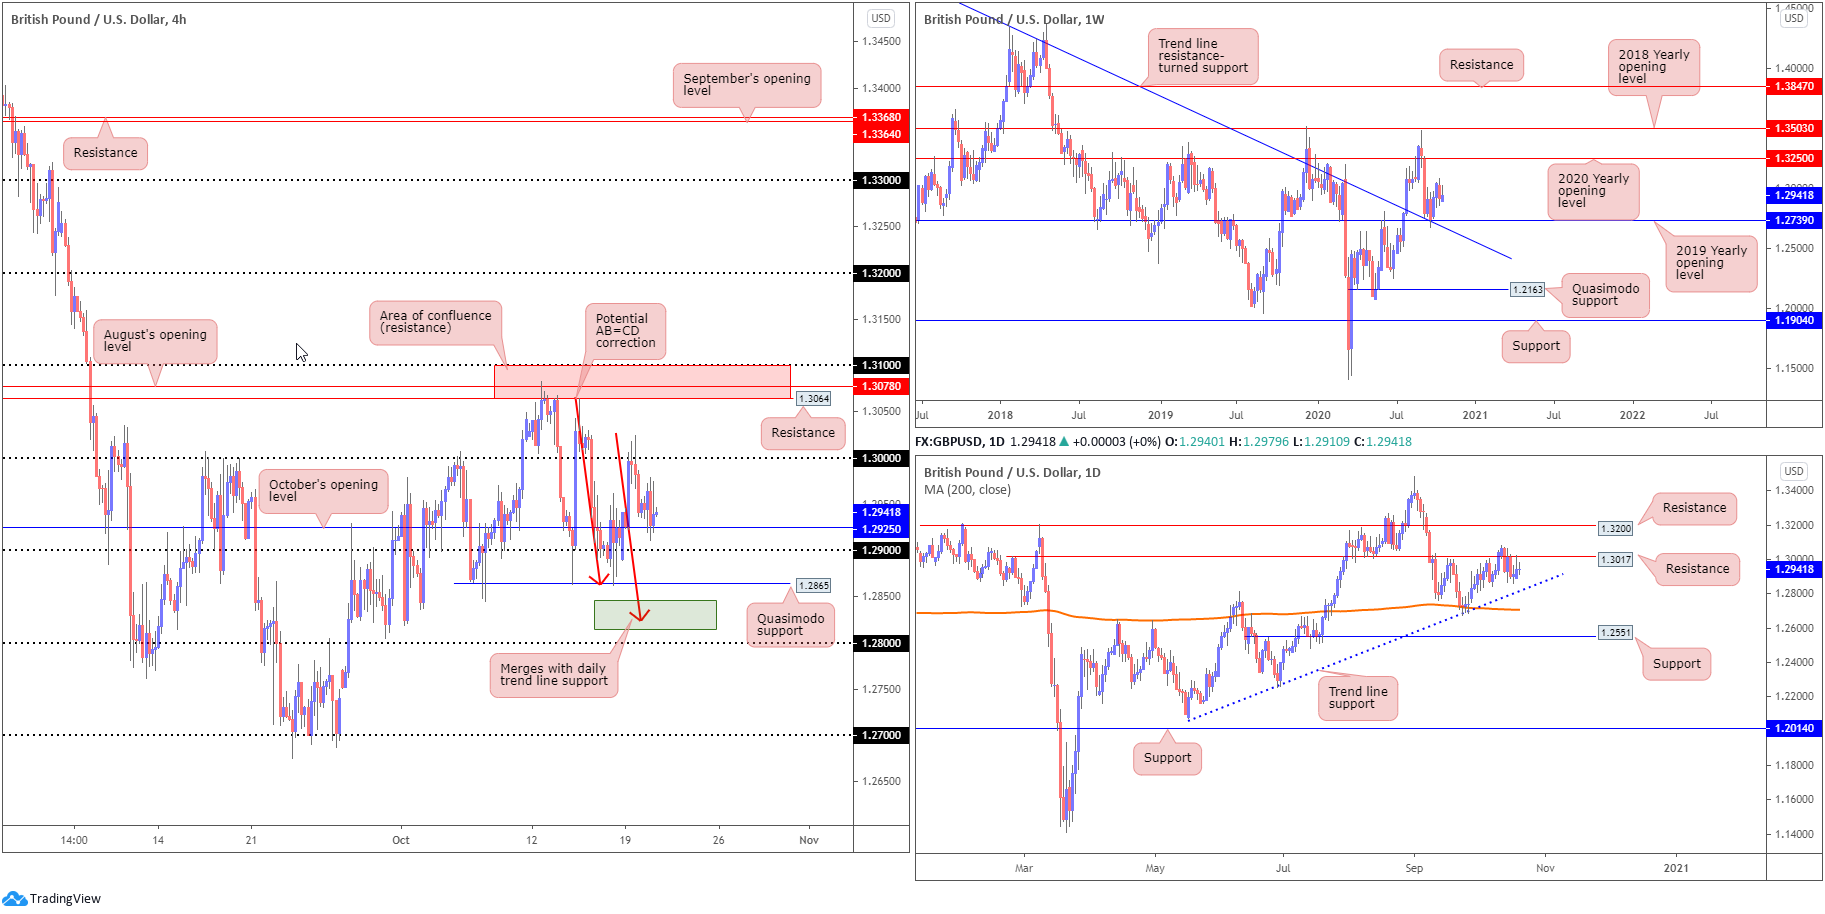
GBP/USD:
From the top this morning, the weekly timeframe shows price holds north of support at 1.2739 (a 2019 yearly opening value), a level merging with trend line resistance-turned support, extended from the high 1.5930. The rebound from 1.2739 may have been viewed as a dip-buying opportunity, targeting the 2020 yearly opening value at 1.3250. Should 1.2739 fail, nonetheless, the 1.2251 low (June 29) is in sight, shadowed by Quasimodo support from 1.2163.
The daily timeframe has witnessed little change this week so far, clinging to the underside of resistance at 1.3017. Interestingly, though, trend line support, taken from the low 1.2075, is closing in fast. Below the current trend line, a 200-day SMA (orange – 1.2706) is visible. Above 1.3017, however, resistance is set at 1.3200, 50 pips under weekly resistance (2020 yearly opening value at 1.3250).
The view from the H4 timeframe reveals buyers and sellers battling for position around October’s opening value at 1.2925 (sited north of the 1.29 handle and a Quasimodo support priced at 1.2865), a day after retreating from the key figure 1.30 (aided by daily resistance at 1.3017). Above 1.30, 1.31/1.3064 resistance (red – composed of the 1.31 handle, resistance from 1.3064 and August’s opening value at 1.3078) remains a point of interest should bulls take charge.
Areas of consideration this week:
- Daily trend line support (1.2075) converges with a potential AB=CD correction (bullish – red arrows) around 1.2823. Though do note a whipsaw to 1.28 could form before buyers make an appearance.
- 27 on the H4, given the level merges closely with the 200-day SMA.
- 31 on the H4, a level that forms part of the H4 resistance zone between 1.31/1.3064.
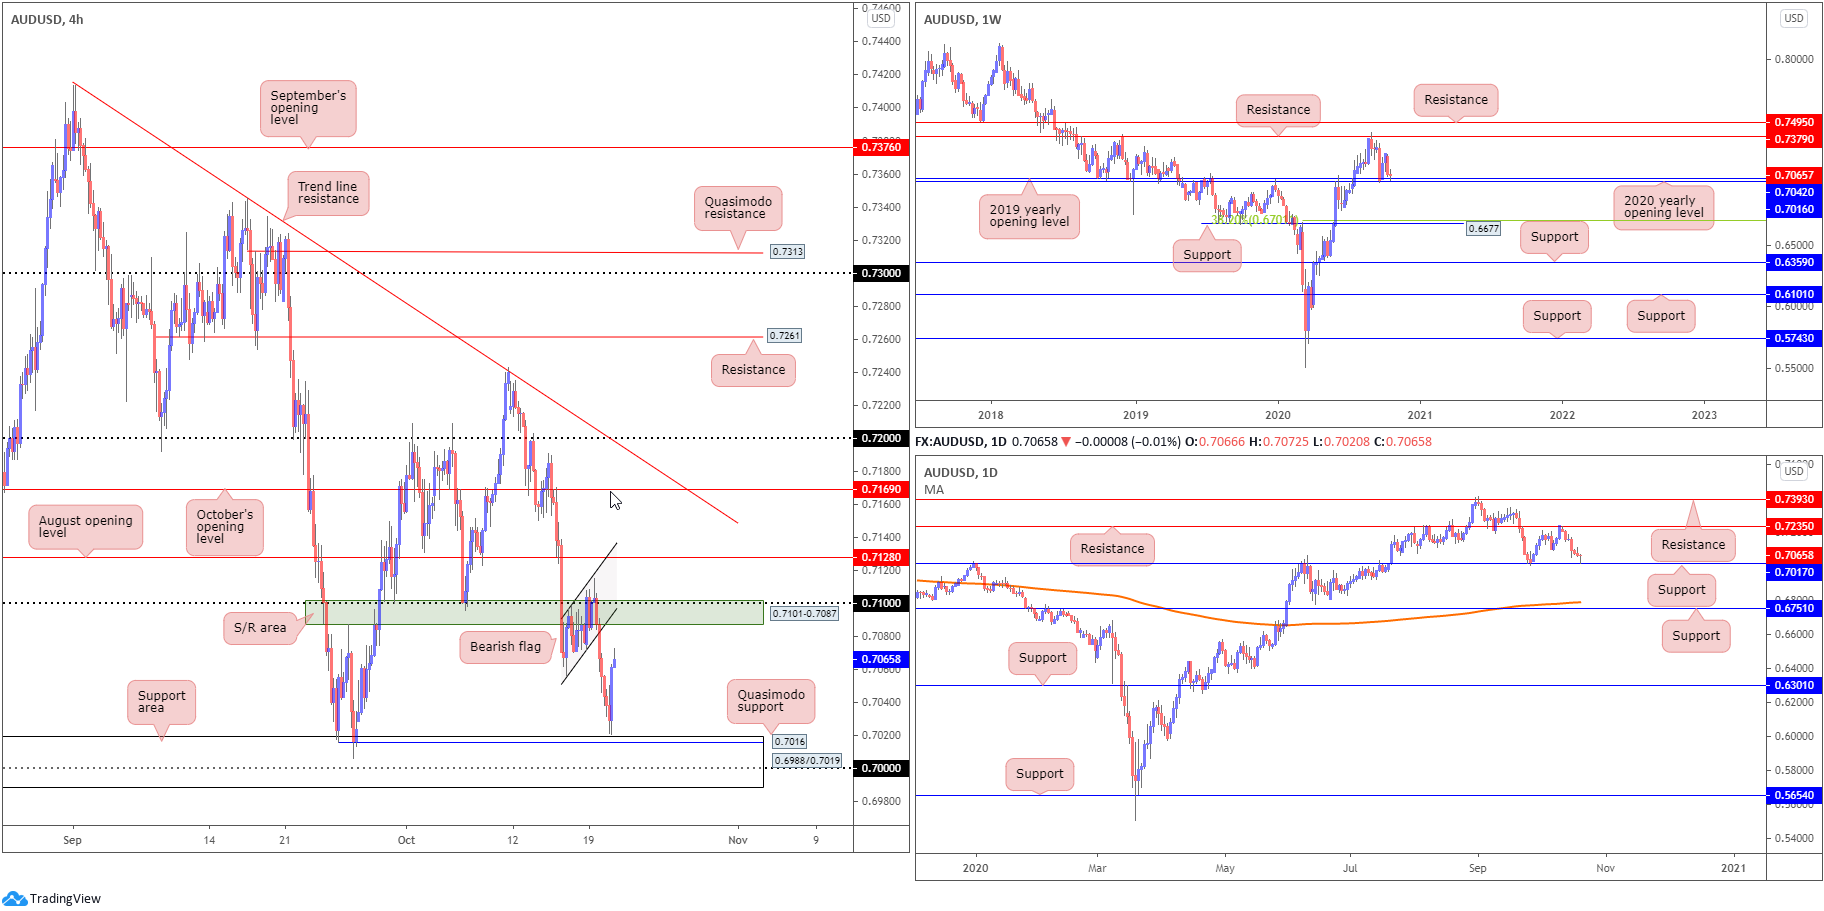
AUD/USD:
Technically, AUD/USD is testing a significant area of support on the weekly timeframe, made up of the 2020 (0.7016) and 2019 (0.7042) yearly opening values, following a correction from resistance at 0.7379. Note also that the pair has chalked up decisive upside since bottoming mid-March at 0.5506. Additionally, on the daily timeframe we can see price bottomed three pips ahead of support at 0.7017 yesterday, with the candle finishing considerably off worst levels, forming a hammer candlestick pattern.
Tuesday, from the H4 timeframe, saw the pair bottom just north of a support area at 0.6988/0.7019 (holds the key figure 0.70 within and also a Quasimodo support level at 0.7016). Sustained upside today shines the spotlight on a well-grounded resistance zone at 0.7101-0.7087 (houses the 0.71 handle within).
Areas of consideration:
The combination of weekly price rejecting support between 0.7016/0.7042, and daily price launching a hammer candle pattern north of support at 0.7017, could have H4 candles knock on the door of 0.71 today, which is surrounded by a resistance zone at 0.7101-0.7087.
With higher timeframes projecting higher prices, a bearish reaction from 0.7101-0.7087 could be short-lived, with breakout buyers likely watching for moves to form north of 0.71.
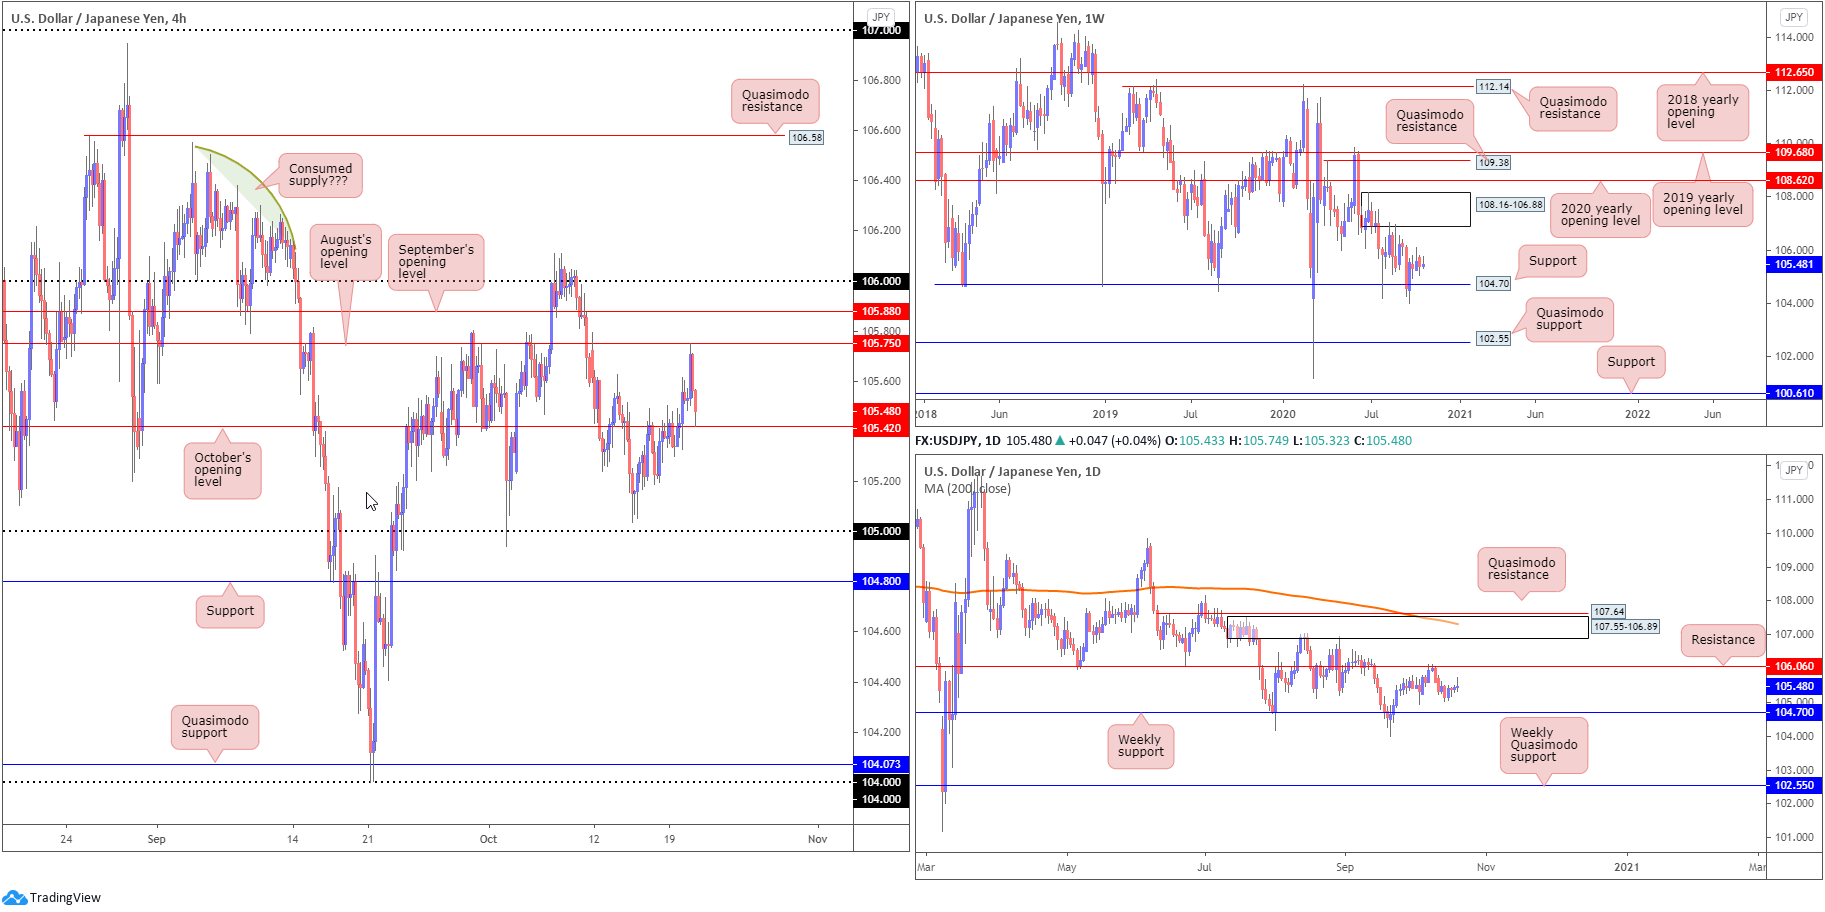
USD/JPY:
Tuesday had USD/JPY sharply recoil from August’s opening value at 105.75 (a to-the-pip reaction) on the H4 timeframe, recently crossing swords with October’s opening value at 105.42. Below the latter, demand appears fragile until reaching the 105 handle. While a 105.42 rejection could see buyers retest (and maybe engulf) 105.75 to challenge September’s opening value at 105.88 and the 106 handle.
Overall, we have seen limited change on the bigger picture, therefore here’s a reminder of where we left Monday’s weekly briefing (italics):
Over the past three weeks, USD/JPY highlighted a somewhat stable attitude, rocking between 106.10/104.94. July and September, however, rebounded from support at 104.70, with the month of August capped by supply at 108.16-106.88.
Quasimodo support at 102.55 offers a feasible target beyond current support in the event we turn south, while removing supply draws the 2020 yearly opening value at 108.62 into the fight.
Similarly, from the daily timeframe, little change is seen, aside from yesterday’s shooting star candlestick pattern (albeit not perfect form). Prominent areas to be aware of on the daily chart are resistance drawn from 106.06 and the weekly support level at 104.70. If resistance at 106.06 gives way, supply at 107.55-106.89, an area housed within the lower boundary of weekly supply underlined above at 108.16-106.88, is seen. Of note, the daily area also benefits from nearby Quasimodo resistance at 107.64 and the 200-day SMA (orange – 107.31).
Areas of consideration:
- The 106 handle (H4) represents strong resistance, seated next to a daily resistance level at 106.06.
- 80 H4 support is also interesting, pinned just 10 pips ahead of the weekly support level addressed above at 104.70.
- Intraday, a 105.42 breach, having noted feeble H4 demand south of the level, may witness follow-through selling develop, targeting 105 (with a break honing in on H4 support at 104.80).
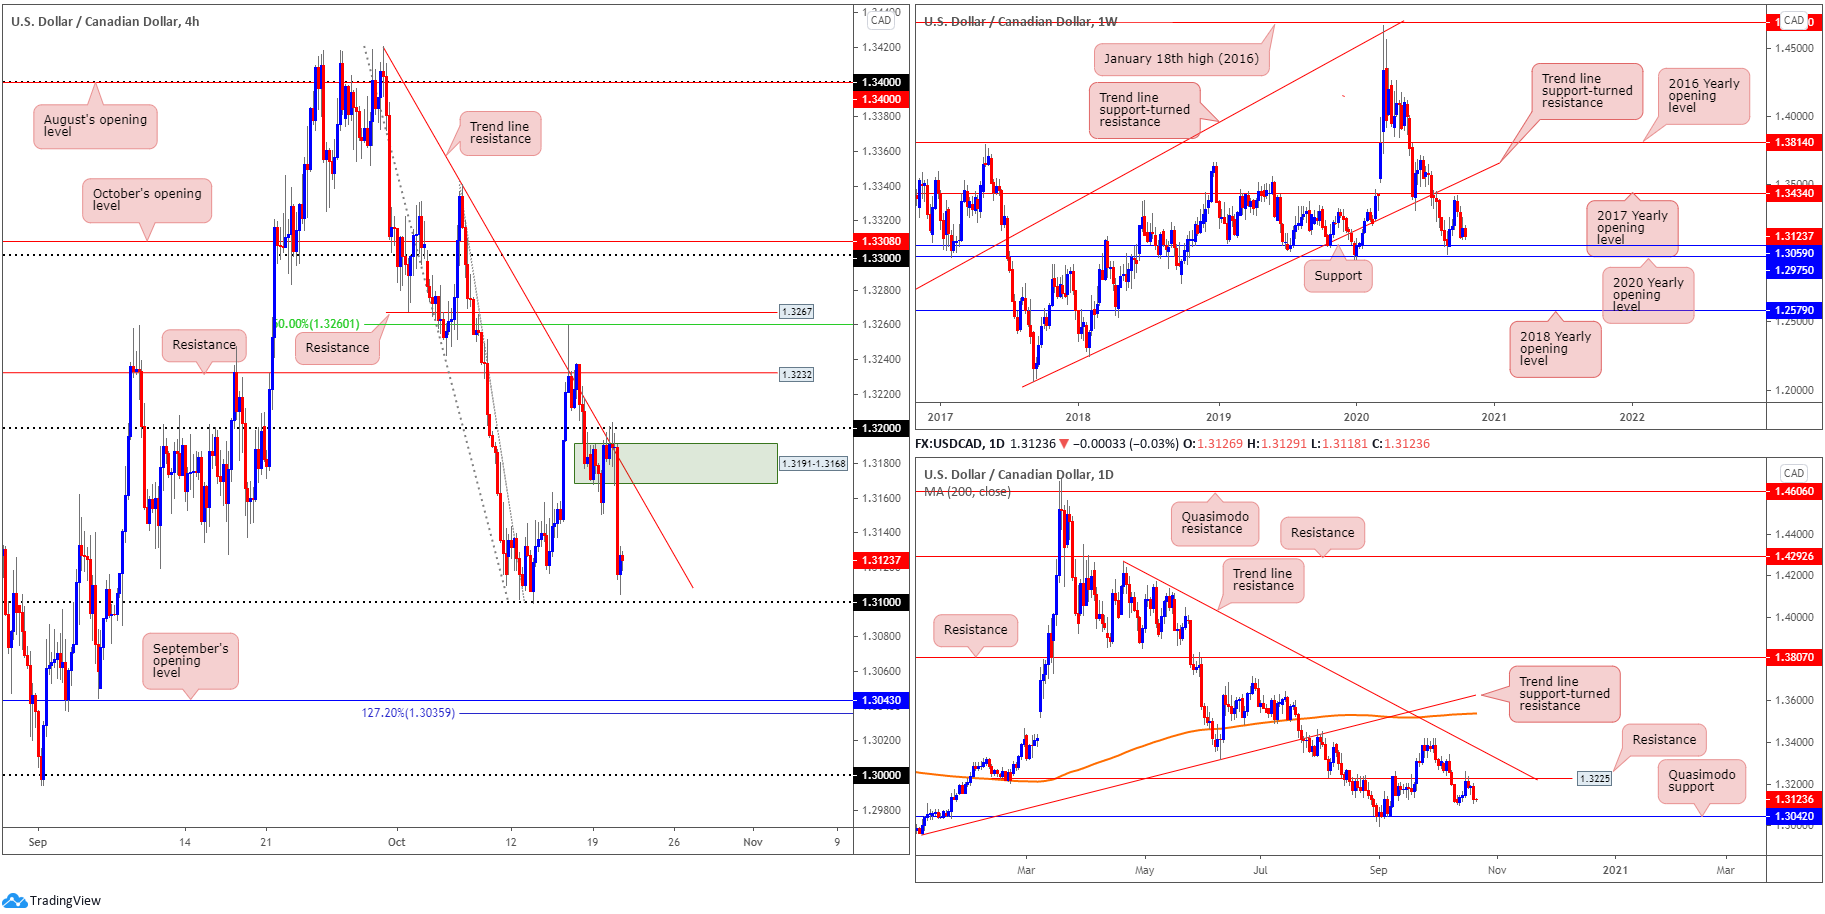
USD/CAD:
The US dollar shaved off 0.5% against the Canadian dollar Tuesday, concluding a handful of pips off session lows at 1.3104. Reacting from H4 trendline resistance, taken from the high 1.3420, the unit is now flirting with the possibility of joining 1.31. Digging under the round number today will have traders’ crosshairs shift towards September’s opening value at 1.3043 (according to our charts), closely shadowed by a 127.2% Fibonacci projection point at 1.3036.
In terms of where we stand on the weekly timeframe, following a two-week decline south of the 2017 yearly opening value at 1.3434, price discovered a floor ahead of support at 1.3059 in recent dealings (arranged above the 2020 yearly opening value at 1.2975).
Daily resistance at 1.3225 nudged its way into the spotlight last week and, as you can see, served sellers well. Should the Canadian dollar remain on the winning side of the table, revisiting Quasimodo support coming in at 1.3042 is a possible scenario.
Areas of consideration:
As both weekly and daily timeframes exhibit scope to move as far south as 1.3059 (weekly timeframe), tunnelling under 1.31 today on the H4 unchains a potential bearish theme.
Aside from 1.3059, additional downside targets are visible at September’s opening value from 1.3043, as well as daily Quasimodo support at 1.3042, and then (with a strong bearish wind) possibly the key figure 1.30.
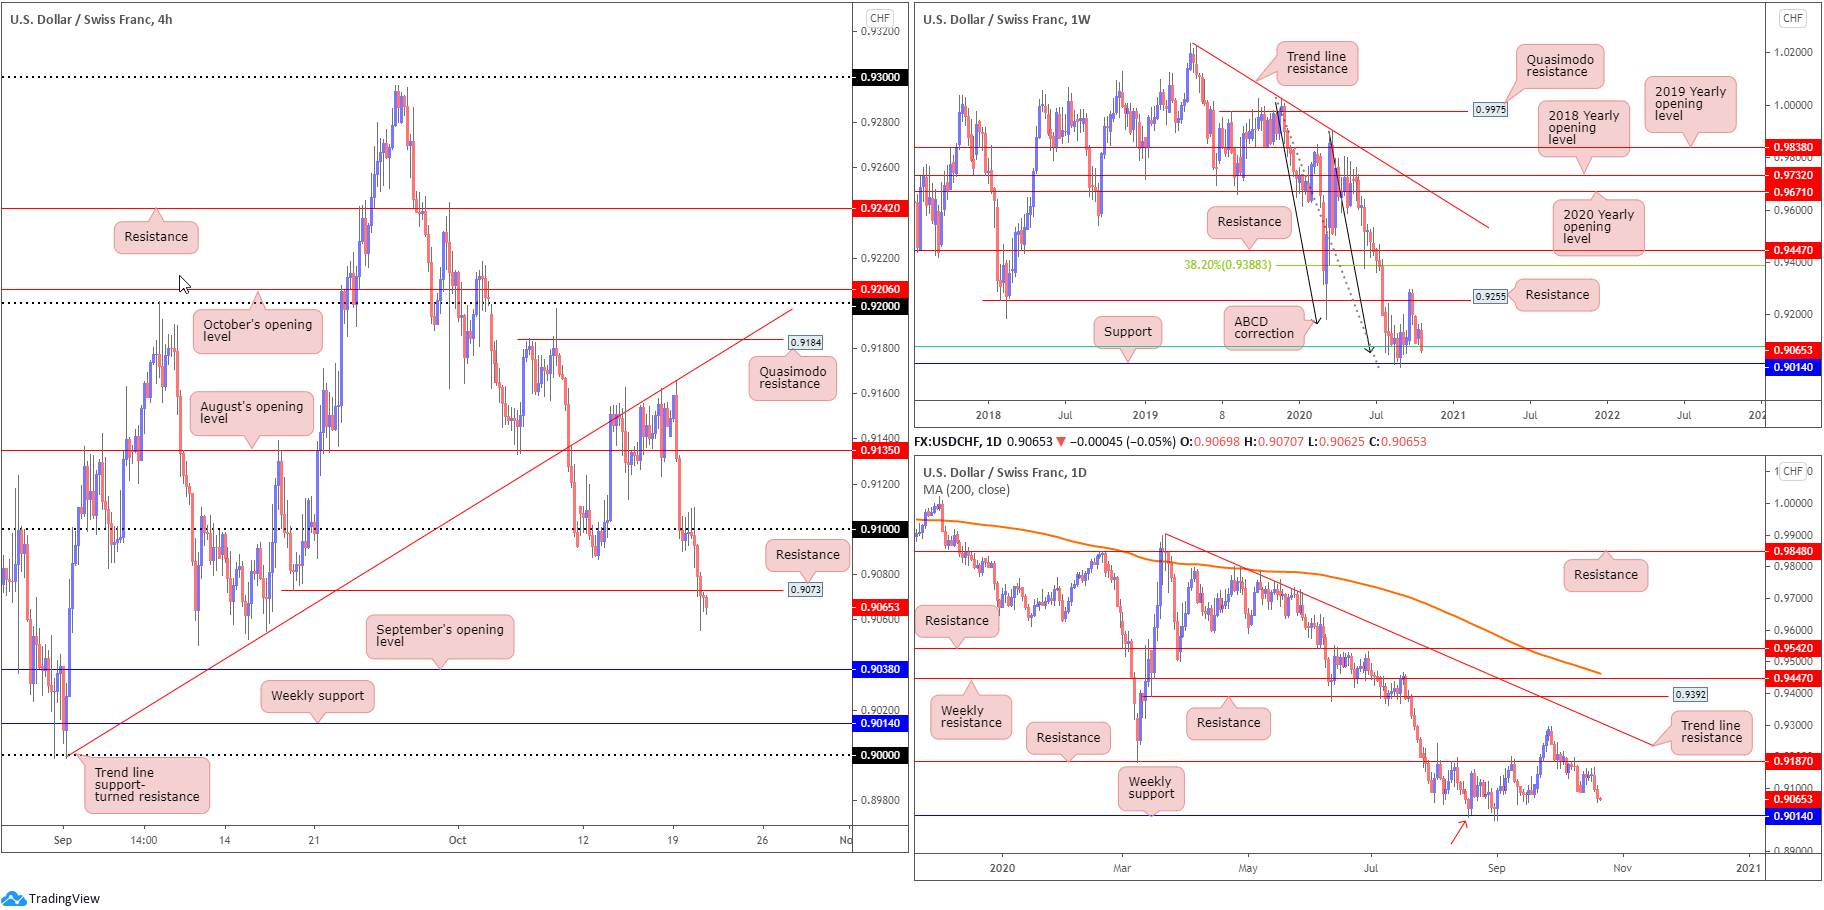
USD/CHF:
Follow-through selling surfaced Tuesday, extending Monday’s 0.5% decline from H4 trend line support-turned resistance, etched from the low 0.8998. After finding resistance at 0.91 in the early hours of Tuesday’s session, USD/CHF nosedived to a session low at 0.9055, a move that’s likely sparked interest in September’s opening value at 0.9038.
From the weekly timeframe, price, as aired in Monday’s technical briefing, retested resistance at 0.9255 (a previous Quasimodo support level) heading into October, movement that subsequently prompted two back-to-back near-full-bodied bearish candles. As a result, support at 0.9014, as well as ABCD support at 0.9051 (black arrows) and a long-term 61.8% Fibonacci retracement ratio at 0.9080 (green line – taken from 0.8300 [January 12 2015]), is in view (the Fib is currently under pressure). It is also worth noting USD/CHF has traded lower since topping in April 2019.
A closer reading of price action on the daily timeframe reveals we’re fast approaching weekly support mentioned above at 0.9014, after failing to grip resistance priced in at 0.9187. What’s interesting is weekly support on the daily chart also represents a Quasimodo support (red arrow – left shoulder).
Areas of consideration:
With the 61.8% Fibonacci retracement ratio at 0.9080 on the weekly timeframe under fire, and room for both weekly and daily price to trade lower, September’s opening value at 0.9038 offers a clean downside target.
H4 successfully retesting 0.9073 resistance (although not the most robust resistance level ever seen) could be enough to interest sellers, though most conservative players are likely to seek additional confirmation before pulling the trigger.
The accuracy, completeness and timeliness of the information contained on this site cannot be guaranteed. IC Markets does not warranty, guarantee or make any representations, or assume any liability regarding financial results based on the use of the information in the site.
News, views, opinions, recommendations and other information obtained from sources outside of www.icmarkets.com.au, used in this site are believed to be reliable, but we cannot guarantee their accuracy or completeness. All such information is subject to change at any time without notice. IC Markets assumes no responsibility for the content of any linked site.
The fact that such links may exist does not indicate approval or endorsement of any material contained on any linked site. IC Markets is not liable for any harm caused by the transmission, through accessing the services or information on this site, of a computer virus, or other computer code or programming device that might be used to access, delete, damage, disable, disrupt or otherwise impede in any manner, the operation of the site or of any user’s software, hardware, data or property.


