Key risk events today:
UK Employment Data; US CPI m/m.
(Previous analysis as well as outside sources – italics).
EUR/USD:
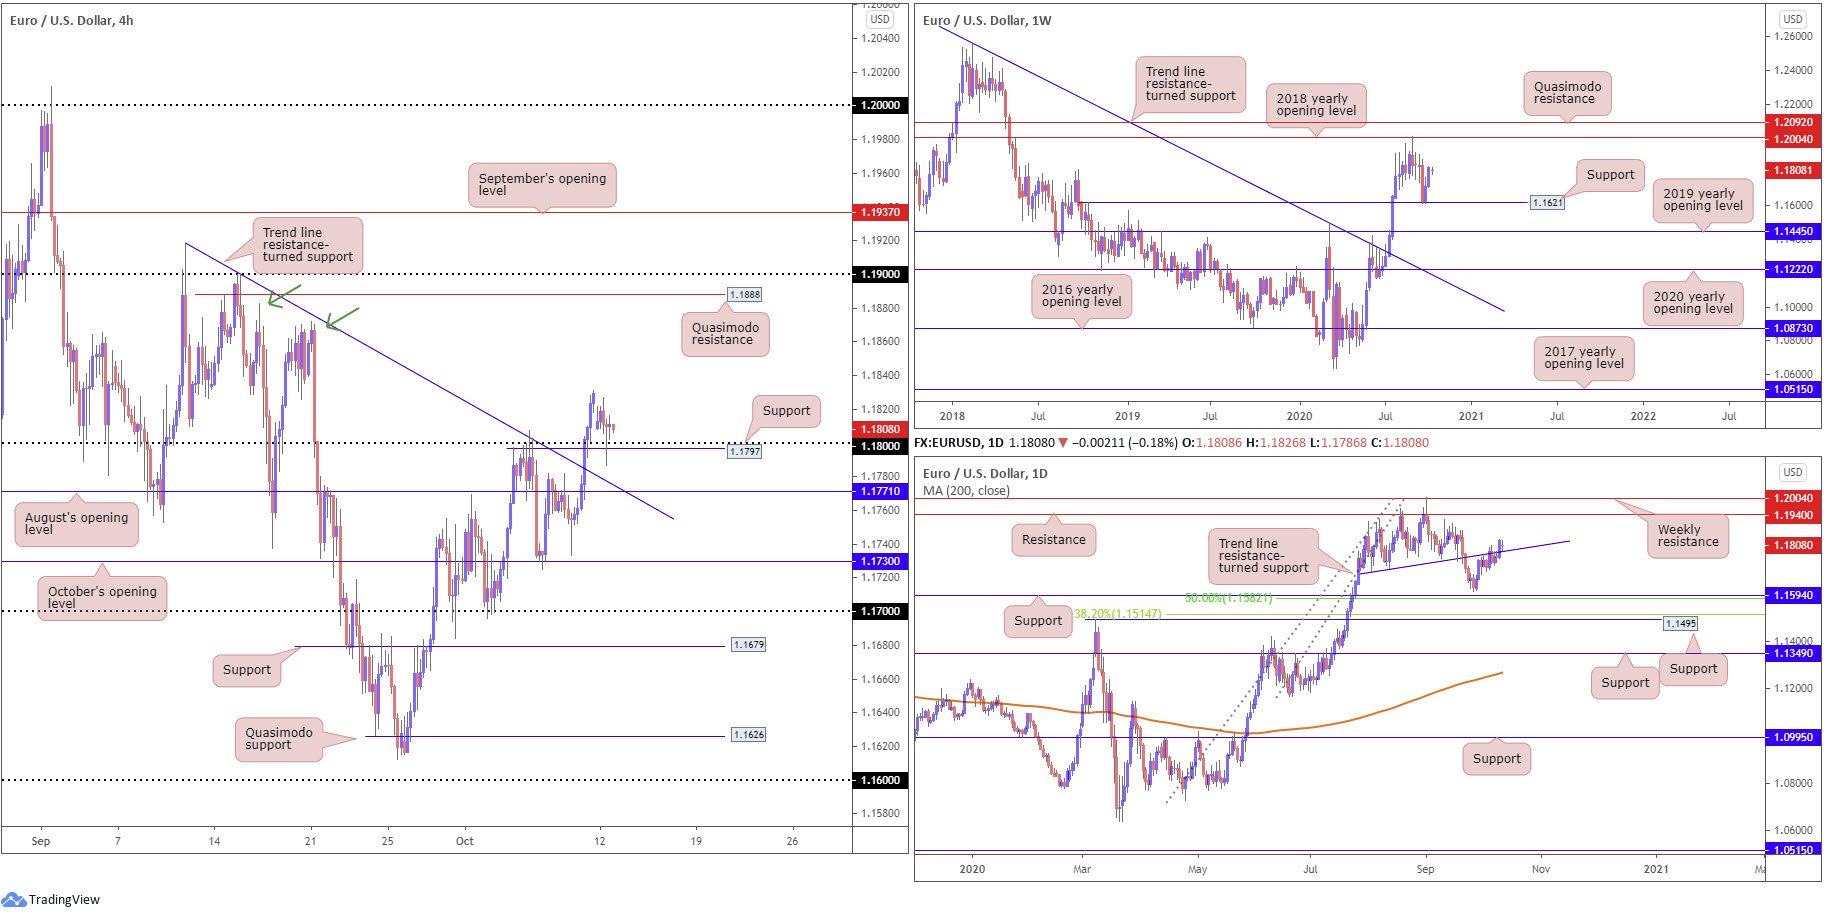
Against the US dollar Monday, holiday-thinned conditions saw Europe’s single currency remain afloat above the 1.18 handle (and H4 support at 1.1797), establishing a clear candlestick tail off session lows at 1.1786. Below here, traders’ crosshairs are likely fixed on August’s opening value at 1.1771 and trend line resistance-turned support, taken from the high 1.1917. North of here, however, we do not see much to hang our hat on in terms of resistance until the Quasimodo formation at 1.1888/1.19 handle makes an appearance. Peaks at 1.1871 (September 21) and 1.1882 (September 16), although feasible resistances (green arrows), are unlikely to offer much downside, as price is likely to be drawn towards the round number (1.19). Consequently, buy-stop liquidity above the aforementioned peaks may help serve any selling that materialises from the 1.19/1.1888 region.
With reference to the higher timeframes, there’s little to report in terms of technical change. Therefore, here’s a reminder of where we left Monday’s technical briefing (italics):
Weekly timeframe:
Stirred by the US dollar index receding to levels not seen since September 21 (in danger of potentially losing 93.00 status), the euro outperformed over the course of last week. This, technically, saw price extend recovery gains off minor support at 1.1621, set just north of the 2019 yearly opening value at 1.1445. An extension to the upside potentially throws the 2018 yearly opening value at 1.2004 back into action.
Daily timeframe:
Since the beginning of October, buyers and sellers have been squaring off at the underside of a trend line support-turned resistance, etched from the low 1.1695. Friday, however, closed sharply above the trend line and consequently turned the spotlight towards resistance at 1.1940. Traders, therefore, may read this (along with the weekly timeframe showing room to advance and the immediate trend facing north since March) as a signal that additional outperformance could be seen, until we at least test 1.1940.
Areas of consideration:
According to chart studies across all three timeframes, buyers have an edge.
As a result, Monday’s rebound from 1.18 (and nearby H4 support at 1.1797 [a prior Quasimodo resistance level]), particularly as it formed a half-hearted hammer candlestick pattern, may lure buyers into the market for a push to the 1.1888 neighbourhood.
GBP/USD:
Sterling finished the European session on a high note against the US dollar on Monday, despite UK PM Boris Johnson announcing new restrictions in order to help curb the surge in coronavirus cases.
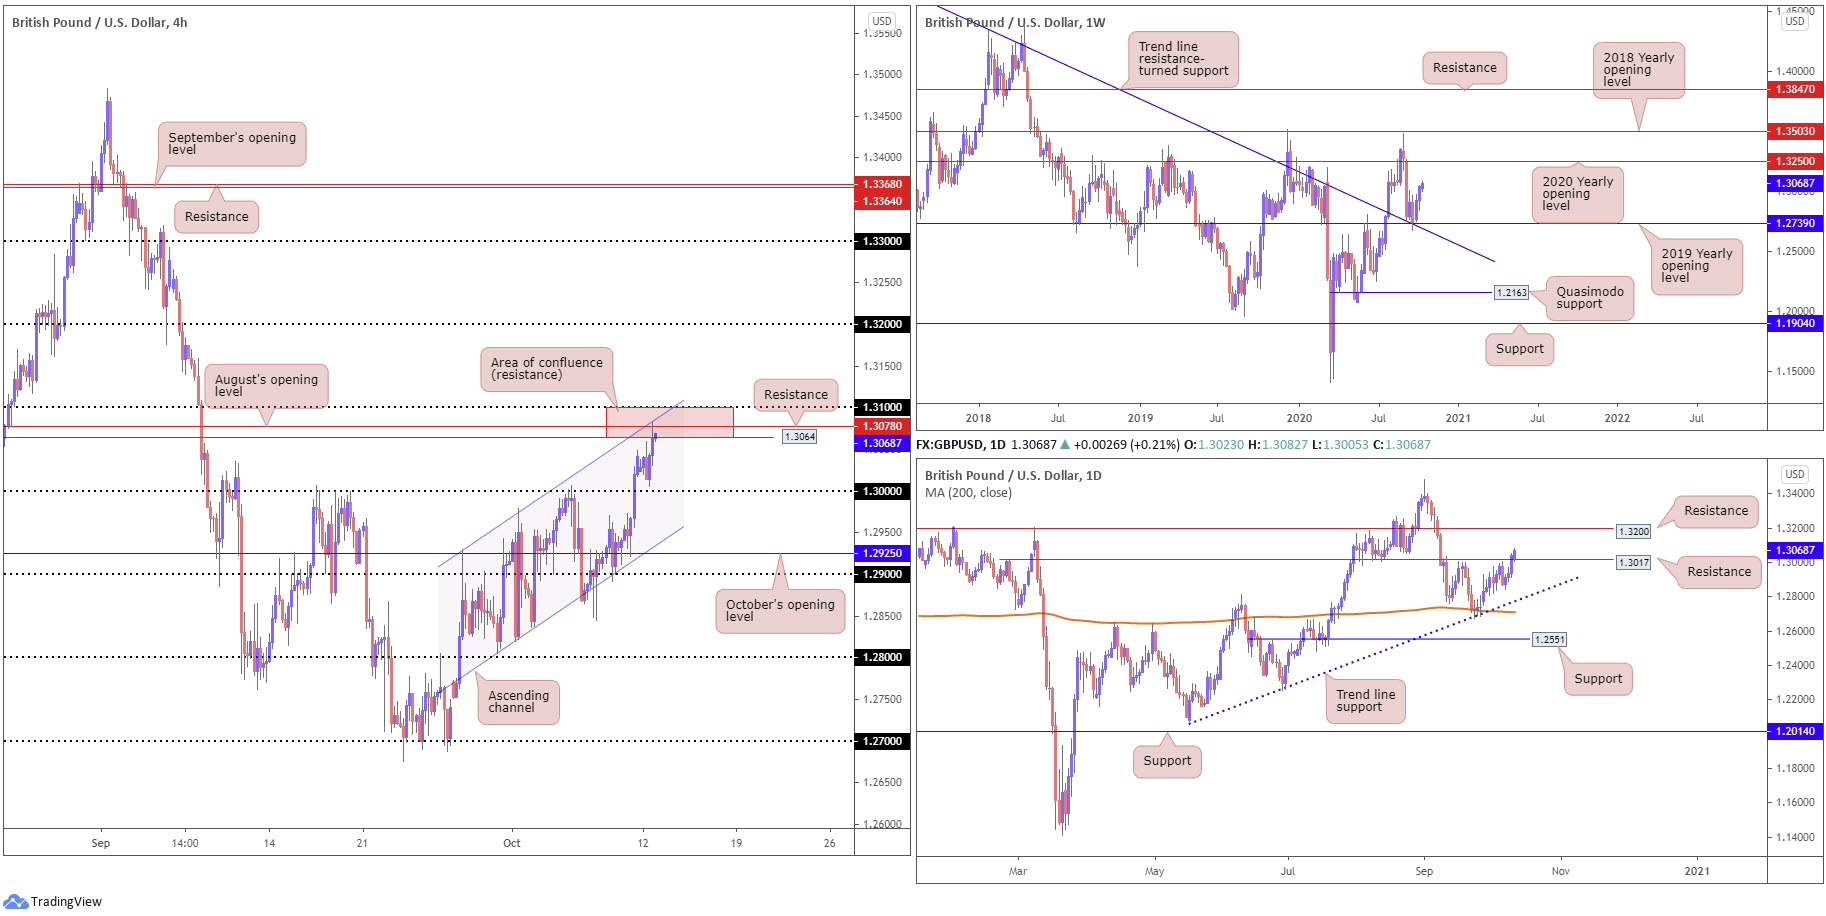
Technically, the H4 timeframe tested an interesting area of resistance between 1.31/1.3064 (red), composed of the 1.31 handle, resistance from 1.3064, August’s opening value at 1.3078 and channel resistance, drawn from the high 1.2929.
Further afield, however, weekly price reveals room to march beyond the H4 resistance zone. Last week observed GBP/USD extend recent recovery gains from support at 1.2739 (a 2019 yearly opening value). Technicians will acknowledge 1.2739 blends with trend line resistance-turned support, extended from the high 1.5930. In terms of resistance, price has room to advance as far north as the 2020 yearly opening value at 1.3250. What’s more, the daily timeframe is seen making headway north of resistance at 1.3017, with eyes on resistance at 1.3200.
Areas of consideration:
On the bearish side, 1.31/1.3064 out of the H4 timeframe may be interpreted as a potential reversal zone. Although the H4 area emphasises strong local confluence, it lacks a higher timeframe connection. As such, a reaction from here may be short-lived.
Clearance of 1.31 on the H4, as a result of the above, might have breakout buyers make an appearance, targeting the 1.32 handle, which also represents daily resistance.
AUD/USD:
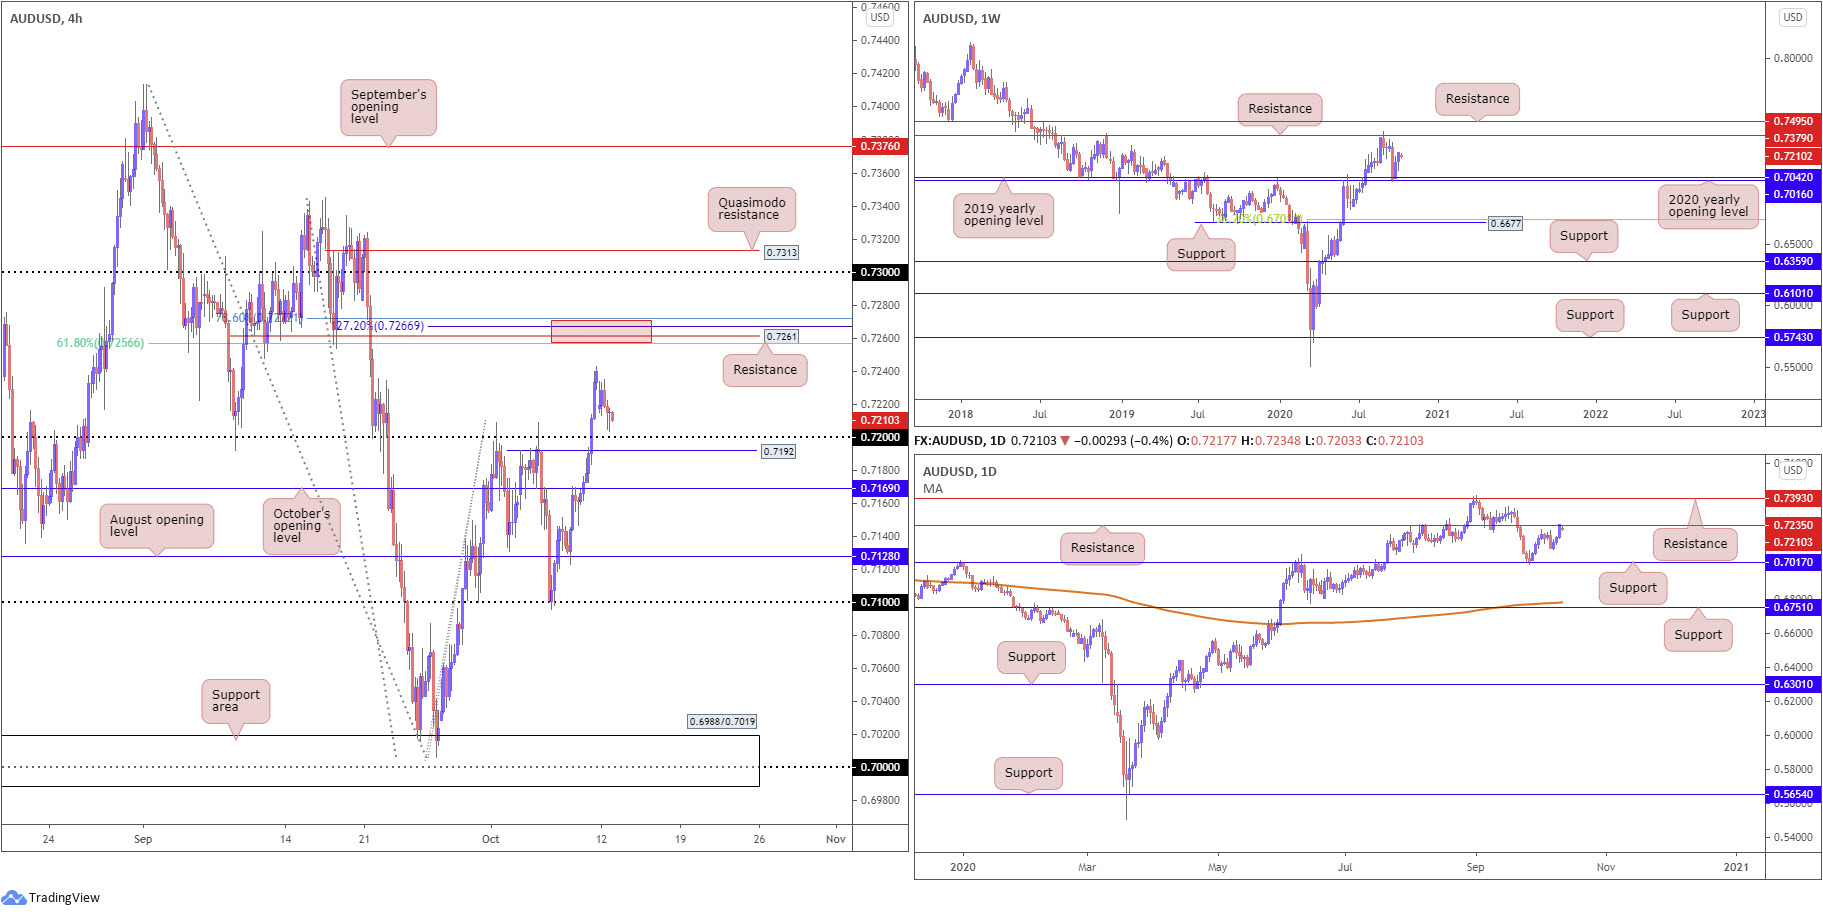
AUD/USD inched lower Monday, as price struggled to find some respite amid thin trading conditions. Snapping a three-day bullish phase, H4 is now within striking distance of retesting 0.72 as support. A rebound from the latter will likely have H4 candles target resistance around 0.7272/0.7256 (red – composed of a 78.6% Fibonacci retracement ratio at 0.7272, a 127.2% Fibonacci projection point at 0.7266, a resistance level at 0.7261 and a 61.8% Fibonacci retracement ratio at 0.7256).
From the higher timeframes, little has changed since Monday’s technical briefing. Consequently, here’s a reminder of where we stand (italics):
Weekly timeframe:
After buyers pencilled in a strong presence off the 2020 (0.7016) and 2019 (0.7042) yearly opening levels, additional upside developed last week. Additional bullish sentiment could target as far north as resistance at 0.7379. It might also be worth noting the trend in this market remains to the upside, therefore the recent rebound from 0.7016/0.7042 may have been interpreted as a dip-buying signal.
Daily timeframe:
Despite a reasonably clear run higher on the weekly timeframe, daily flow must contend with resistance at 0.7235. This level boasts a reasonably solid history, therefore active selling could materialise. While downside attempts from the level are unlikely to reach this far south (in view of the weekly timeframe’s position and the current trend pointing higher since March), 0.7017 is noted as the next potential support target. Filling buy-stop liquidity north of resistance at 0.7235 could motivate moves to resistance at 0.7393 (located a touch above weekly resistance at 0.7379).
Areas of consideration:
Downside pressure from daily resistance at 0.7235 may force a 0.72 H4 retest. It is also worth factoring in H4 support at 0.7192, considering round numbers tend to attract fakeouts. With the weekly timeframe poised to explore higher levels, 0.72 may be viewed as a bullish reversal zone, targeting the H4 resistance area at 0.7272/0.7256 (located beyond current daily resistance).
USD/JPY:
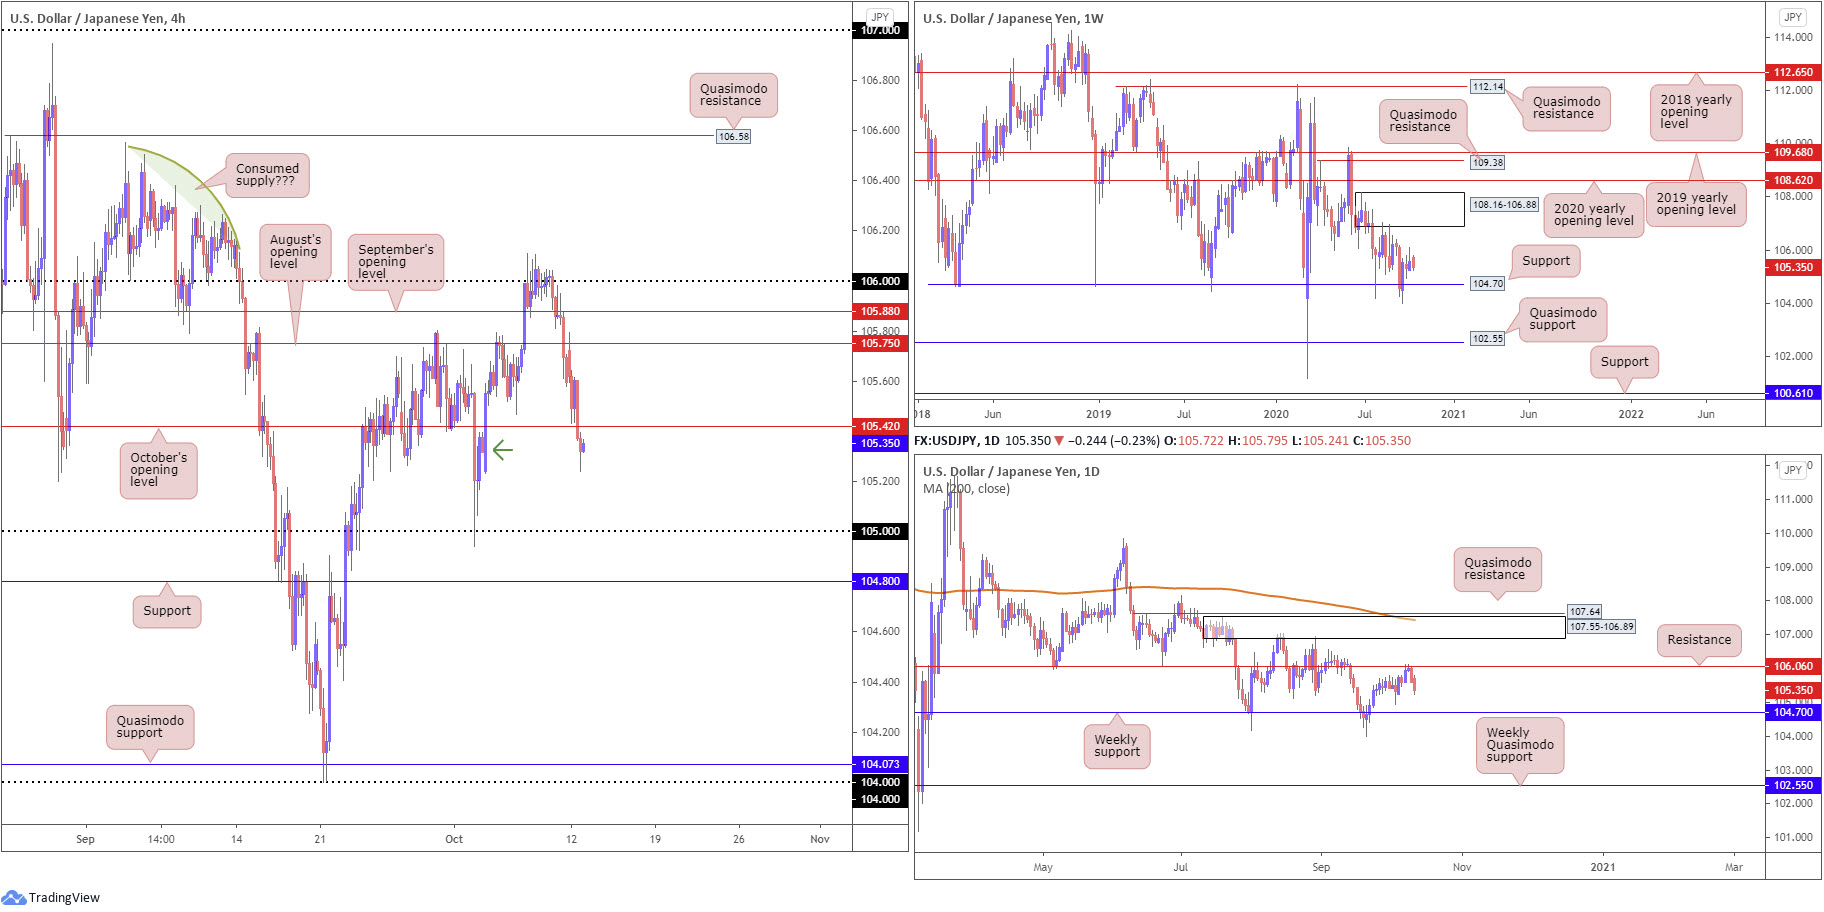
Amidst a holiday-thinned session, USD/JPY kicked off the week on the backfoot. Likely weighed by the DXY finishing considerably off best levels, H4 crossed through October’s opening value at 105.42. Although minor demand is seen around 105.35ish (green arrow), shifting towards 105 is possible (maybe even support priced in at 104.80).
Support at 104.70 remains a watched level on the weekly timeframe, particularly after recently welcoming a 1% rebound. Supply at 108.16-106.88 also remains prominent from the weekly chart, capping upside since early August. Quasimodo support at 102.55 offers a feasible target beyond current support in the event we turn south, while removing supply draws the 2020 yearly opening value at 108.62 into the fight.
Last week shook hands with daily resistance at 106.06, a level mostly ignored since serving as support during May and June. Friday’s strong bearish presence clearly motivated additional bearish sentiment Monday, possibly providing enough impetus to take aim at the weekly support level mentioned above at 104.70. Alternatively, if resistance at 106.06 gives way, supply at 107.55-106.89, an area housed within the lower boundary of weekly supply underlined above at 108.16-106.88, is seen. Of note, the daily area also benefits from nearby Quasimodo resistance at 107.64 and the 200-day SMA (orange – 107.43).
Areas of consideration:
With October’s opening value at 105.42 (H4) now to potentially serve as resistance, bearish scenarios could form to target 105 today, as well as H4 support at 104.80, which, of course, is situated just north of weekly support at 104.70.
USD/CAD:
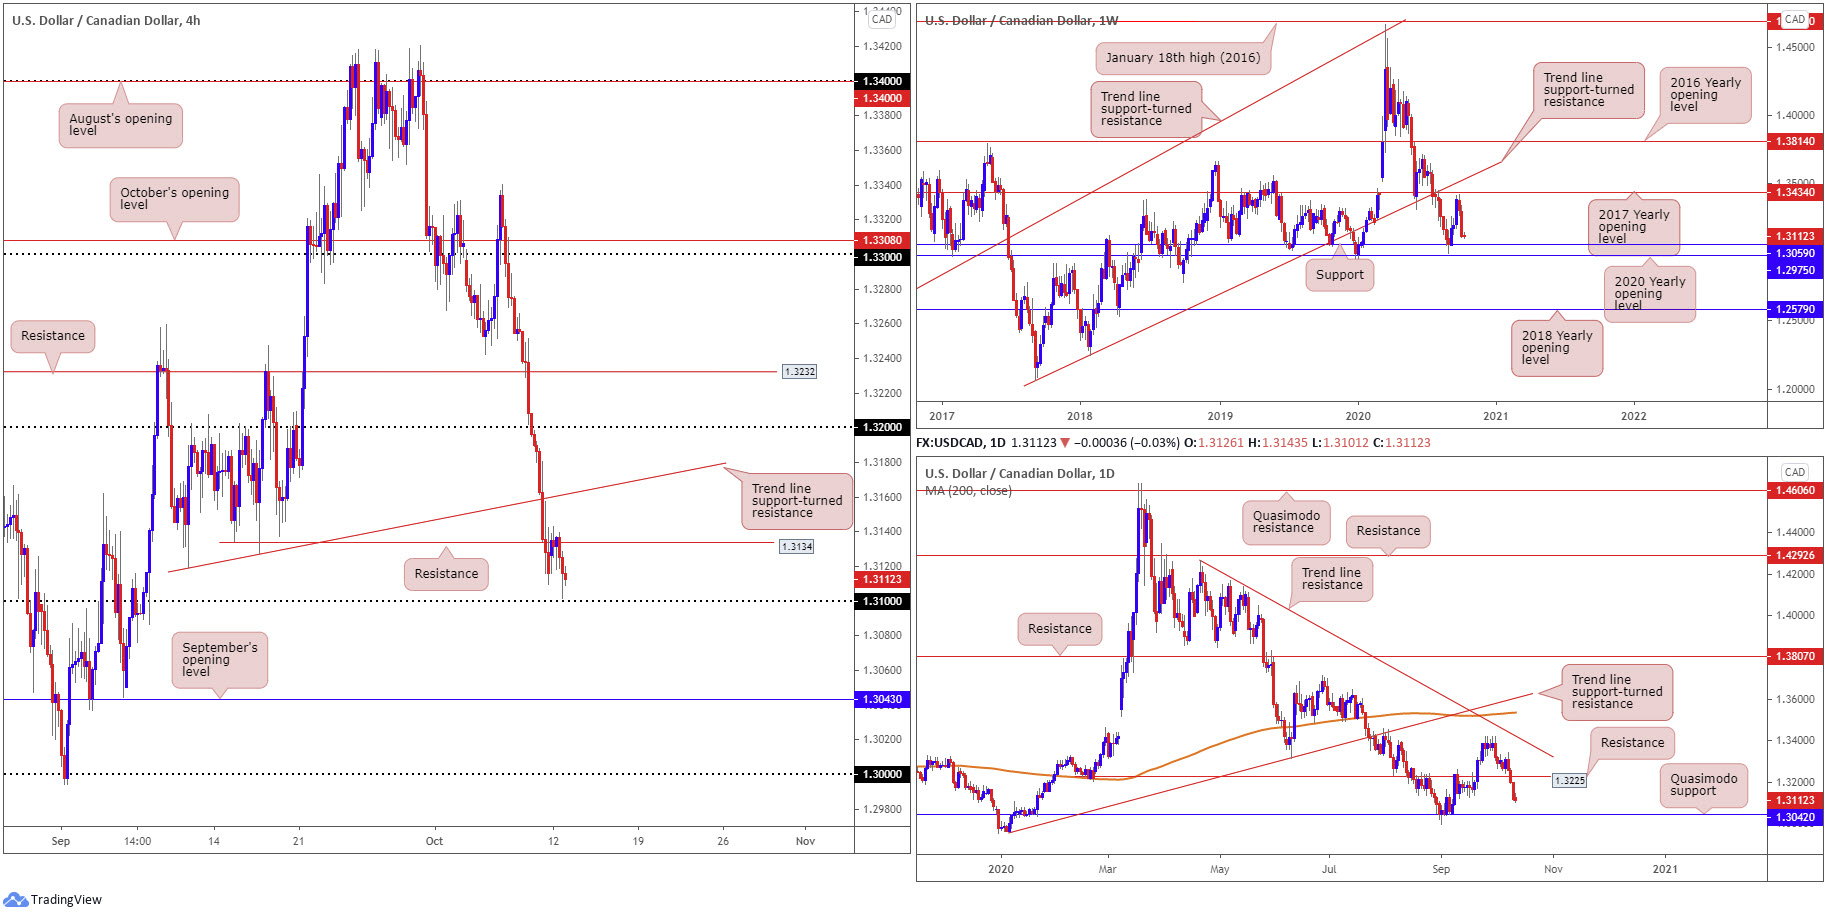
Downside momentum dried up considerably Monday, largely as a result of the Columbus Day and Thanksgiving Day holiday in the US and Canada. WTI prices, however, took a tumble, dropping more than 2.5% and taking price below $40 a barrel.
USD/CAD technical action, based on the H4 timeframe, reveals a near-test of the 1.31 handle occurred yesterday, with resistance seen overhead at 1.3134 (a previous Quasimodo support). Sliding through the 1.31 level unlocks the possibility of further deterioration to September’s opening value at 1.3043 and maybe even the key figure 1.30.
Higher up on the technical curve, we can see recent weakness generated sufficient impetus to throw 1.3059 back into the pot as potential support, closely shadowed by the 2020 yearly opening value at 1.2975. Interestingly, should we eventually puncture the 1.2951 December 30 low (2019), stops (placed by trend traders) are likely to come under fire and exacerbate downside.
From the daily timeframe, after navigating terrain under support at 1.3225 (now serving as resistance) last week, the absence of obvious support until reaching the Quasimodo formation at 1.3042 could promote further selling.
Areas of consideration:
Outlook unchanged.
On account of both weekly and daily price displaying elbow room to retreat further, a 1.31 breach on the H4 timeframe should not surprise, a move that may trigger a bearish setting towards September’s opening value at 1.3043 (H4).
1.3043, in addition to weekly support priced in at 1.3059 and a daily Quasimodo support at 1.3042, serves as a robust downside target for short positions. Equally, the area may also appeal to buyers.
USD/CHF:
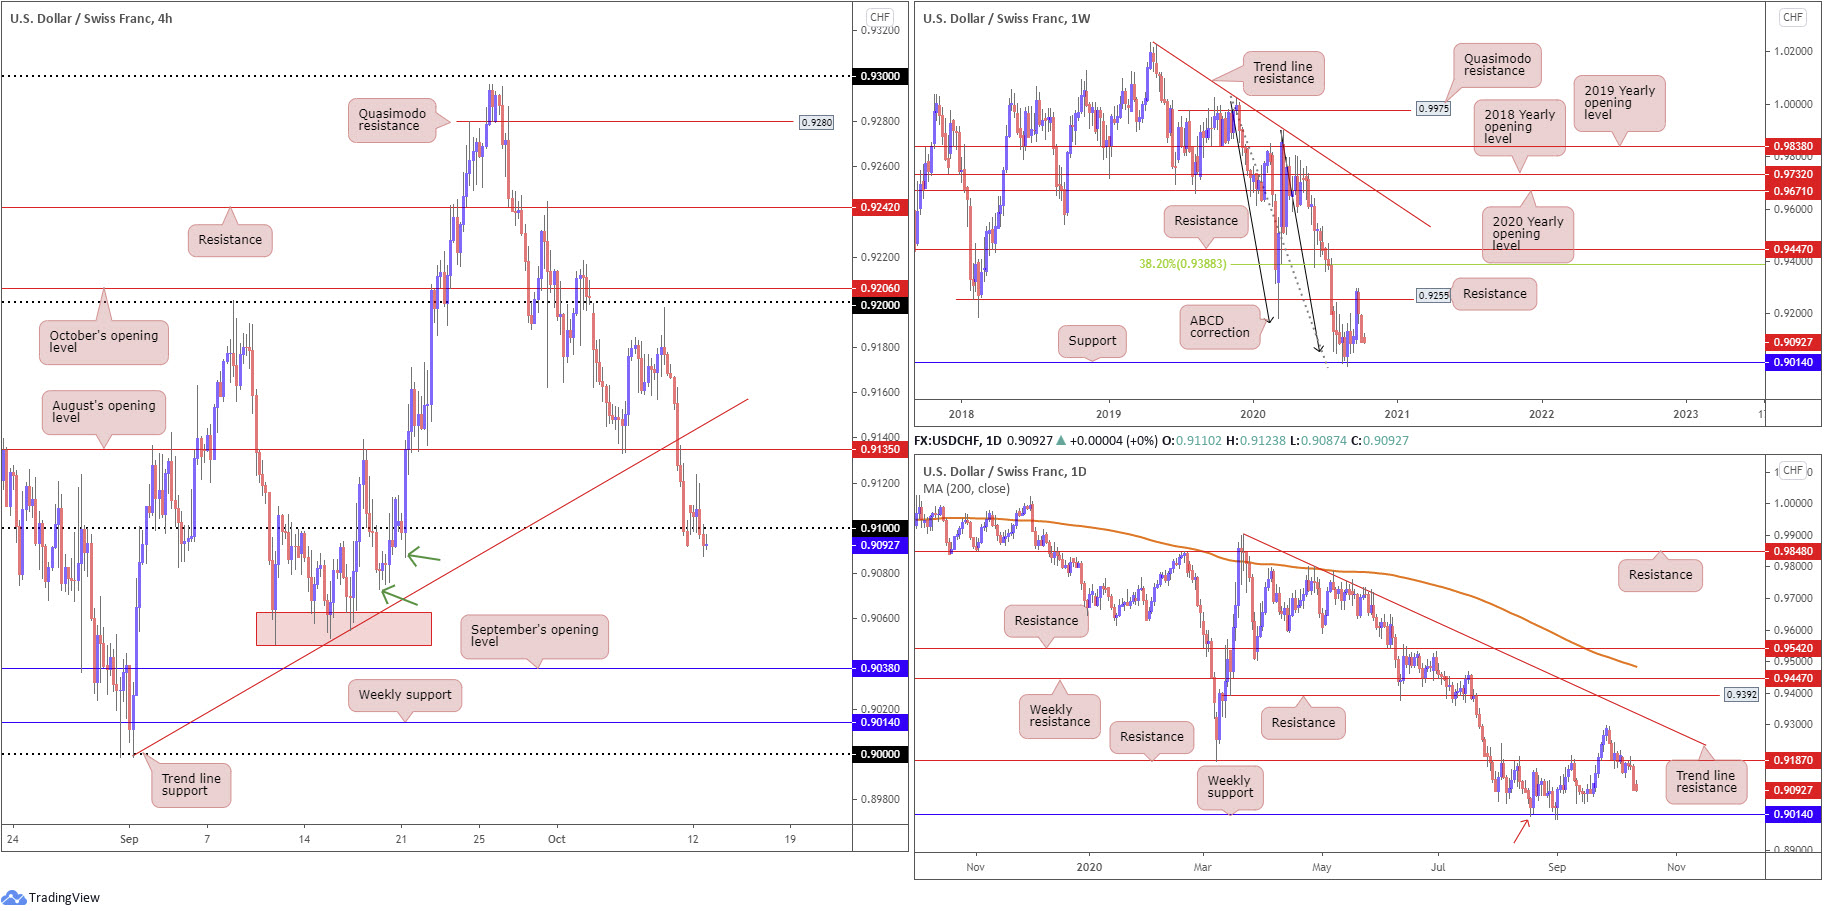
USD/CHF offered slim trading conditions Monday, fading session peaks a touch north of the 0.91 handle on the H4 timeframe to end the day south of the psychological number. With demand to the left of current price appearing consumed/fragile (note the possible consumption tails at 0.9087 and 0.9073 – green arrows), traders may feel a push for 0.9060 support (red) or September’s opening value at 0.9038 could be on the cards.
From the higher timeframes, limited change is seen, therefore here’s a reminder of where we left Monday’s technical briefing:
Weekly timeframe:
After testing resistance at 0.9255 (a previous Quasimodo support level) buyers took a step back, consequently establishing two back-to-back near-full-bodied bearish candles. As a result, support at 0.9014, as well as ABCD support at 0.9051 (black arrows), is turf that may be retested. It is also worth noting USD/CHF has traded lower since topping in April 2019.
Daily timeframe:
A closer examination of price action on the daily timeframe reveals the unit retested resistance from 0.9187 last week, with Friday rotating aggressively lower and pencilling in a near-full-bodied bearish candle. What’s interesting is daily price also has weekly support at 0.9014 in its sights, though on the daily chart the weekly level also represents a Quasimodo support (red arrow).
Areas of consideration:
With H4 showing little intent of holding 0.91, traders will likely interpret this weakness as an indication to pursue bearish themes, targeting 0.9060/0.9038. Downside movement below 0.91 is also in line with both weekly and daily charts showing room to discover deeper terrain.
Dow Jones Industrial Average:
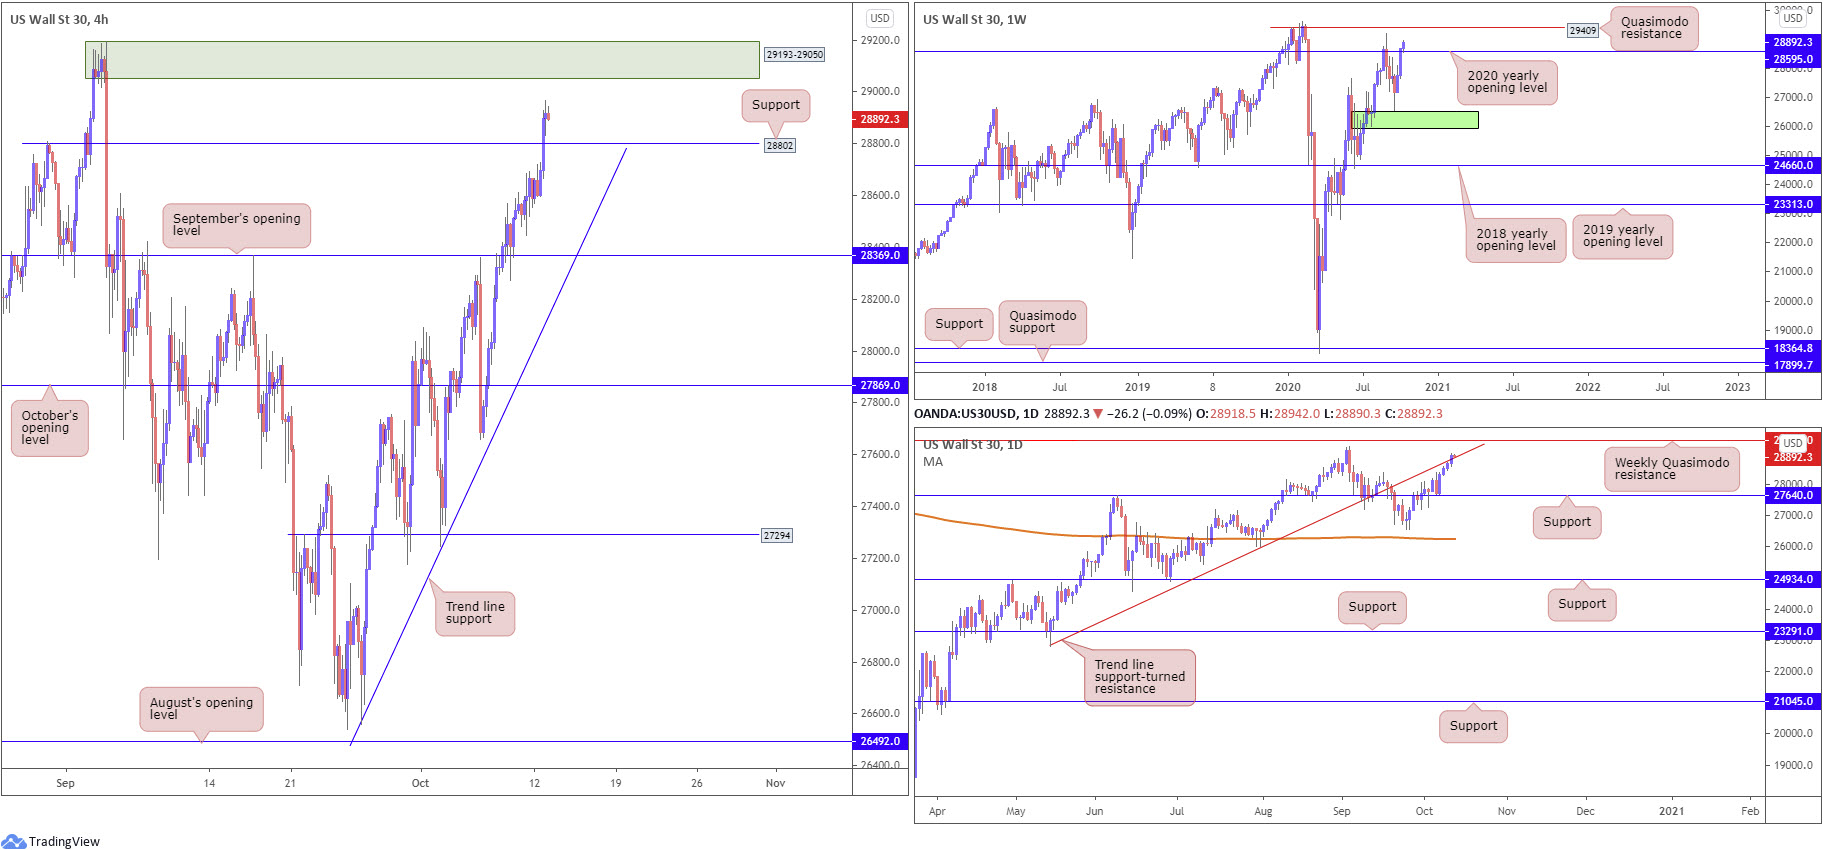
Fuelled on the back of a rally in large tech stocks, US equity benchmarks sailed higher Monday. The Dow Jones Industrial Average advanced 250.62 points, or 0.88%; the S&P 500 climbed 57.09 points, or 1.64% and the Nasdaq traded higher by 296.31 points, or 2.56%.
Monday’s upbeat tone took the H4 candles above Quasimodo resistance at 28802 (now a possible support), consequently shining the spotlight on supply at 29193-29050.
From the weekly timeframe, we can see price recently engaged (and surpassed) the 2020 yearly opening value at 28595. Quasimodo resistance at 29409 is seen as the next potential hurdle before we’re clear to attack all-time peaks at 29595 set in early February.
Daily price is still seen flirting with trend line support-turned resistance, extended from the low 22803. A rejection from the aforementioned trend line has support at 27640 to target, while continuation buying offers buyers an early signal we’re likely headed for the weekly Quasimodo resistance mentioned above at 29409.
Areas of consideration:
A retest at H4 support from 28802, knowing the weekly timeframe has space to reach for at least 29409, could be a setup of interest for buyers today, initially targeting H4 supply at 29193-29050.
XAU/USD (GOLD):
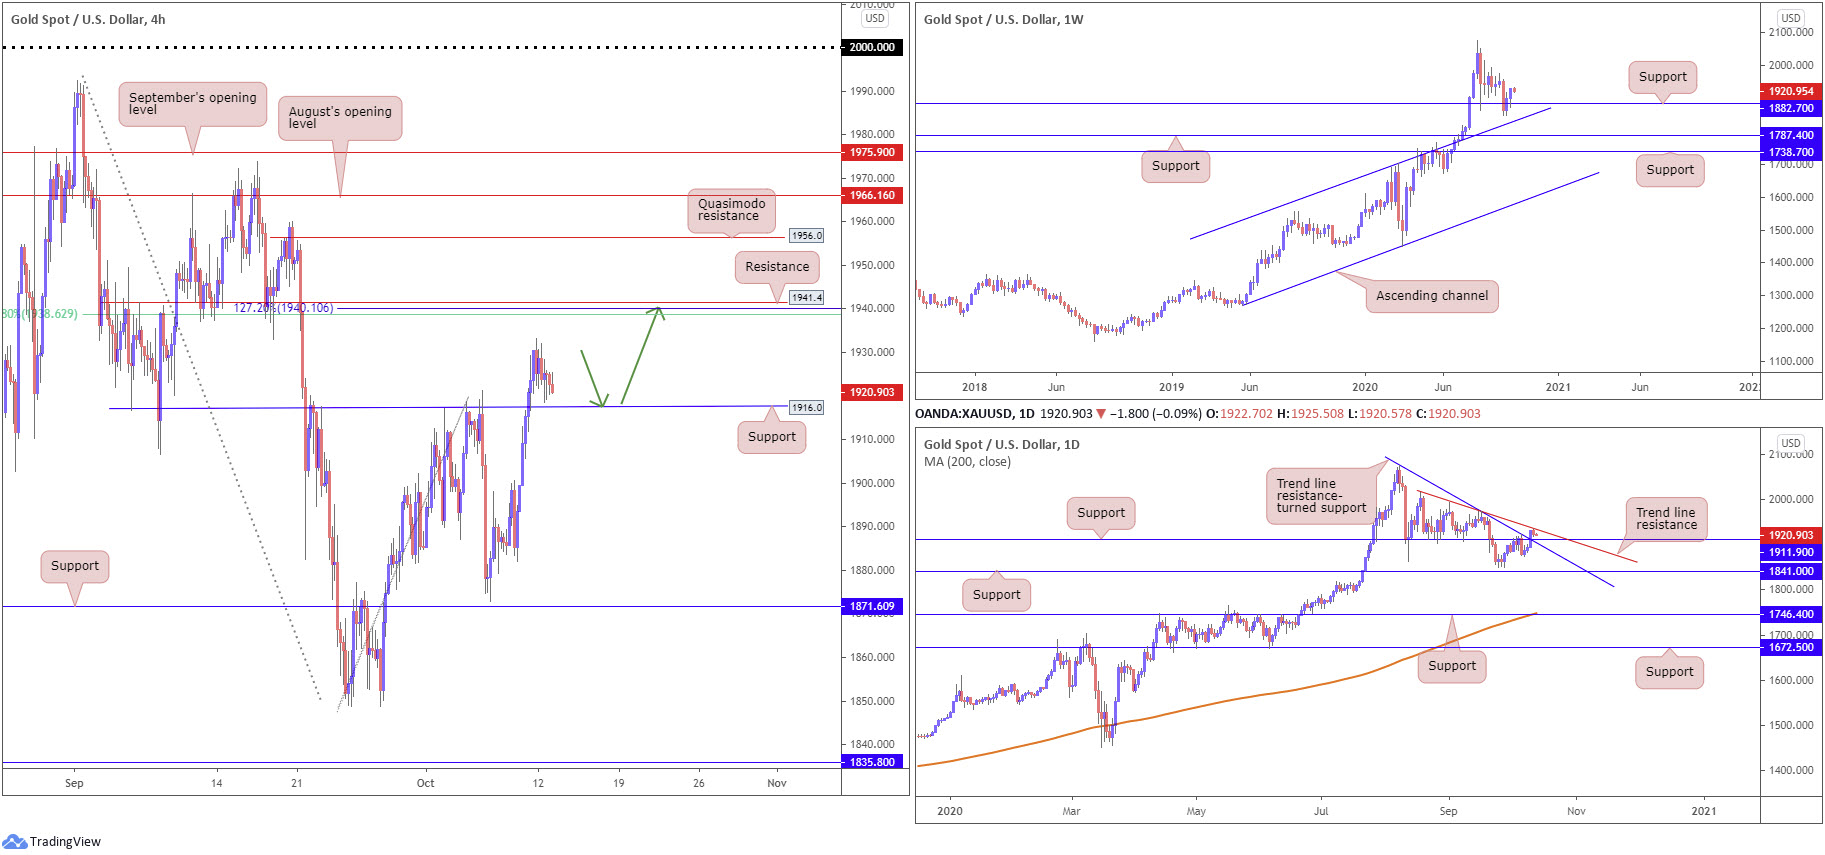
Gold concluded a shade lower against its US counterpart on Monday, slowed on the back of holiday-thinned trading. In view of yesterday’s lacklustre performance, much of the following will echo thoughts put forward in Monday’s technical briefing (italics).
From the weekly timeframe:
Despite an active push to lows at $1,848, support at $1,882 (positioned above channel resistance-turned support, taken from the high $1,703) appears to have survived, with last week’s session closing at its highs. In addition to this, the trend in this market has faced decisively north since 2016. Are we headed for the $2,075 all-time peak?
Daily timeframe:
Although initially defending resistance at $1,911 at the beginning of last week, daily price pushed above the level on Friday (now a potential support), as well as above converging trend line resistance, extended from the high $2,075. Scope to approach another trend line resistance, taken from the high $2,015, is seen on this timeframe, while a break here exposes the all-time high $2,075, given the lack of clear supply.
H4 timeframe:
Intraday bulls cheered a break of the $1,900 mark and resistance priced in at $1,916 Friday (now a potential support), with enough oomph to nudge resistance at $1,941 in sight. Traders will also acknowledge a 127.2% Fibonacci projection point at $1,940 and a 61.8% Fibonacci retracement ratio at $1,938 converges with the resistance. What’s also technically appealing here is daily trend line resistance ($2,015) merges with the resistance levels.
Despite the confluence offered around $1,941, Quasimodo resistance is still worth noting, resting at $1,956, followed by August’s opening value at $1,966.
Areas of consideration:
A $1,916 retest on the H4 (green arrows) today could be enough to spark buying, considering we’re coming from weekly support at $1,882. The H4 resistance at $1,941 serves as a logical upside target for longs, and somewhere fresh sellers may make a show, having noted the H4 and daily confluence.
The accuracy, completeness and timeliness of the information contained on this site cannot be guaranteed. IC Markets does not warranty, guarantee or make any representations, or assume any liability regarding financial results based on the use of the information in the site.
News, views, opinions, recommendations and other information obtained from sources outside of www.icmarkets.com.au, used in this site are believed to be reliable, but we cannot guarantee their accuracy or completeness. All such information is subject to change at any time without notice. IC Markets assumes no responsibility for the content of any linked site.
The fact that such links may exist does not indicate approval or endorsement of any material contained on any linked site. IC Markets is not liable for any harm caused by the transmission, through accessing the services or information on this site, of a computer virus, or other computer code or programming device that might be used to access, delete, damage, disable, disrupt or otherwise impede in any manner, the operation of the site or of any user’s software, hardware, data or property.


