EUR/USD:
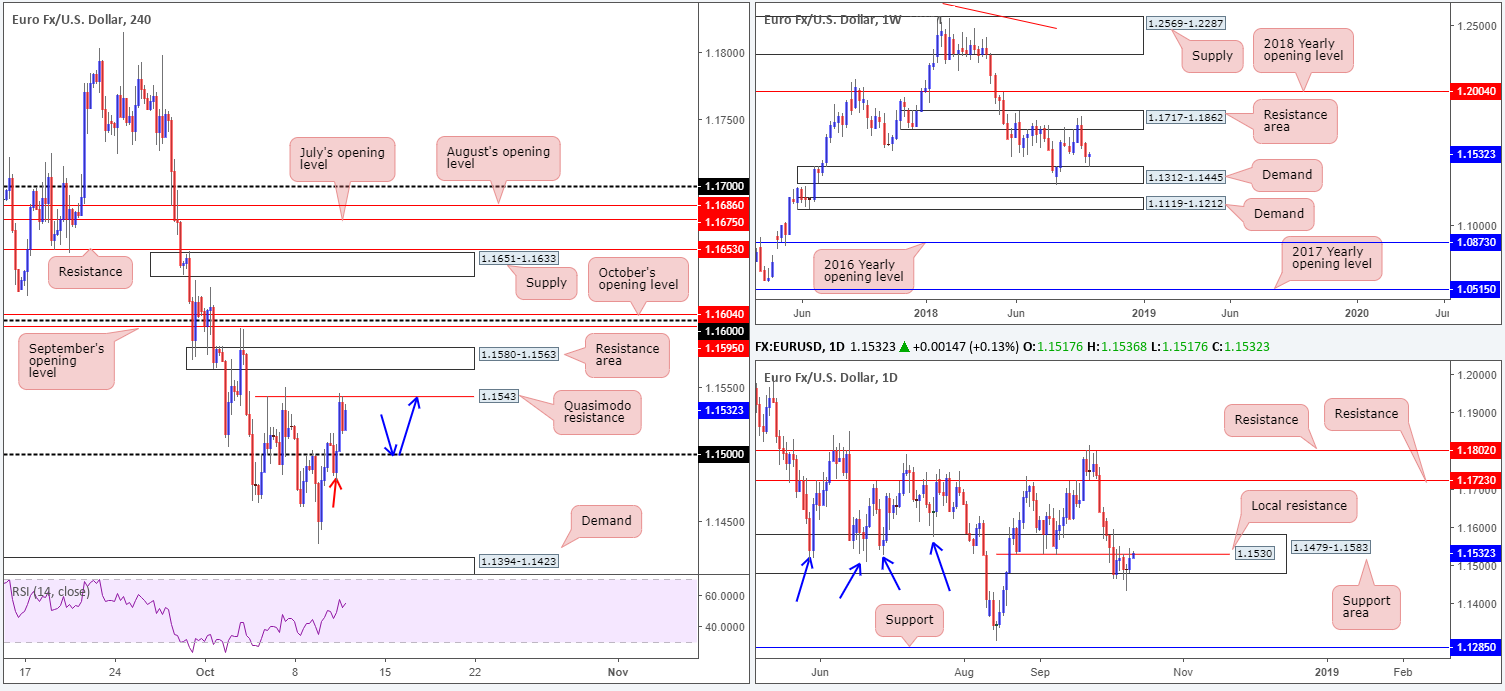
EUR/USD bulls went on the offensive on Wednesday, dethroning its 1.15 handle on the H4 timeframe and challenging nearby Quasimodo resistance at 1.1543. According to our technical studies on the weekly timeframe, further buying could be in store. Demand at 1.1312-1.1445, as you can see, is firmly in play at this point, with room for the unit to press as far north as a resistance area plugged in at 1.1717-1.1862.
Despite the bullish picture painted by our weekly candles, the short-term outlook (H4) does not really bode well for those looking to buy the pair. Beyond the current Quasimodo resistance barrier, a nearby resistance area rests at 1.1580-1.1563, followed closely by the 1.16 mark, which happens to be surrounded by October and September’s opening levels at 1.1604 and 1.1595, respectively. Another factor to remain cognizant of is the local daily resistance level plotted at 1.1530.
Areas of consideration:
Although further buying is likely to take place as weekly action generally takes precedence over its lower timeframes, a cautionary approach above 1.15 is still recommended.
On account of the above reading, a retest of 1.15 could be something to keep an eye on today. Why here? Before the H4 candles advanced to higher ground on Wednesday, price closed above 1.15 and then dipped to lows of 1.1479 (red arrow). You can also see following the pair reclaiming 1.15 status the market never retested the number, therefore, there may be unfilled buy orders still present for a long.
Traders are, however, urged to consider waiting for additional candlestick confirmation before pulling the trigger off 1.15, either on the H4 or on the lower timeframes. Not only will this display buyer intent, it’ll also provide traders entry/stop levels. The first area of concern from here falls in at 1.1543.
Today’s data points: ECB Monetary Policy Meeting Accounts; US CPI m/m; Treasury Currency Report.
GBP/USD:
The British pound rose firmly higher against major rivals on Wednesday amid further reports suggesting progress towards a deal between the UK and EU in time for next week’s Summit.
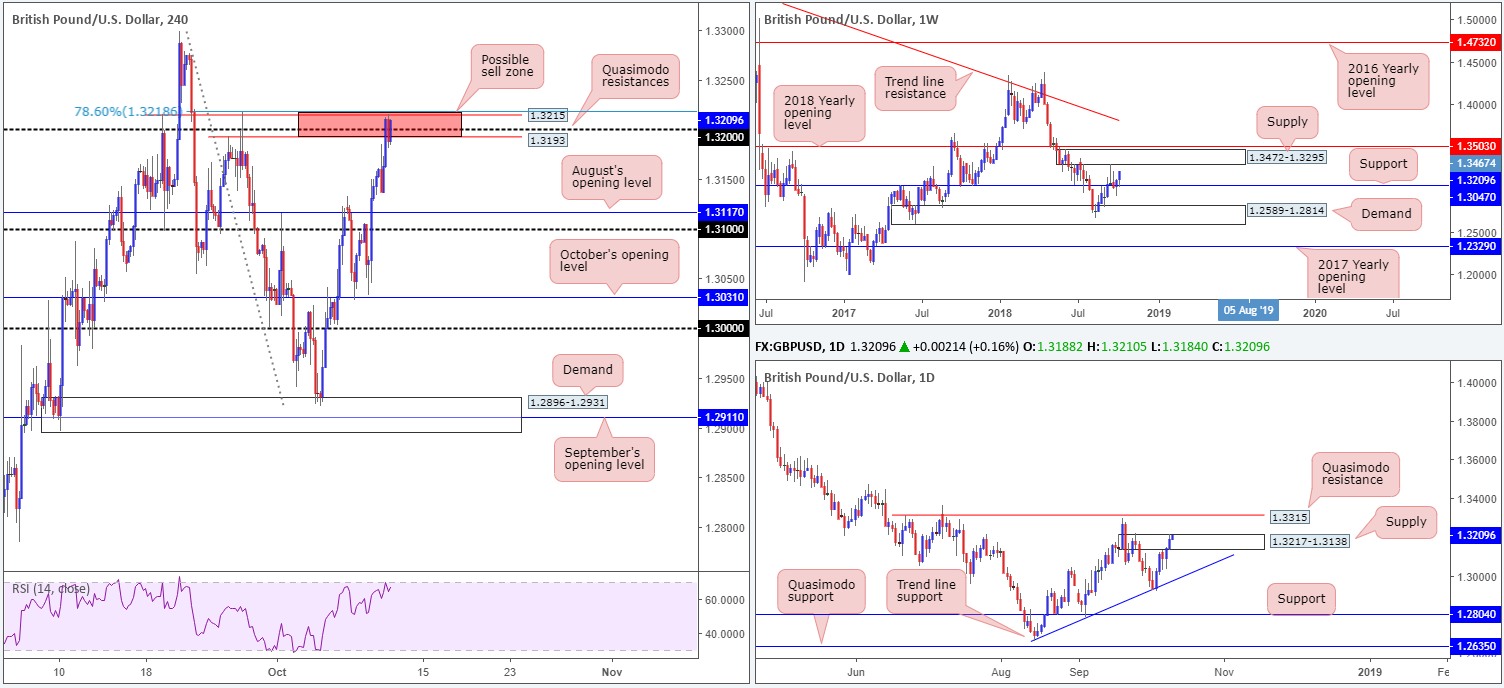
Leaving August’s opening level at 1.3117 unchallenged, the H4 candles took the GBP/USD exchange rate into 1.32 territory. Note the team has been banging the drum about this area as a possible sell zone in past reports, given its convergence with a 78.6% H4 Fib resistance value at 1.3218, a H4 Quasimodo resistance at 1.3215, the 1.32 handle and another H4 Quasimodo resistance at 1.3193 (red zone). In addition to this, traders may also want to acknowledge the H4 zone is sited within the upper limits of daily supply marked at 1.3217-1.3138.
The only caveat to selling this area is seen on the weekly timeframe, visibly displaying room to press beyond our H4 sell zone to supply at 1.3472-1.3295.
Areas of consideration:
With buyers and sellers battling for position within our noted H4 sell zone at present, traders are urged to consider waiting for a confirming candlestick play before pressing the sell button here. A bearish pin-bar formation or engulfing pattern would be ideal (provides traders stop/entry levels). The idea behind this additional candle confirmation is simply to help avoid being taken out on weekly buying!
In the event a short comes to fruition, the first take-profit target falls in around August’s opening level mentioned above at 1.3117.
Today’s data points: BOE Gov. Carney Speaks; BOE Credit Conditions Survey; MPC Member Vlieghe Speaks; US CPI m/m; Treasury Currency Report.
AUD/USD:
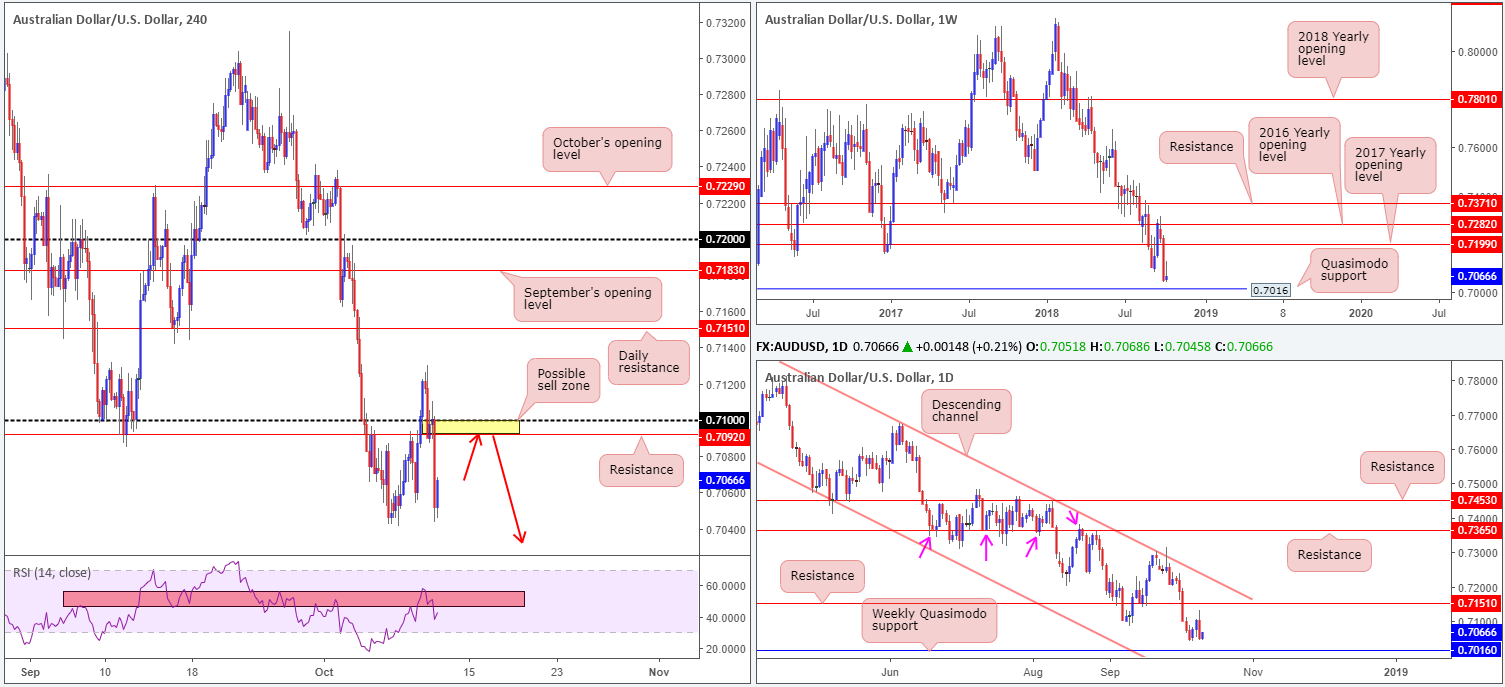
Unable to benefit from its US counterpart’s demise, the commodity currency found strong selling present after retesting its 0.71 handle. The move brought the H4 candles beneath the October 9 low of 0.7054 and to within striking distance of its October 8 low at 0.7041.
Arguably, aside from 0.7041, there’s limited technical support left in this market (checked as far back as February 2016) until we reach 0.7016: a weekly Quasimodo support.
Areas of consideration:
In the event H4 price pulls back to 0.71/0.7092 today and is accompanied with a H4 bearish candlestick formation (stop/entry levels in accordance with the confirming pattern structure), further downside from here is possible, with an ultimate target set at 0.7016.
Should the short come into play during today’s sessions, reducing risk to breakeven and taking partial profits off the table on a test of the October 8 low at 0.7041 is suggested.
Today’s data points: US CPI m/m; Treasury Currency Report.
USD/JPY:
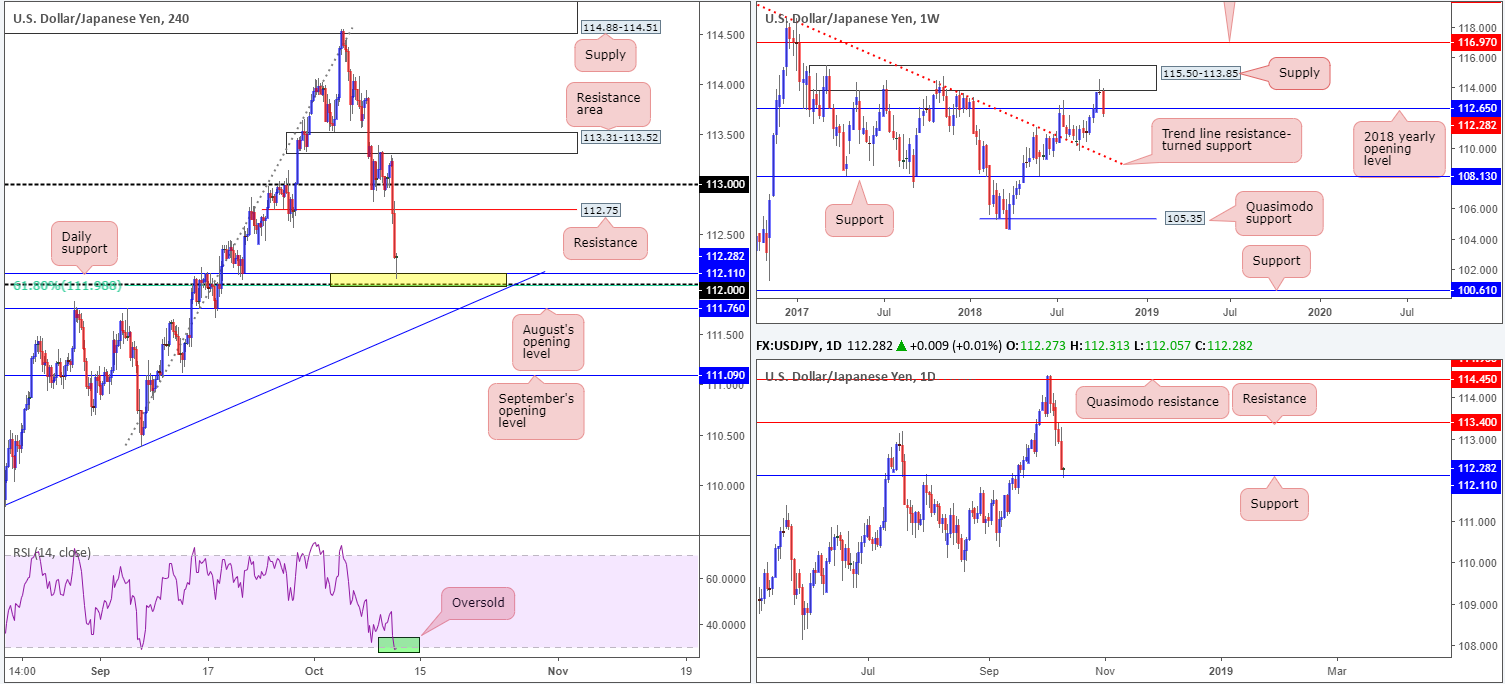
The USD/JPY registered its fifth consecutive loss on Wednesday, dropping more than 0.60% on the day. From an overall peak of 114.55, the unit overthrew a major level on the weekly timeframe: the 2018 yearly opening base at 112.65.
All may not be lost, though, fellow traders! In recent hours, signs of recovery is being seen on the daily chart off support coming in at 112.11. Note on the H4 timeframe, this level is further bolstered by the 112 handle and converging 61.8% H4 Fib support at 111.99 (yellow zone). In fact, H4 price is in the neighbourhood of closing out its current candle in the shape of a bullish pin-bar formation with supporting oversold conditions visible from the RSI indicator. The question is will this be enough to bring weekly price back above its 2018 yearly level? We think it might.
Areas of consideration:
Should the current H4 candle close as is, candlestick enthusiasts will likely enter at the close of the candle and position stops a few pips beyond 112. Despite weekly price trading marginally beyond its 2018 point, H4 action shows room to press as high as resistance at 112.75, followed by daily resistance at 113.40. Both are viable upside targets to have eyes on.
Today’s data points: US CPI m/m; Treasury Currency Report.
USD/CAD:
Despite the US dollar index breaking 95.50 to the downside, USD/CAD’s price recorded healthy gains on Wednesday as the pair struggled to find demand amid the crude oil selloff.
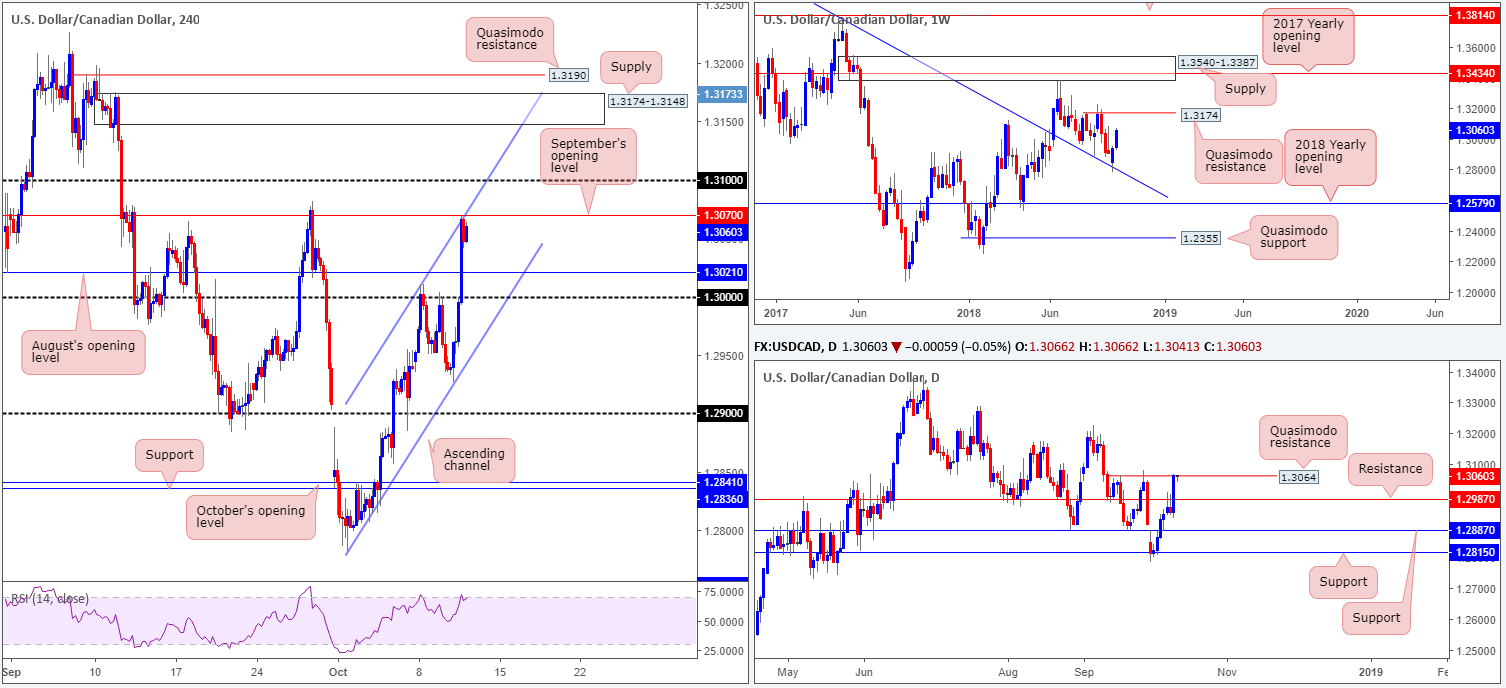
In view of last week’s robust bullish response off weekly trend line resistance-turned support (extended from the high 1.4689) that shows room to press as high as a weekly Quasimodo resistance level parked at 1.3174, further upside is still likely in this market.
Against the backdrop of weekly flow, however, daily price shows recent upside movement brought the market towards a Quasimodo resistance at 1.3064. A break of this level would likely open the gates for buyers to challenge the aforementioned weekly Quasimodo resistance level.
As of current price on the H4 timeframe, the candles are seen engaging with September’s opening level at 1.3070 that happens to converge nicely with a channel resistance (extended from the high 1.3009). A break of this level to the upside and we’re immediately faced with possible resistance from 1.31, shadowed closely by supply at 1.3174-1.3148 (glued to the underside of the weekly Quasimodo resistance at 1.3174).
Areas of consideration:
Intraday, the market could potentially observe a pullback today from 1.3070 towards August’s opening level at 1.3012/key figure 1.30. We say this for two reasons (1) many traders may look to cover long positions after yesterday’s strong move north and (2) let’s not forget we have a daily Quasimodo resistance at 1.3064 in play.
Although weekly price portends higher prices, buying is restricted given the current resistances on both daily and H4 timeframes. With that in mind, focus can be brought to the H4 Quasimodo resistance at 1.3190 (positioned above the H4 supply at 1.3174-1.3148) for longer-term shorts owing to its convergence with the weekly Quasimodo resistance mentioned above at 1.3174. Stop-loss orders in this case are best suited above 1.3226: the apex of the weekly Quasimodo formation.
Today’s data points: US CPI m/m; Treasury Currency Report.
USD/CHF:
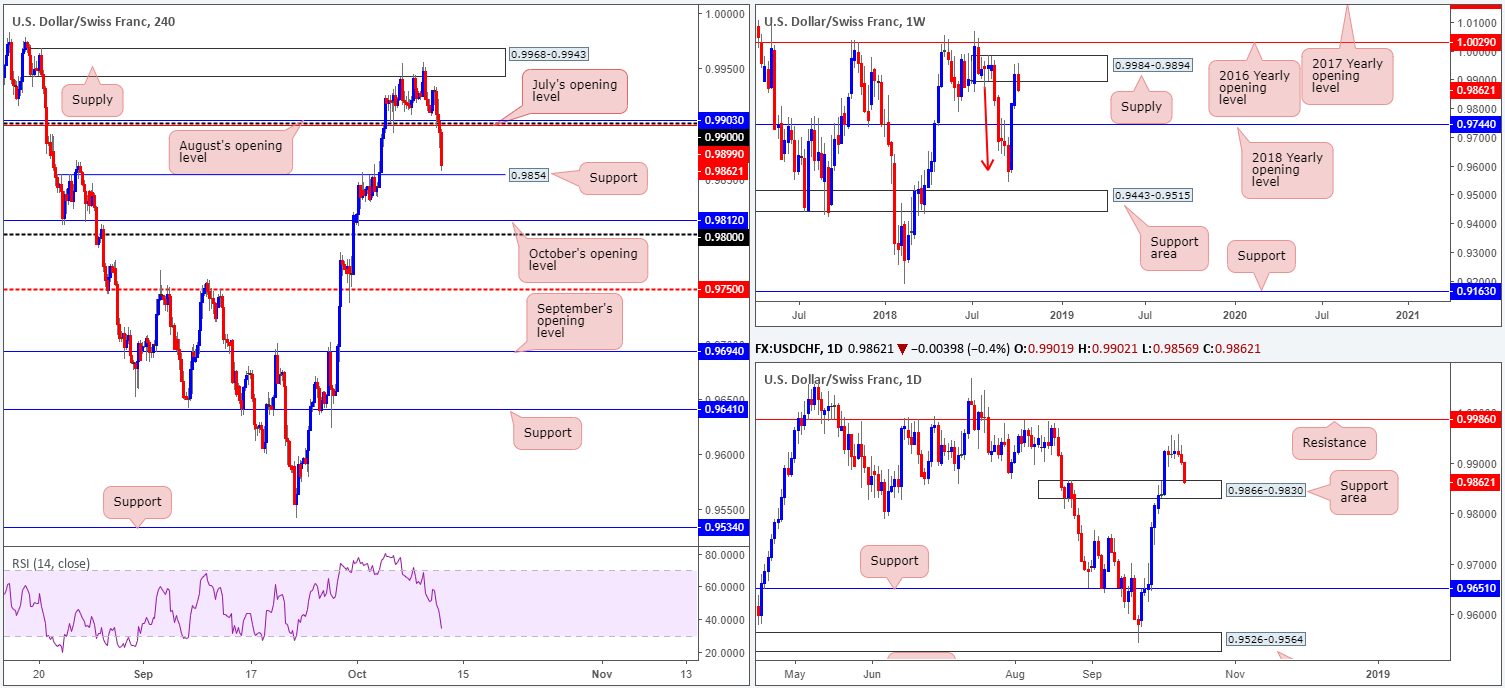
Broad-based USD selling pressured the USD/CHF lower amid trade on Wednesday, filtering through the 0.99 handle on the H4 timeframe, and its closely converging monthly opening levels from August and July at 0.9903 and 0.9899, respectively. As is evident from the H4 chart, the candles are hovering within touching distance of support priced in at 0.9854. A violation of this level has October’s opening level at 0.9812/0.98 handle to target.
On the higher timeframes, weekly players are seen responding from supply at 0.9984-0.9894, with the possibility of eventually pressing as low as the 2018 yearly opening level at 0.9744. On the other side of the spectrum, though, we now have daily price interacting with the top edge of a supply-turned support area located at 0.9866-0.9830. A break of this area will likely be considered a strong bearish cue towards the noted 2018 base on the weekly scale.
Areas of consideration:
Pressure from the weekly timeframe makes buying this market difficult, despite both H4 and daily charts emphasizing supportive structure at the moment.
To our way of seeing things, traders have two choices here, either pass on the market given the opposing structures, or look for shorts in an attempt to join weekly momentum. A retest at the underside of 0.99 could be of interest to some traders. Backed with a supporting H4 bearish candlestick formation, this will probably be sufficient enough to draw attention and push lower. However, do remain cognizant of daily and H4 supports. Reduce risk as soon as possible and trail price accordingly.
Today’s data points: US CPI m/m; Treasury Currency Report.
Dow Jones Industrial Average:
US equities registered enormous losses on Wednesday, exceeding 3% for the Dow Jones Industrial Average and more than 4% for the tech-heavy Nasdaq 100. Concerns over US/China trade and rising Treasury yields brought about a flight to safety, consequently weighing on equity indexes.
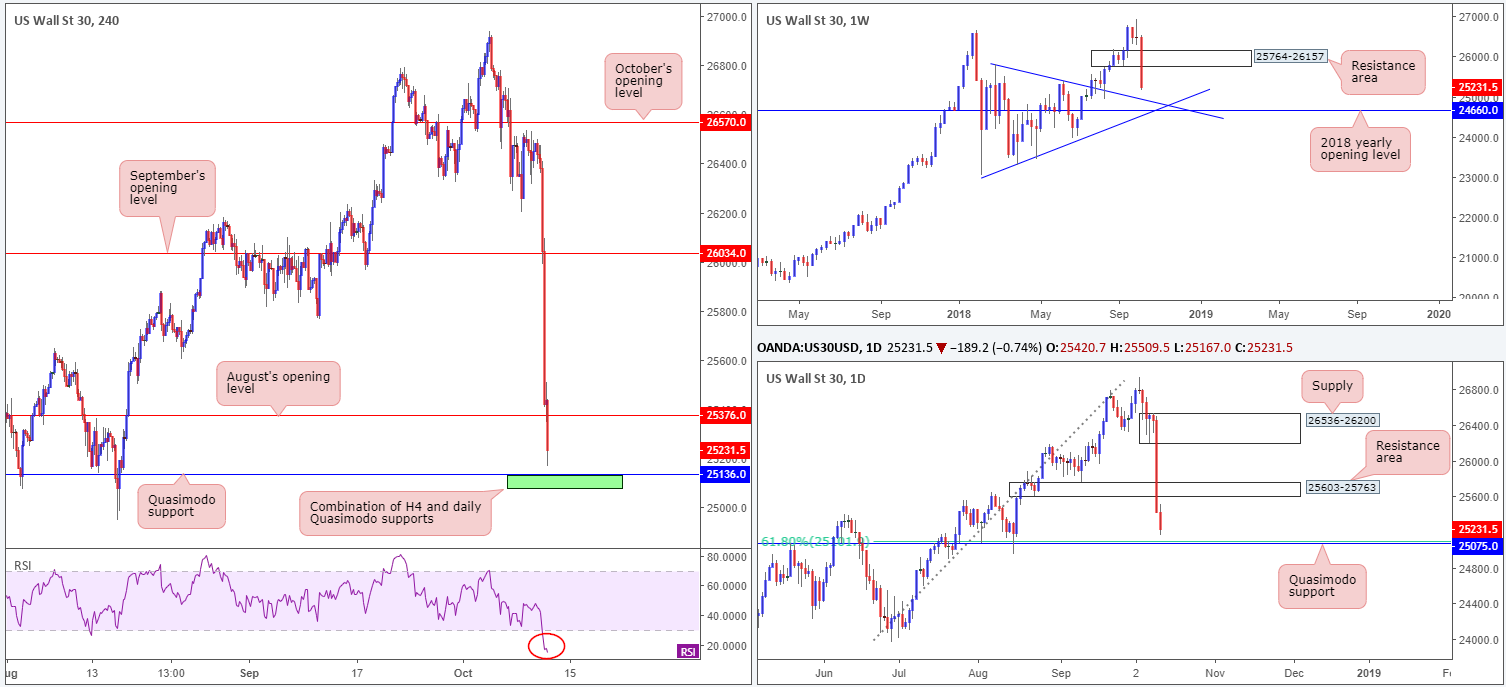
From a technical perspective, weekly activity engulfed its demand area at 25764-26157 (now acting resistance zone) and appears poised to challenge a nearby trend line resistance-turned support (taken from the high 25807), which hovers just north of the 2018 yearly opening level at 24660.
A closer look at the action on the daily timeframe suggests further selling could be on the cards until we shake hands with Quasimodo support priced in at 25075/61.8% Fib support at 25101. Note this level is sited just ahead of the aforementioned weekly trend line support.
Intraday movement on the H4 scale recently crossed beneath August’s opening level at 25376, landing the unit within close proximity to a Quasimodo support at 25136 (situated just above the daily Quasimodo support mentioned at 25075). Also worth noting is the RSI indicator trades deep within oversold territory.
Areas of consideration:
In light of H4 and daily Quasimodo supports forming a possible floor in this market at 25075/25136 (green area marked on the H4 timeframe), we could potentially see buyers attempt to defend this zone today. Failure to do so will likely result in the weekly trend line support entering the fray!
Waiting for additional candle confirmation before entering long from 25075/25136 is strongly recommended as sellers remain strong in Asia. The first area of concern, should buying enter the fold, falls in around the underside of August’s opening level at 25376, followed by a daily resistance area plugged in at 25603-25763.
Today’s data points: US CPI m/m; Treasury Currency Report.
XAU/USD (Gold):
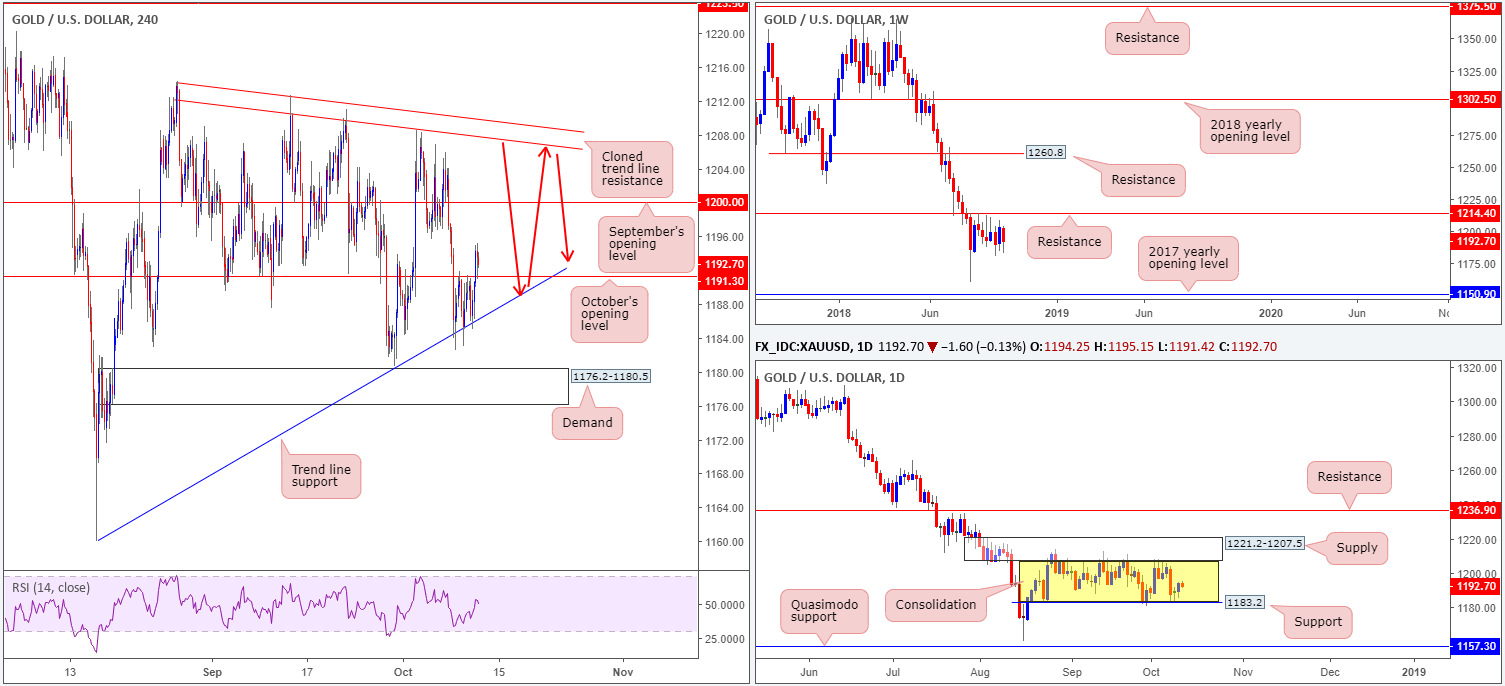
Kicking off this market with a look at the weekly timeframe, the yellow metal remains languishing beneath key resistance at 1214.4. As highlighted in past reports, further selling on this timeframe has the 2018 yearly low of 1160.3 to target, followed closely by the 2017 yearly opening level at 1150.9.
Although we have weekly price indicating it may be heading lower in the future, daily flow is busy carving out a consolidation between notable supply at 1221.2-1207.5 and support coming in from the 1183.2 mark. A break out of this consolidation to the downside will likely revive shorts in this market, targeting the 2018 yearly low mentioned above at 1160.3.
Since the beginning of October, the H4 candles have been compressing between two opposing trend lines (1160.3/1214.3 – meeting the characteristics of a bearish pennant pattern which as we know is considered a continuation pattern). In between the bearish pennant formation, however, are two monthly opening levels to keep an eye on from October and September at 1191.3 and 1200.0, respectively.
Areas of consideration:
Given the current landscape, our previous outlook remains in place:
Ultimately, traders are likely looking for the H4 bearish pennant to complete and breakout south. Should this come to fruition and price engulfs H4 demand at 1176.2-1180.5, shorts are high probability at this point, targeting the 2018 yearly low of 1160.3.
Until this happens, however, the H4 bearish pennant could continue to compress (as per the red arrows), by which traders could attempt to fade till broken. However, given the likelihood of fakeouts occurring around these extremes, waiting for H4 candlestick confirmation to emerge before pulling the trigger is likely the better (safer) path to take right now.
The use of the site is agreement that the site is for informational and educational purposes only and does not constitute advice in any form in the furtherance of any trade or trading decisions.
The accuracy, completeness and timeliness of the information contained on this site cannot be guaranteed. IC Markets does not warranty, guarantee or make any representations, or assume any liability with regard to financial results based on the use of the information in the site.
News, views, opinions, recommendations and other information obtained from sources outside of www.icmarkets.com.au, used in this site are believed to be reliable, but we cannot guarantee their accuracy or completeness. All such information is subject to change at any time without notice. IC Markets assumes no responsibility for the content of any linked site. The fact that such links may exist does not indicate approval or endorsement of any material contained on any linked site.
IC Markets is not liable for any harm caused by the transmission, through accessing the services or information on this site, of a computer virus, or other computer code or programming device that might be used to access, delete, damage, disable, disrupt or otherwise impede in any manner, the operation of the site or of any user’s software, hardware, data or property.
