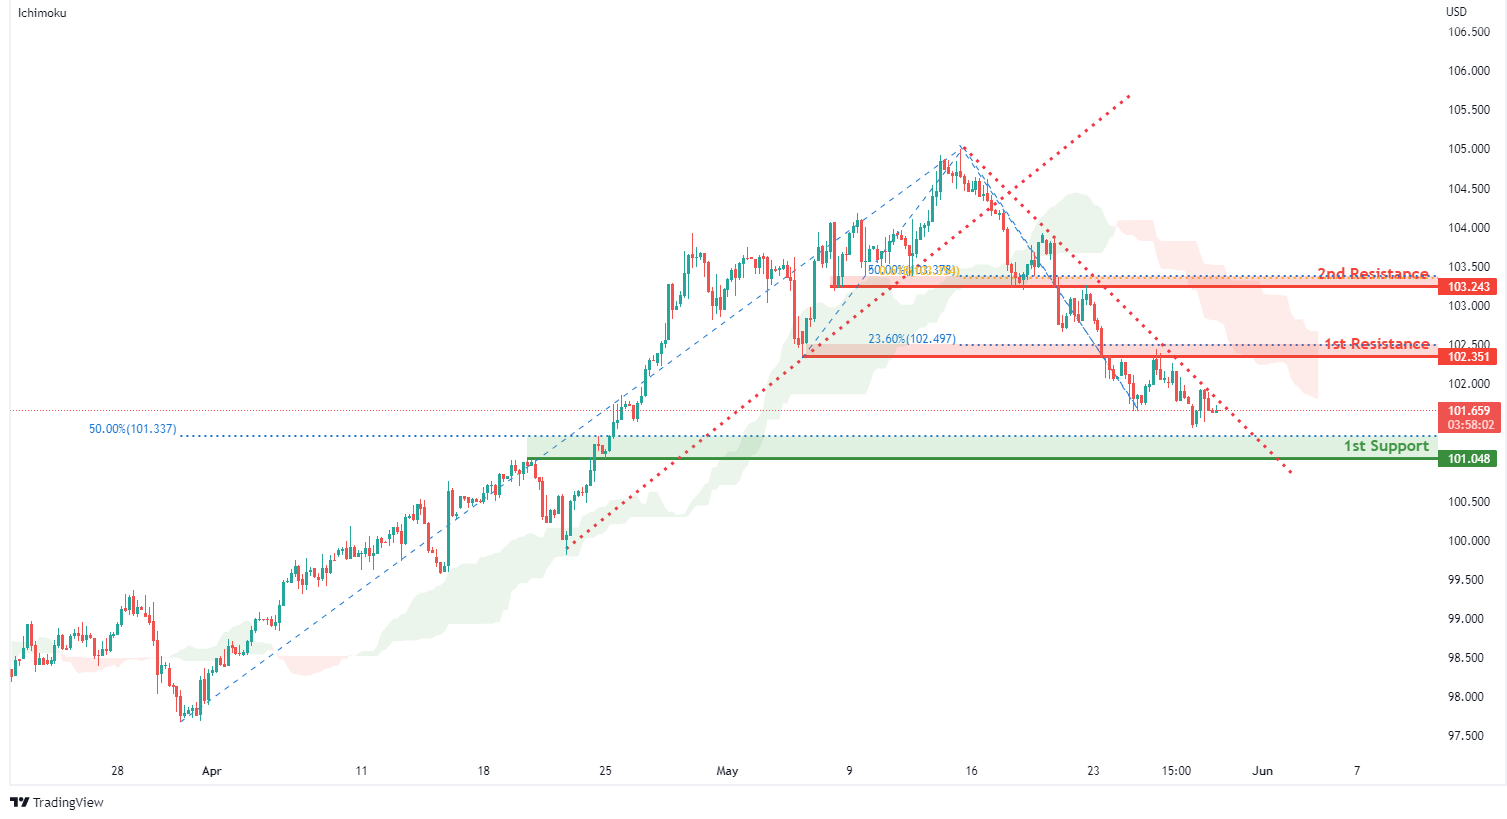
DXY:
On the H4, with prices moving below the ichimoku indicator and breakout from the ascending trendline, we have a bearish bias that price will drop to our 1st support at 101.048 where the horizontal pullback support and 50% Fibonacci retracement are from our 1st resistance at 102.351 in line with the horizontal overlap resistance and 23.6% fibonacci retracement. Alternatively, price may break 1st resistance structure and head for 2nd resistance at 103.243 where the horizontal overlap resistance, 61.8% fibonacci projection and 50% fibonacci retracement are.
Areas of consideration:
- H4 time frame, 1st resistance at 102.351
- H4 time frame, 1st support at 101.048
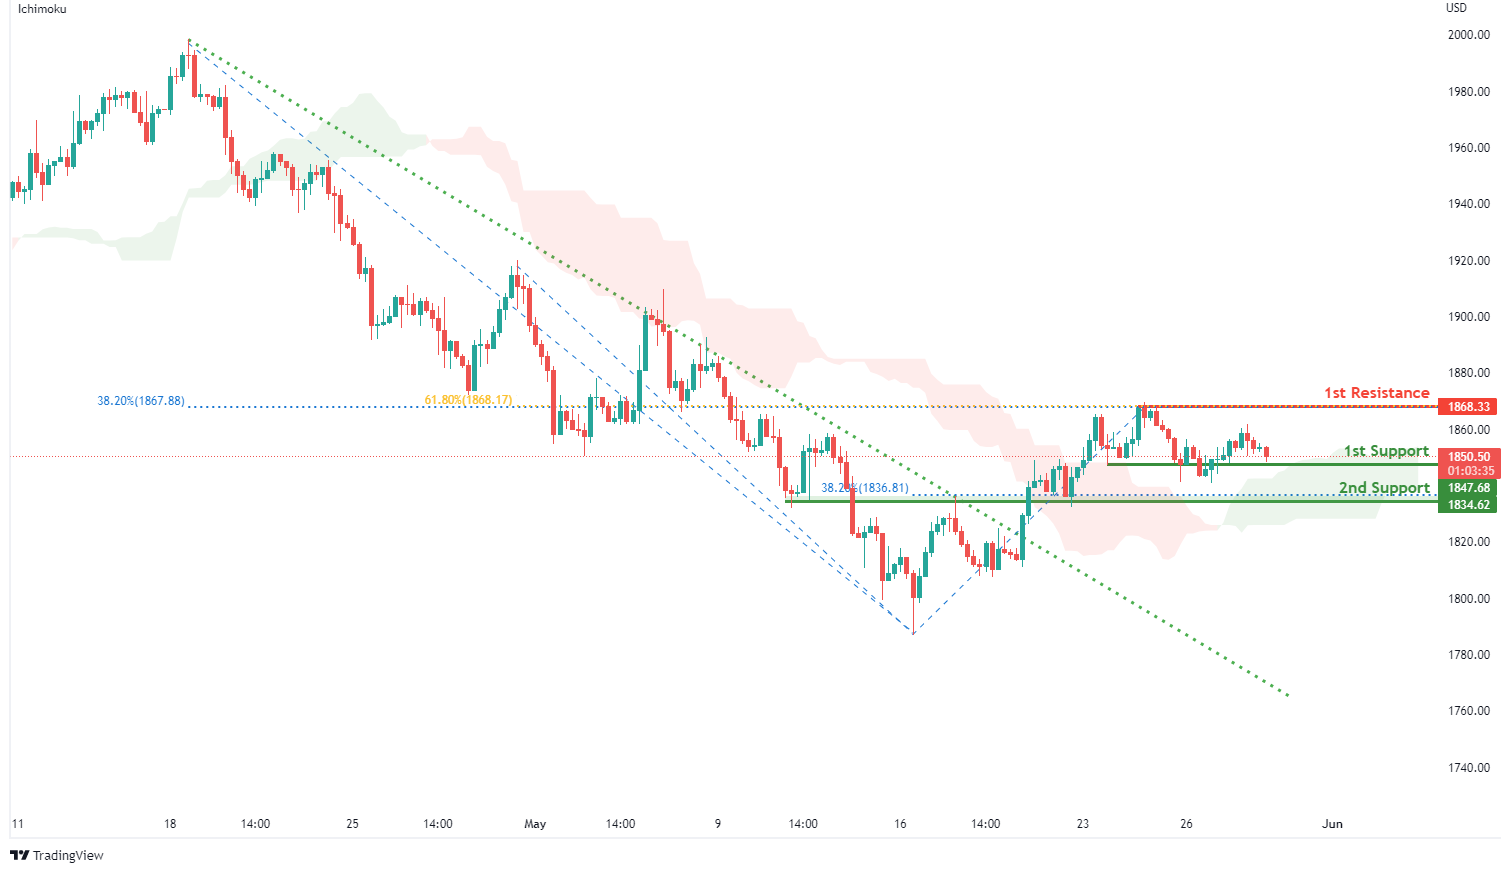
XAU/USD (GOLD):
On the H4, with prices moving above the ichimoku cloud and breakout from descending trendline, we have a bullish bias that price will rise from our 1st support at 1847.68 where the horizontal pullback support is to our 1st resistance at 1868.33 in line with the horizontal swing high resistance,61.8% Fibonacci retracement and 38.2% Fibonacci retracement. Alternatively, price may break 1st support structure and head for 2nd support at 1834.62 where the horizontal overlap support and 38.2% fibonacci retracement are.
Areas of consideration:
- H4 time frame, 1st Resistance at 1868.33
- H4 time frame, 1st Support at 1847.68
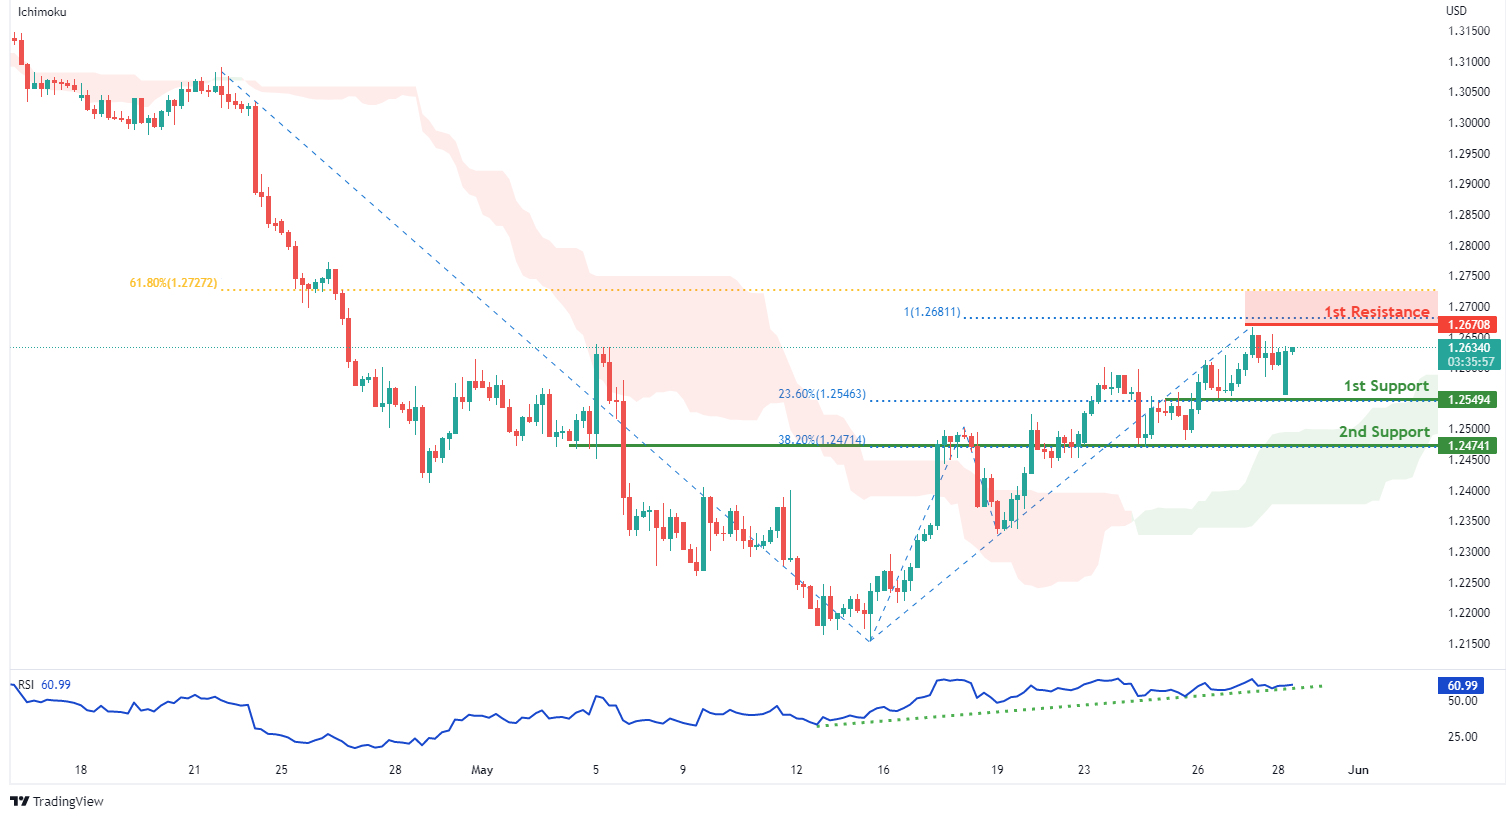
GBP/USD:
On the H4, with price moving above the ichimoku indicator and the RSI indicator moving in an uptrend momentum, we have a bullish bias that price will rise from our 1st support at 1.25494 where the horizontal overlap support and 23.6% fibonacci retracement are to our 1st resistance at 1.26708 in line with the 61.8% Fibonacci retracement, 100% Fibonacci projection and swing high resistance. Alternatively, price may break 1st support structure and head for 2nd support at 1.24741 where the horizontal overlap support and 38.2% Fibonacci retracement are.
Areas of consideration:
- H4 1st resistance at 1.26708
- H4 1st support at 1.25494
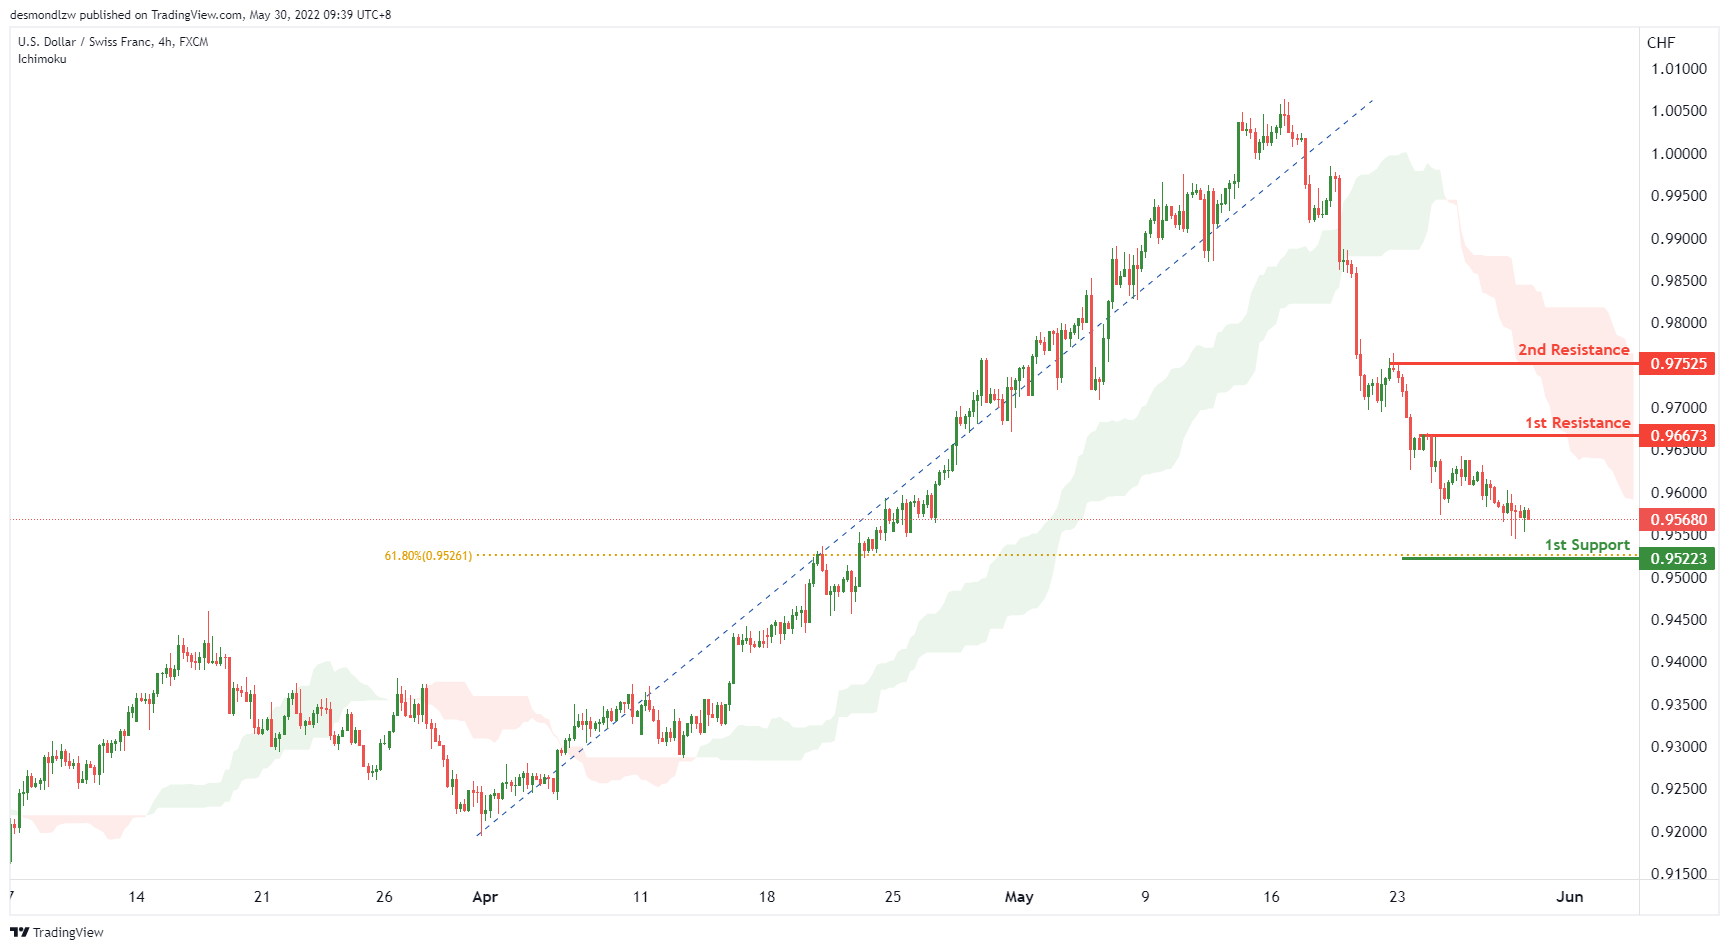
USD/CHF:
On the H4, with price moving below the ichimoku cloud, we have a bearish bias that price will drop to our 1st support at 0.95223 where the 61.8% Fibonacci retracement is from our 1st resistance at 0.96673 in line with the pullback resistance. Alternatively, price may break 1st resistance structure and head for 2nd resistance at 0.97525 where the swing high resistance is.
Areas of consideration
- 1st support level at 0.95223
- 1st resistance level at 0.96673
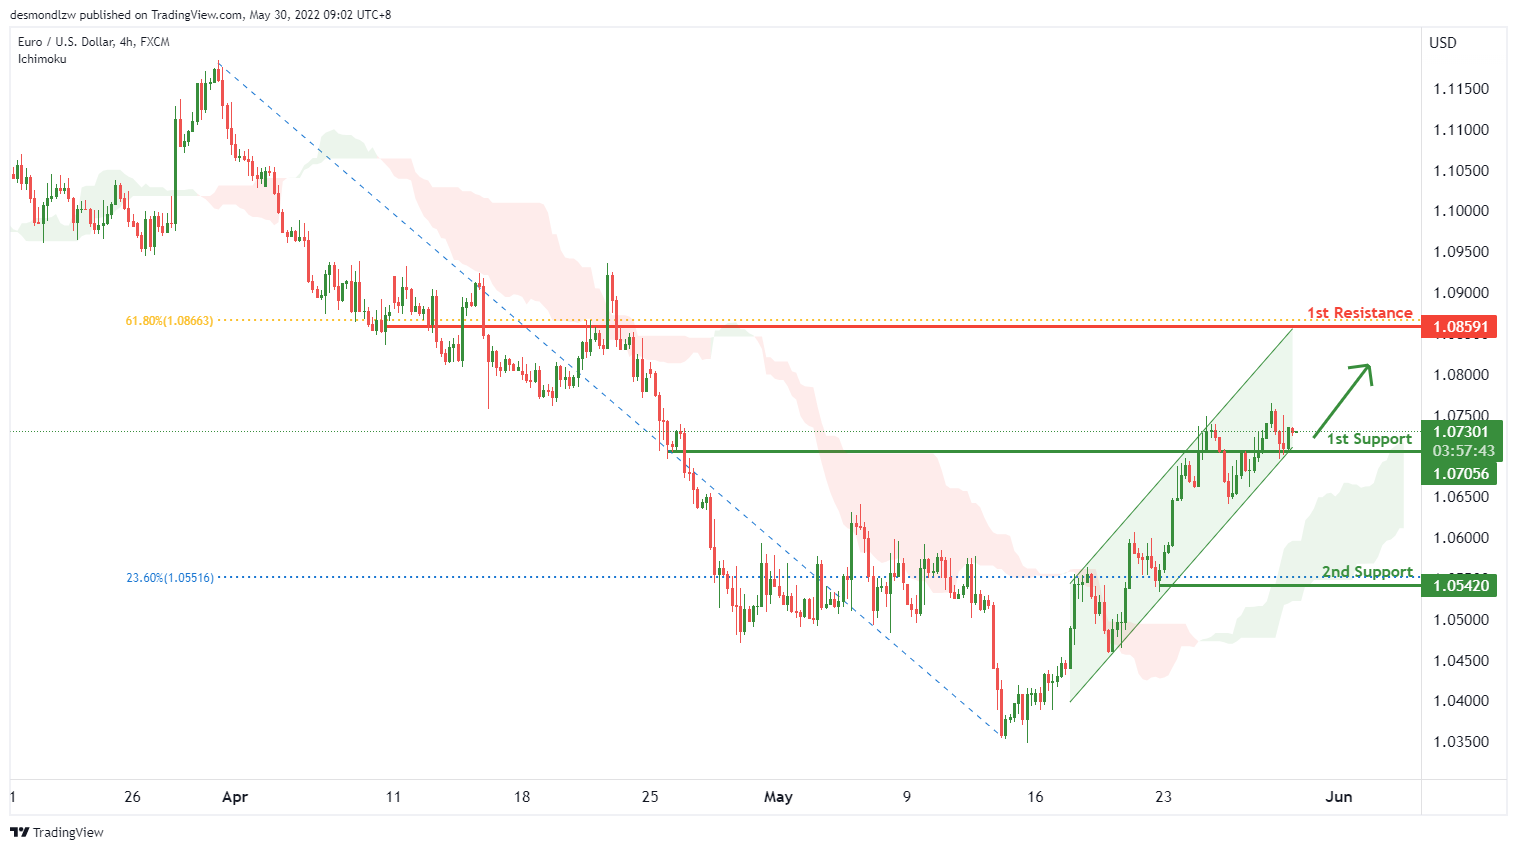
EUR/USD :
On the H4, with price moving above the ichimoku cloud and within the ascending trend channel, we have a bullish bias that price will rise to our 1st overlap resistance at 1.0591 where the 61.8% Fibonacci retracement is from our 1st support at 1.070556, where price has recently bounced off. Alternatively, price may break 1st support structure and head for 2nd support at 1.0542in line with the 23.6% fibonacci retracement.
Areas of consideration :
- H4 1st resistance at 1.0591
- H4 1st support at 1.070556
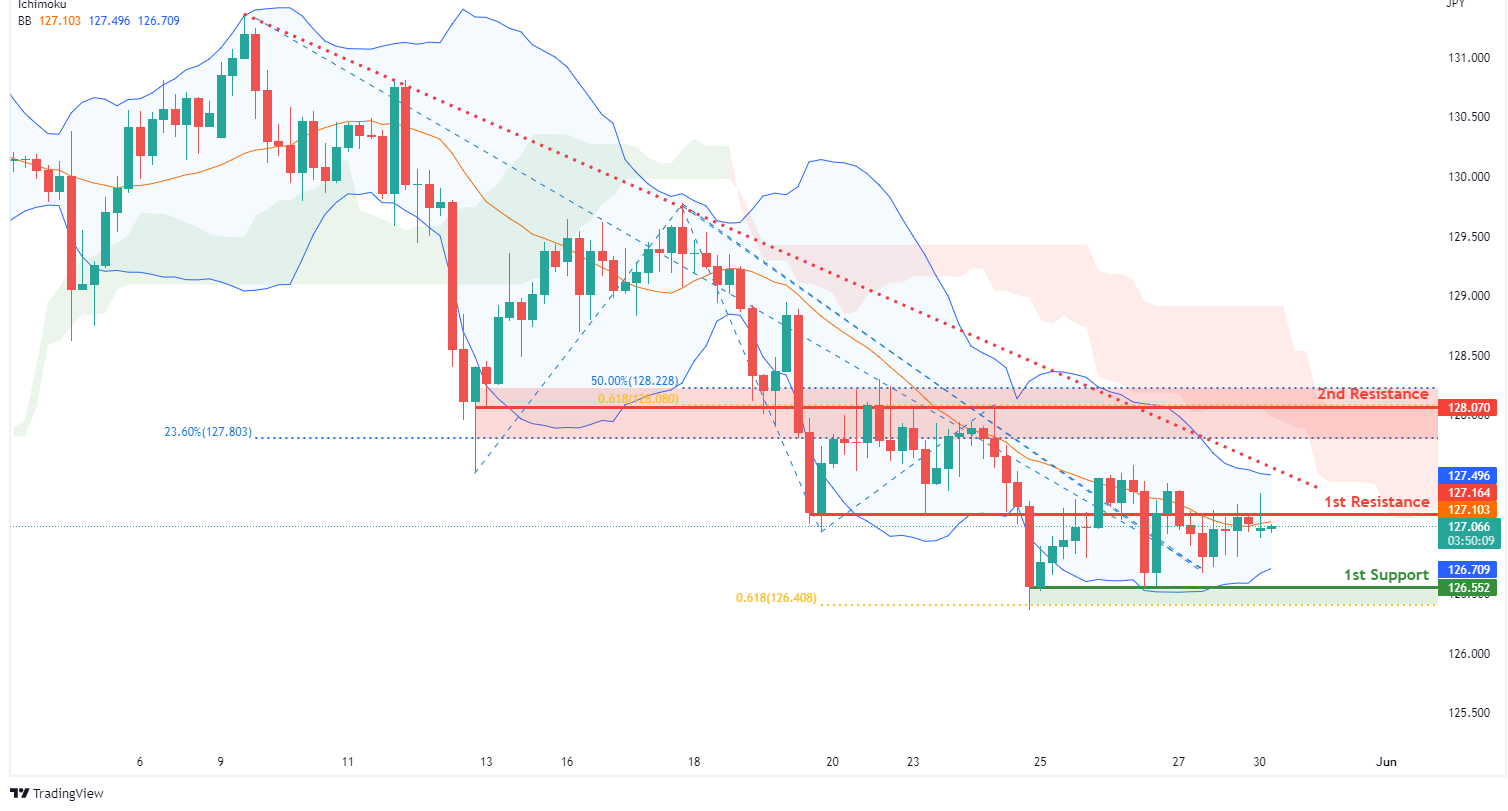
USD/JPY:
On the H4, with prices moving below the ichimoku indicator and passing the basis line of the bollinger band in a downtrend, we have a bearish bias that price will drop from our 1st resistance at 127.164 where the horizontal overlap resistance is to our 1st support at 126.552 in line with the swing low support, 61.8% Fibonacci projection and 23.6% fibonacci retracement. Alternatively, price may break 1st resistance structure and head for 2nd resistance at 128.070 where the horizontal overlap resistance, 61.8% fibonacci projection and 50% Fibonacci retracement are.
Areas of consideration:
- H4 time frame, 1st resistance at 127.164
- H4 time frame, 1st support at 126.552
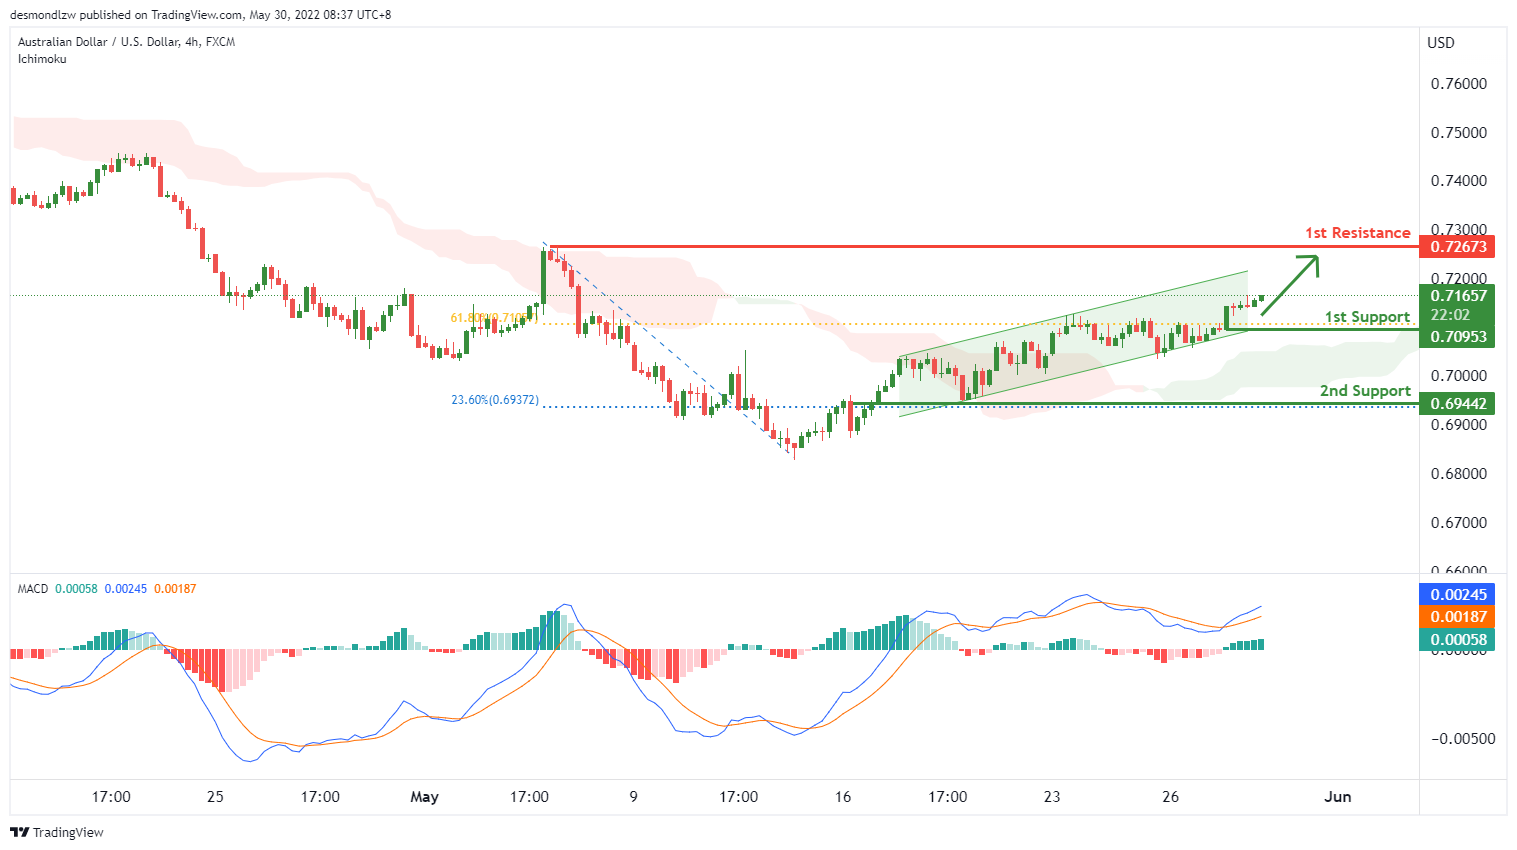
AUD/USD:
On the H1, with price moving above the ichimoku cloud and price moving within the ascending trend channel, we have a bullish bias that price will rise to our 1st resistance at 0.72673 where the swing high is from our 1st support at 0.70953 in line with the 61.8% Fibonacci retracement. Additionally, price is moving into a bullish pressure as shown in the MACD indicator which supports our bullish bias. Alternatively, price may break support structure and head for 2nd support at 0.69442 where the horizontal pullback support and 23.6% Fibonacci retracement is.
Areas of consideration
- H1 1st resistance at 0.72673
- H1 1st support at 0.70953
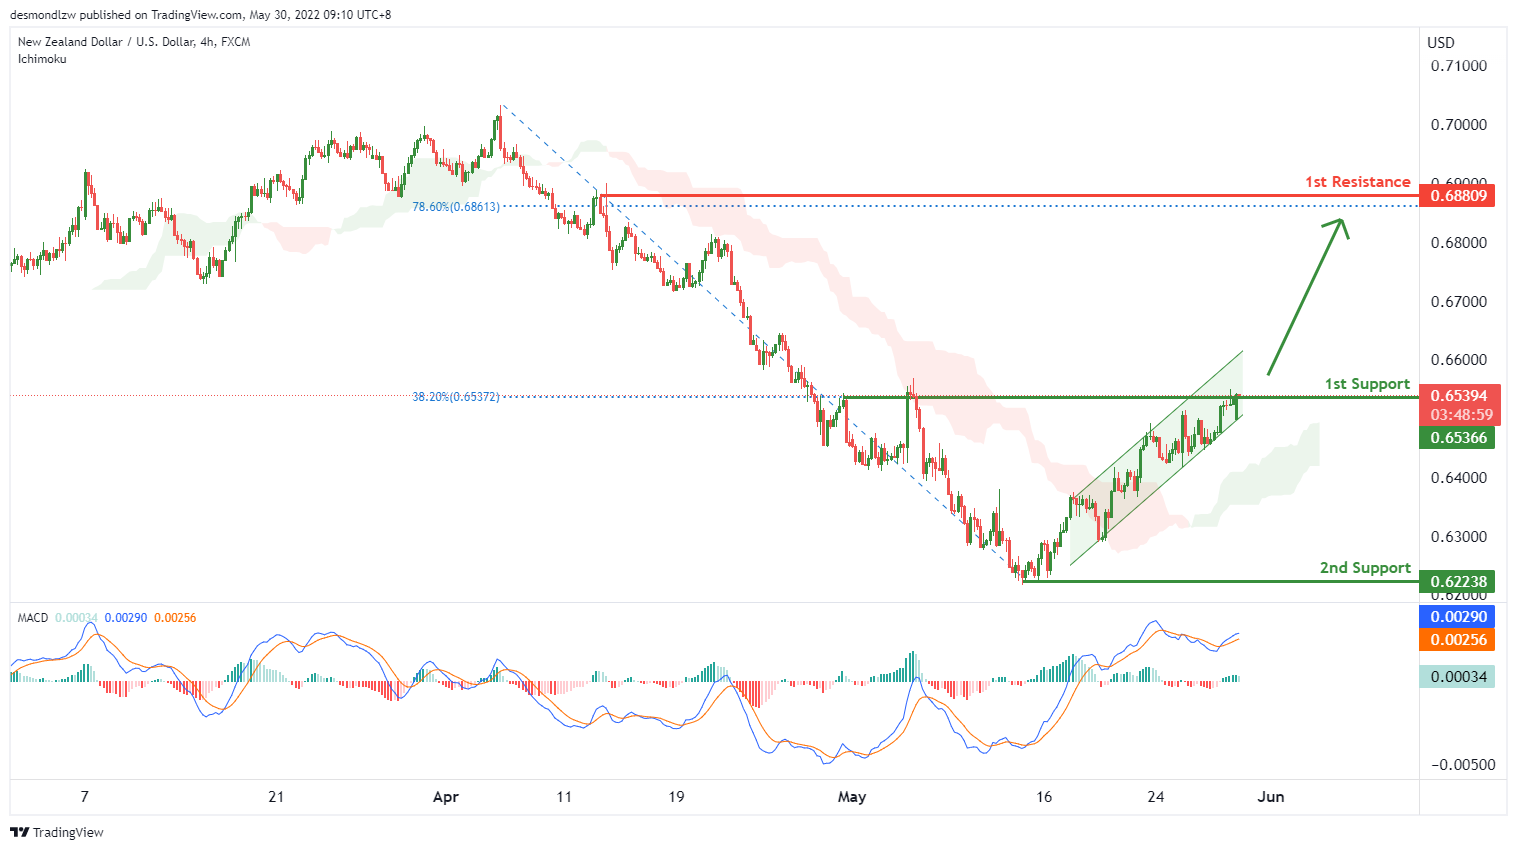
NZD/USD:
On the H4, with price moving above the ichimoku cloud, we have a bullish bias that price will rise to our 1st resistance at 0.68809 where the swing high resistance is in line with the 78.6% fibonacci retracement from our 1st support at 0.65366 in line with the overlap support and38.2% Fibonacci retracement. Additionally, price is moving in the bullish pressure area as shown on the MACD indicator. Alternatively, price may reverse from the support and head for 2nd support at 0.62238 in line with the swing low.
Areas of consideration:
- H4 time frame, 1st support at 0.65366
- H4 time frame, 1st resistance at 0.68809
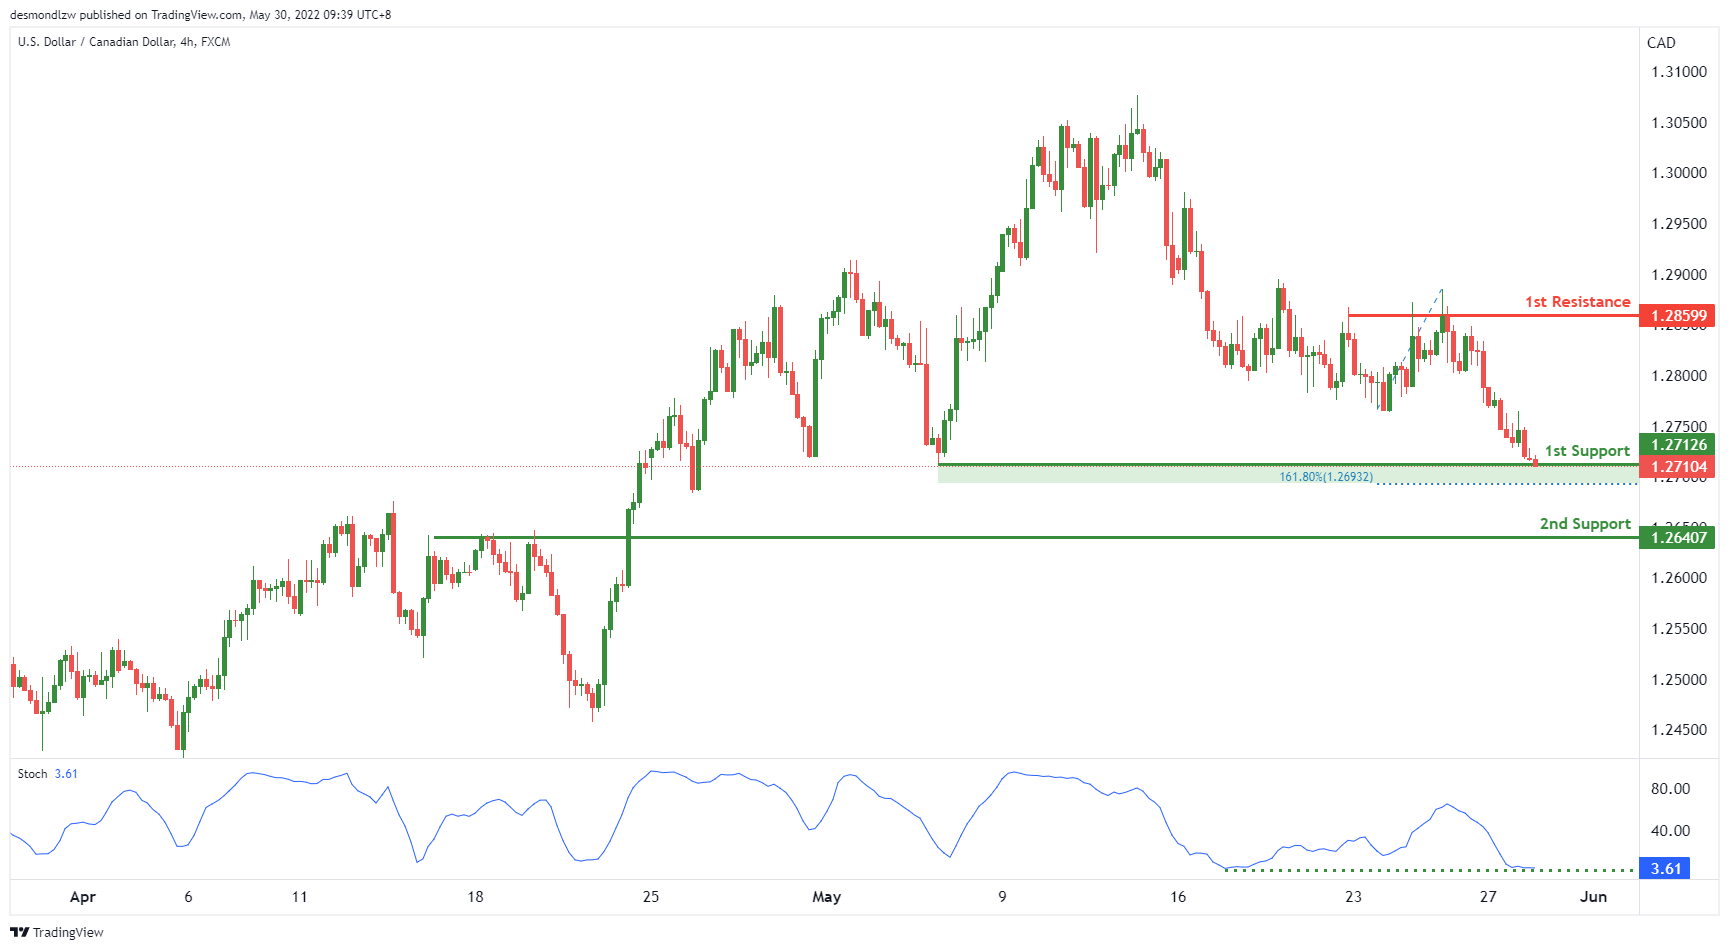
USD/CAD:
On the H4, with price expected to bounce off the stochastics, we have a bullish bias that price will rise to our 1st resistance at 1.28599 where the horizontal swing high resistance from our 1st support at 1.27126 in line with the swing low support.
Areas of consideration:
- H4 time frame, 1st resistance at 1.28559
- H4 time frame, 1st support at 1.27126
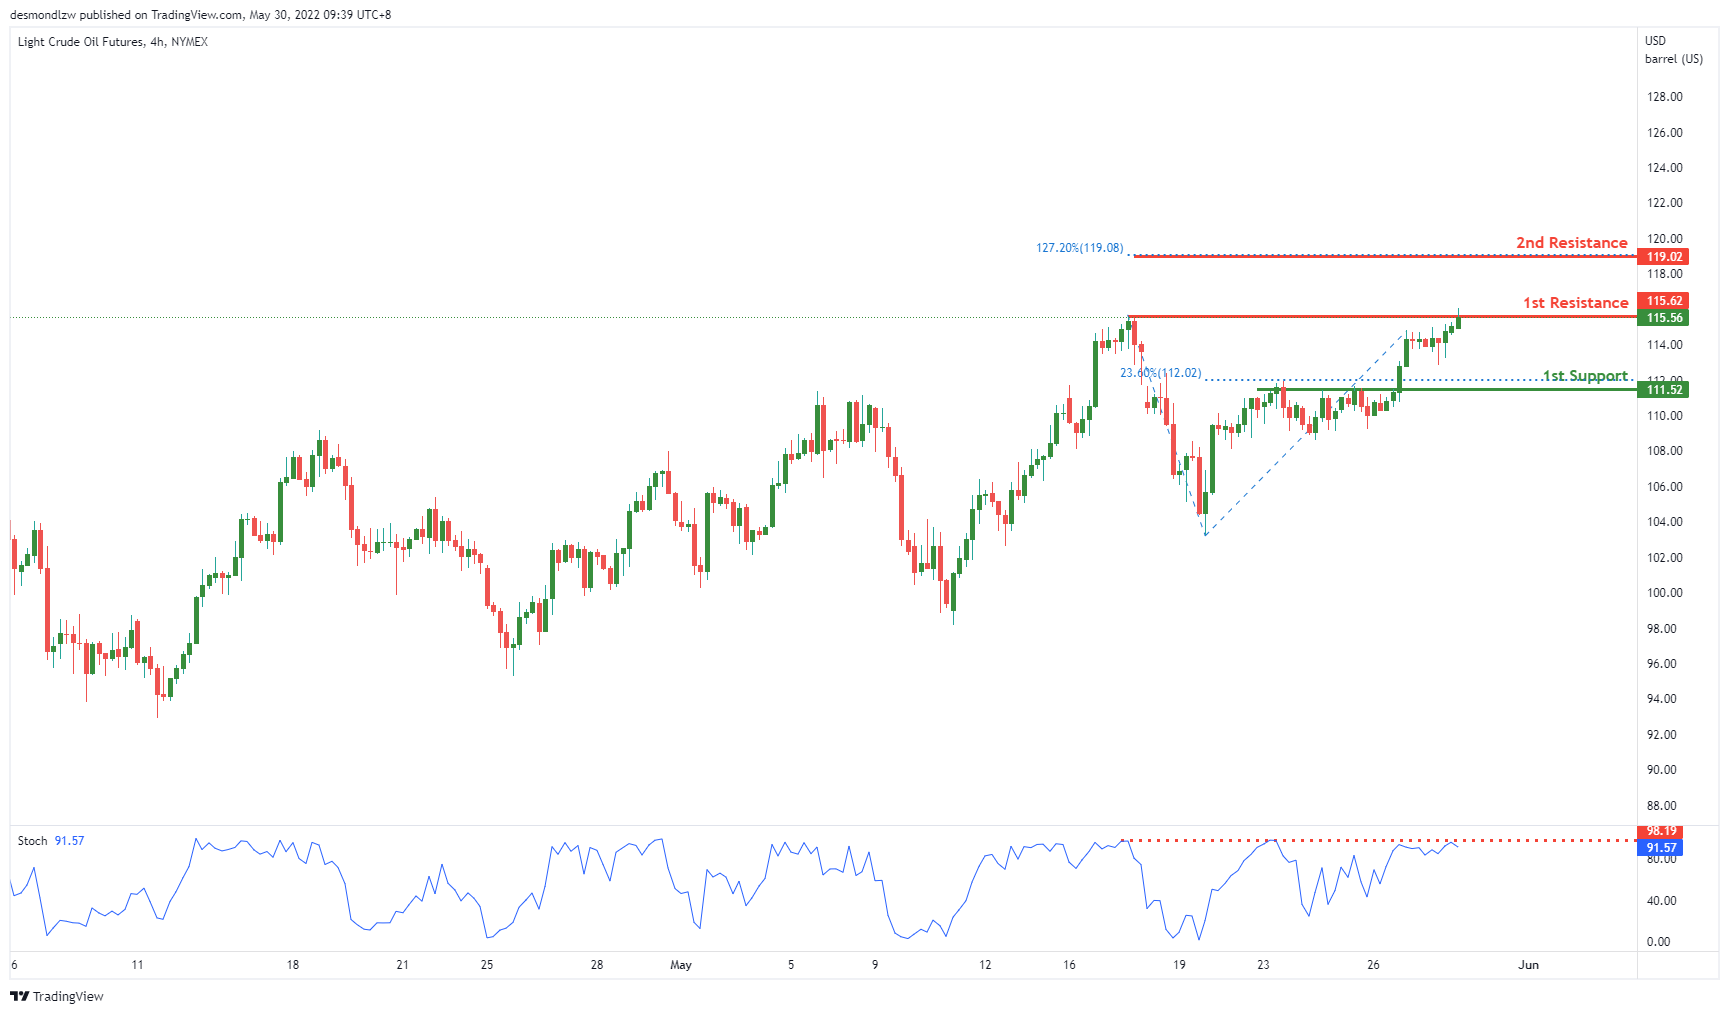
OIL:
On the H4, with price expected to reverse off the stochastics indicator, we have a bearish bias that price will drop to our 1st support at 111.62 where the 23.6% Fibonacci retracement is from our 1st resistance at 119.02 in line with the swing high resistance. Alternatively, price may break 1st resistance structure and head for 2nd resistance at 119.02 where the 127.2% Fibonacci extension is.
Areas of consideration:
- H4 time frame, 1st resistance of 119.02
- H4 time frame, 1st support of 111.52
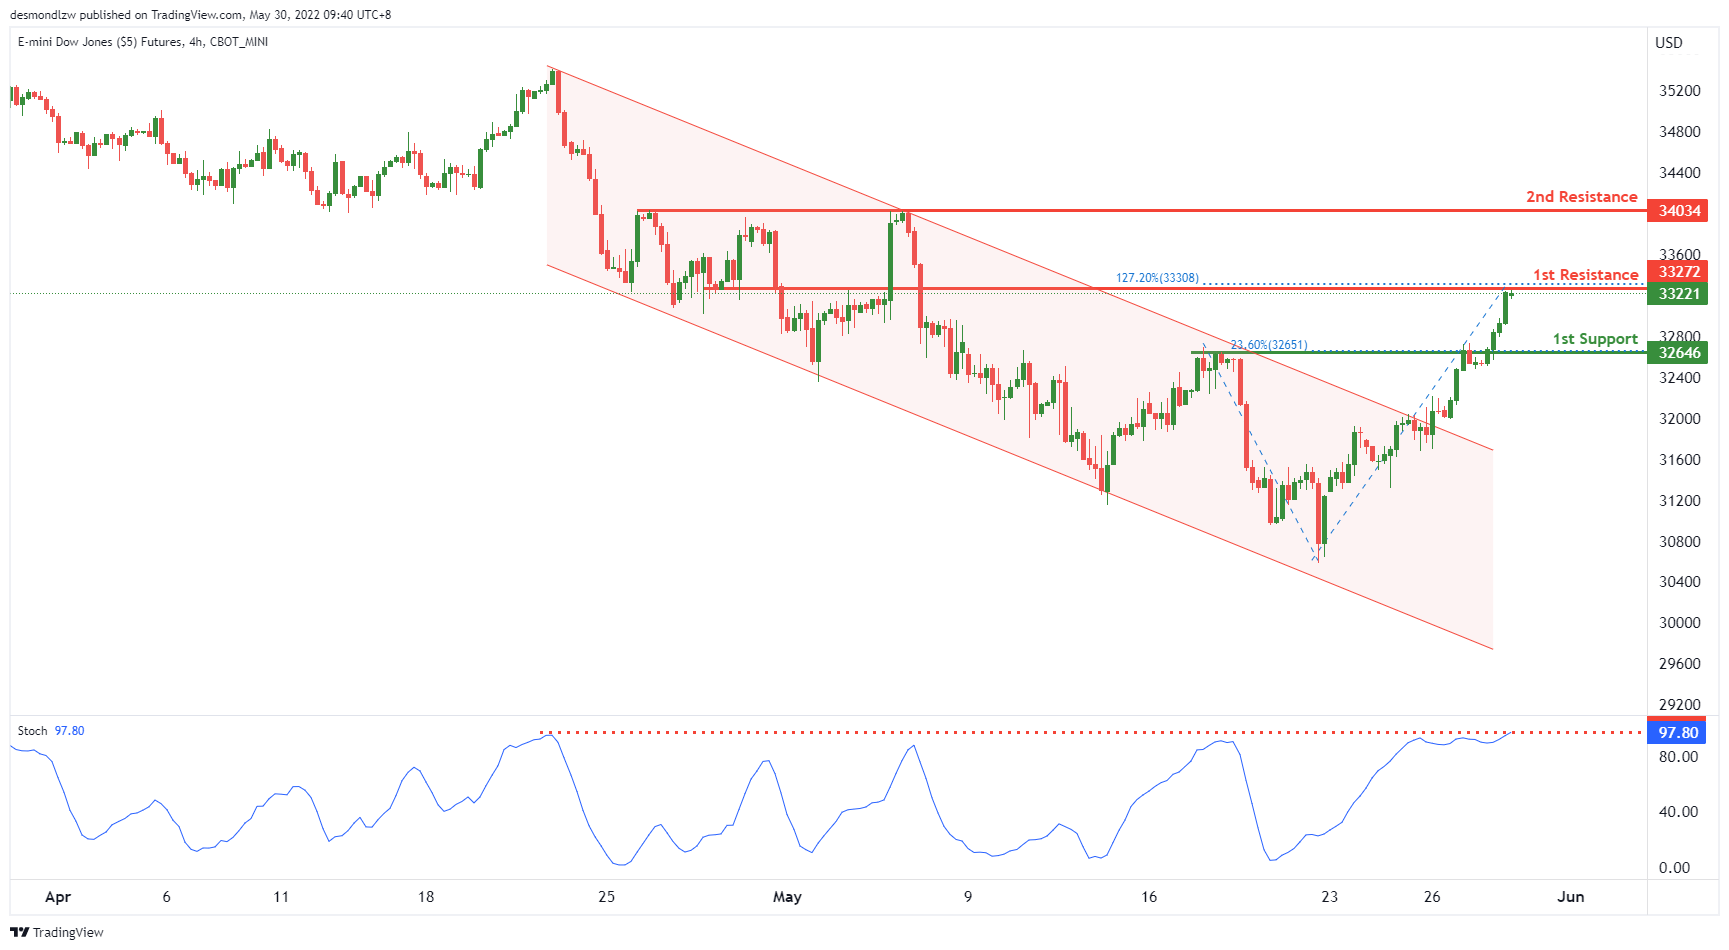
Dow Jones Industrial Average:
On the H4, with price expected to reverse off the stochastics indicator, we have a bearish bias that price will drop to our 1st support at 32646 where the 38.2% Fibonacci retracement is from our 1st resistance at 33221 in line with the swing high resistance. Alternatively, price may break 1st resistance structure and head for 2nd resistance where the horizontal swing high resistance is.
Areas of consideration :
- H4 time frame, 1st resistance at 33221
- H4 time frame, 1st support at 32646
The accuracy, completeness and timeliness of the information contained on this site cannot be guaranteed. IC Markets does not warranty, guarantee or make any representations, or assume any liability regarding financial results based on the use of the information in the site.
News, views, opinions, recommendations and other information obtained from sources outside of www.icmarkets.com.au, used in this site are believed to be reliable, but we cannot guarantee their accuracy or completeness. All such information is subject to change at any time without notice. IC Markets assumes no responsibility for the content of any linked site.
The fact that such links may exist does not indicate approval or endorsement of any material contained on any linked site. IC Markets is not liable for any harm caused by the transmission, through accessing the services or information on this site, of a computer virus, or other computer code or programming device that might be used to access, delete, damage, disable, disrupt or otherwise impede in any manner, the operation of the site or of any user’s software, hardware, data or property.


